London Education and Inclusion Project (LEIP): A cluster-randomised controlled trial protocol of an intervention to reduce antisocial behaviour and improve educational/occupational
Bạn đang xem bản rút gọn của tài liệu. Xem và tải ngay bản đầy đủ của tài liệu tại đây (790.75 KB, 16 trang )
Obsuth et al. BMC Psychology 2014, 2:24
/>
STUDY PROTOCOL
Open Access
London Education and Inclusion Project (LEIP): A
cluster-randomised controlled trial protocol of an
intervention to reduce antisocial behaviour and
improve educational/occupational attainment for
pupils at risk of school exclusion
Ingrid Obsuth1*, Alex Sutherland1, Liv Pilbeam1, Sarah Scott1, Sara Valdebenito1, Rosanna Carr2 and Manuel Eisner1
Abstract
Background: In 2011/12 about 6% of pupils in England who were in the last two years of compulsory education
(Years 10 and 11) experienced one or more fixed period school exclusionsa for disciplinary reasons and there are
roughly 300,000 fixed period exclusions every year in England and Wales (Department for Education, 2013a).
Excluded pupils are at a greatly increased risk of failing GCSE examinations, not being in employment, education or
training (NEET) at ages 16–24, and having criminal convictions as adolescents or young adults. To date, little or no
research has been conducted on programmes designed to improve outcomes for those at risk for fixed period
exclusions. Similarly, there is very little research on the effects of school disciplinary procedures, such as fixed period
exclusions, on outcomes for young people.
Method/Design: The current study attempts to fill these gaps via a cluster-randomised controlled field experiment
designed to evaluate the effectiveness of a social and communication skills based intervention for Year 9 and 10
pupils at high risk for fixed-term exclusion during the 2013/14 academic year in selected Greater London schools.
The project will chart the short-, medium- and long-term effects of the intervention on the participants, as well as
track the participants via administrative records over time.
Discussion: It is an independent evaluation, in which the role of the evaluation and the programme
implementation are separated and carried out by two independent teams funded by different agencies.
Trial registration: Current Controlled Trials: ISRCTN23244695 (14 Jan 2014).
Keywords: Fixed-term school exclusion, High-risk adolescents, Disciplinary procedures, Schools
Background
What is exclusion?
The 2002 Education Act governs the use of school exclusion as a disciplinary measure and defines two types
of exclusion: permanent and fixed term.b Permanent
exclusion means that a pupil is permanently removed
from a given school whereas fixed term exclusion lasts
between one and a maximum of 45 days per school year
* Correspondence:
1
Institute of Criminology, University of Cambridge, Sidgwick Avenue,
Cambridge CB3 9DA, UK
Full list of author information is available at the end of the article
(i.e., nearly 25% of a 39 week school year; for more
details, see: Centre for Social Justice, 2011). There were
304,370 fixed period exclusions across all maintained
primary, state-funded secondary and special needs
schools in 2011/12, equating to 4.05% of the school
population being given a fixed term exclusion at least
once during that school year (Department for Education,
2013a). Most school exclusions occur during secondary
school, between ages 11 and 16. The rate of exclusion
peaks during the last three years of compulsory school
(i.e., Years 9–11). Amongst these cohorts, 7.8% of male
© 2014 Obsuth et al.; licensee BioMed Central Ltd. This is an Open Access article distributed under the terms of the Creative
Commons Attribution License ( which permits unrestricted use, distribution, and
reproduction in any medium, provided the original work is properly credited. The Creative Commons Public Domain
Dedication waiver ( applies to the data made available in this article,
unless otherwise stated.
Obsuth et al. BMC Psychology 2014, 2:24
/>
pupils and 3.6% of female pupils experience exclusion at
least once per school year.
If a pupil is subject to a fixed term exclusion of six
days or more, schools must provide alternative full-time
education (the so-called ‘six-day rule’). Headteachers arrange a reintegration interview with the parents of pupils
excluded at primary school and for pupils excluded for
more than five days at secondary schools. However,
schools are only required to provide homework if a pupil
is excluded for less than six days (Department for
Education, 2013b).
Who is excluded?
Male pupils, children from deprived and (some) ethnic
minority backgrounds are much more likely to be
excluded than their counterparts (see Department for
Education, 2013a).c In particular, children with special educational needs (SEN) experience rates of exclusion far
higher than their counterparts. For example, around 11%
of SEN pupils were temporarily excluded from secondary
schools in 2011/12. By comparison, only 2.55% of students
without SEN experienced school exclusion (Department
for Education, 2013a). Meltzer (2003) also found that the
rate of exclusion is significantly higher (between 10–25
times the prevalence in other groups) for children with diagnosed conduct/hyperkinetic disorders or mental health
problems. Excluded children are also often at an early disadvantage as many are found to have educational difficulties that were not identified or adequately addressed
earlier (Macrae et al. 2003). In addition, up to 66% of excluded children are reported to have communication difficulties, identified or not by their schools (Clegg et al.
2009). Excluded children are also disproportionately likely
to come from lone-parent families, families where parents
have educational difficulties of their own, or have stressful
home environments in general (Macrae et al. 2003; Munn
et al. 2000). To summarise, the demographic and socioeconomic patterns of who is excluded do not appear to
have changed substantially: those who are poor; males;
from ethnic minority backgrounds; with pre-existing physical, social, or psychological difficulties, or educational
needs; are typically those who are excluded from schools
in England.
Why are children excluded?
Government data show that three-quarters of fixed term
exclusions in the UK are for aggressive externalising behaviour.d Most (recorded) exclusions appear to be a direct
and routine response to aggressive or disruptive behaviour,
but schools retain considerable discretion with regard to
the length of exclusion and whether to exclude or not.
Macrae and colleagues (2003) point to several key factors
that contribute to the decision to exclude, including the
disciplinary policies and the level of tolerance of the
Page 2 of 16
headteachers in individual schools. We know that, for
example, rules and enforcement regarding school uniform
varies between schools. Whilst school uniforms are
strongly encouraged by the Department for Education,
there is no general, nation-wide legislation regulating their
implementation or endorsement (Department for Education, 2013c). As such, school policies should also be included in a discussion about reasons why children are
excluded (see Galloway et al. 1985; Hayden 2009). A more
ephemeral institutional factor, which features heavily in
discussions about the possible criminogenic effects of
school exclusion and the extent to which ‘school effects’
exist, is school ethos (see Rutter et al. 1979; Boxford
2006)e.
What effect(s) does exclusion have?
In the short-term and medium-term, school exclusion is
correlated with several behavioural and educational
problems. For the young person, school exclusion has
been found to be related to poor academic and occupational outcomes, externalizing behaviour including
crime and negative internalizing outcomes, such as selfharm (Massey 2011; Sparkes 1999; Graham 1988;
McAra and McVie 2010). Furthermore, Gilbertson
(1998) showed that 42% of sentenced juvenile offenders
had experienced, a previous school exclusion. In the
long-term, school exclusion is correlated with later unemployment.f Speilhofer (2009) showed that amongst
those young people who were long-term NEET (Not in
Education, Employment or Training) the majority have
previous exclusions and truancy. A recent study also
suggests that approximately 50% of excluded children
become NEET within two years after their exclusion
(Massey 2011). Taken together these data suggest that
children who are subject to temporary or permanent
school exclusion are at a much greater risk of behavioural, health-related, occupational and educational
difficulties.
However, it is important to point out that while these
studies are very convincing in supporting a strong link between school exclusions and adverse outcomes prospectively and retrospectively, they do not address the issue of
a causal relation in this link. In other words, from the evidence thus far, it is not clear whether school exclusion is
simply a marker or a causal factor in subsequent negative
development. In fact, it is possible, that school exclusions
as well as the commonly assessed adverse ‘outcomes’ are
both the consequence of a common third factor or factors,
for example, a personality characteristic of the young person, combined with characteristics of the family, school,
or particular policy. To address the question of causality
one would want to carry out an experiment, in which
young people would be randomly assigned to being excluded or not. In this way, school exclusion would be the
Obsuth et al. BMC Psychology 2014, 2:24
/>
only systematic difference between the two groups, thus
any subsequent difference between the groups could be attributed to school exclusion. However, for ethical reasons
this is not an experiment one can carry out. For situations
such as these, where random assignment is not easily
achievable, researchers (e.g., Jaffee et al. 2012) have called
for differentiating causal links utilizing propensity score
matching PSM (Rosenbaum and Rubin 1983; Rosenbaum
and Rubin 1985).
The negative effects of a sanction, such as school exclusion may be causally linked to negative outcomes
through one or more of the following processes. In line
with defiance theory (e.g., Sherman 1993) children who
are excluded may escalate their engagement in the negative behaviours that led to the exclusion if they a) perceive this sanction as unfair, b) have a poor school bond,
c) feel stigmatized by being excluded, and d) feel no, or
deny feeling, shame about being excluded. It is also possible that by being labelled as a ‘bad guy’, young people
identify themselves with this label and through the
process of self-fulfilling prophecy (Rosenthal and Jacobsen
1968) engage and escalate in behaviours that originally
lead to this label. Alternatively, in accordance with crime
opportunity theory (e.g., Cohen et al. 1980) by being excluded from school, an adaptive social environment,
young people may have more opportunities to spend
time in less adaptive social environments, which may in
turn offer increased opportunities to engage in antisocial activities. These are just a few plausible mechanisms linking school exclusion to negative outcomes.
However, as mentioned above very little is known about
this causal link or its mechanisms, thus warranting further
exploration.
What we know thus far is that young people who are excluded tend to be ‘hard to reach’, disruptive and in many
cases aggressive towards adults and/or other pupils, as the
statistics above attest. They often have communication
difficulties, which may compromise their ability to benefit
from the curriculum as well as behave in prosocial ways.
Further, children who have experienced exclusion sometimes carry with them the burden of difficulties their parents had with school, or come from home environments
that are far from conducive to educational attainment (or
more basically, have problems training young children
how to behave). Yet in spite of these issues, many thousands of children, who already have a constellation of risk
factors for a range of negative life outcomes, are (sometimes repeatedly) exposed to yet another risk factor by being excluded from school. The irony being that those
excluded may not like school in the first place, perhaps
partly as a result of finding school difficult due to their
educational needs. Indeed previous research has shown
that children view exclusions as akin to school sanctioned
holidays (Dupper et al. 2009). A risk is also that exclusion
Page 3 of 16
could weaken (perhaps already fragile) commitment to
school that some children have through removing the fear
of punishment. Furthermore, it is the most explicit form
of rejection by the educational system (Munn and Lloyd
2005).
In summary, pupils experiencing fixed-term exclusions
in the UK generally receive minimal support despite
exclusion being a risk factor for numerous negative life
outcomes. The goals of this study are two-fold; to assess
the efficacy of a new intervention targeted at those most
at risk for exclusion and to begin to elucidate some of the
processes through which school exclusion may be related
to adverse outcomes. The evaluated intervention aims to
develop the young peoples’ communication and broader
social skills in order to facilitate more adaptive interactions (prosocial behaviours) with others and eliminate
problem behaviours often linked to school exclusion.
Research Plan: impact evaluation
Research questions
This project has several research questions relating to
the different outcomes being assessed. Does the intervention affect the:
1. Behaviour of participants in terms of officially
recorded truancy, temporary and/or permanent
exclusions?
2. Self- or teacher-reported disruptive behaviour of
participants?
3. Educational attainment of participants in terms of
GCSE or other formal tests (e.g., SATs)?
4. Communication skills of participants in terms of
their expressive language, understanding, language
processing, and/or social communication skills?
5. Self-reported and officially recorded delinquent and/
or criminal behaviour of participants?
6. Likelihood of being Not in Education Employment
or Training (NEET) once the children complete
compulsory schooling?
Methods/Design
Sample/Participants
School identification and recruitment
In May 2013, all secondary schools in Inner London with
a free-school meal (FSM) rate equal to or greater than or
equal to 28% were invited to participate in the study
(n = 108)g. This list excluded specialist schools for physical, emotional or behavioural difficulties such as Pupil Referral Units or so-called ‘special’ schools. This list also
excluded schools (n = 40) that were already participating
in initiatives funded by the European Social Fund (ESF)
and the Greater London Authority (GLA) aimed at similar
groups of young people. Schools were ranked according
to the proportion of students with English as another
Obsuth et al. BMC Psychology 2014, 2:24
/>
language (EAL), special educational needs (SEN) and
the unauthorised absence rate (truancy). We initially
approached schools via letter, detailing the study and invitation to participate in the study, following up via
email and telephone. Interested schools were invited to
send back to us an Expression of Interest (EOI) document, which was followed up via telephone. Initial progress with recruitment was slow. To ensure that enough
schools/pupils are recruited to ensure minimum statistical power (see section below), a second phase of
school recruitment took place in a small number of
Outer London boroughs on the basis of (1) the school
having a FSM prevalence > =28% (2) the number of
schools in a given borough; and (3) physical proximity
to schools already in the study. Interested schools were
invited to an Information Event, during which the study
was further explained to them. At the end of recruitment 29 of the 36 schools included in the study were
present at the initial Information Event.
Pupil identification and recruitment
The target groups were Year 9 and 10 pupils at high risk
for fixed-term exclusion (‘suspension’) from school during the 2013/14 academic year in select schools in
Greater London. The planned intervention is intended
for children in the top 3-5% of a school’s Year 9/10 populations in terms of problematic behaviour. Within each
school, 16–24 young people (based on school size) at
the highest risk for fixed term exclusion in Years 9 and
10 were selected for participation (8–12 in each year) by
the schools. The planned sample size for the study was
350–400 participants in each arm of the trial with a projected total of 750–800 young people. Prior to randomisation, schools were asked to identify between 10–12
pupils per year who are at greatest risk for exclusion,
with a view to having groups of a maximum of 12 per
school/intervention.
The guidelines asked schools to select the young
people who are at high risk for school exclusion and/or
becoming NEET based on a) having had previous school
exclusions, b) unauthorized absences, and c) having engaged in behaviours that lead to other disciplinary measures previously being used.
Setting
The study is conducted in each of the participating
schools located throughout the following London
boroughs: Hammersmith and Fulham (5 schools), Ealing
(5 schools), Newham (4 schools), Haringey (3 schools),
Tower Hamlets (2 Schools), Barking and Dagenham
(3 schools), Kensington and Chelsea (3 schools),
Southwark (2 schools), Camden (3 schools), Islington
(1 schools), Westminster (2 schools), Waltham Forest
(1 school), Wandsworth (1 school) and Lambeth
Page 4 of 16
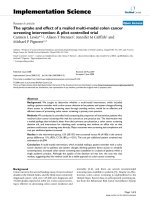
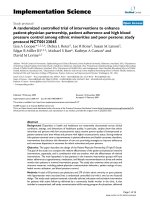
(1 school) (see Figure 1 CONSORT flowchart – school
recruitment and randomisation).
The intervention
The intervention was selected through a bidding process
organised by the Education Endowment Foundation
(EEF),h the funding body for the intervention component of the current project. Following a call for proposals from organisations that had an evidence-based
approach to working with 14–16 year old pupils at risk
of exclusion in London, the EEF received 20 applications. The EEF shortlisted five applicants in line with
their mission statement,i evidence of impact, scalability
and willingness to be evaluated as part of an RCT. Of
the shortlisted interventions, the evaluation team
selected the Engage in Education London (EiEL)
programme (described below), which provided the clearest description of aims, most convincing mechanisms of
change and promising findings from a preliminary evaluation Catch22 (Catch22 2013a).
The selected intervention is a 12-week-long programme
targeting young people’s communication and broader social skills. It consists of weekly group and one-to-one sessions. The intervention is delivered by Catch22, a social
business providing services to people in difficult situations, in close collaboration with I CAN, the children’s
communication charity. Catch22 has a history of working
with troubled and vulnerable individuals, with the goal to
steer them clear of crime or substance abuse and toward
educational and employment attainment (Catch22 2013a).
EiEL is a shorter version of the Engage in Education (EiE)
programmej offered by Catch22 since 2011 throughout
the UK. The EiE programme underwent an initial evaluation by the Department for Education (Catch22 2013b).
In this pilot study researchers found promising effects in a
pre-post design with 1,693 participants. The findings suggested positive effects on a variety of outcomes including
school attendance, attainment, and problem behaviour.
For example, the report suggested that fixed period exclusions had decreased by 21% following EiE (Catch22
2013a). While the lack of a control group limited the
extent to which causal inference could be drawn, the
positive changes across a range of outcomes were deemed
encouraging.
EiEL was adapted specifically for this group of young
people by Catch22 and I CAN, who were involved in the
development of the original intervention. The current
programme was adapted to be specifically delivered to
schools/academies within the LEIP project, with the goal
to increase the attendance and attainment of pupils most
at risk of fixed-term or permanent exclusion. Following
the EiE initial evaluation, EiE staff was consulted when
developing the adaptation for the London Education
and Inclusion Project (LEIP). The EiEL programme
Obsuth et al. BMC Psychology 2014, 2:24
/>
Page 5 of 16
Figure 1 CONSORT flowchart – school recruitment and randomisation.
continues with the EiE intervention approach of each
young person attending a weekly group and one-to-one
session but the resources have been adapted to fit a
shorter 12-week delivery period. The 12-week scheme
of work was developed based on a review and identification of activities/strategies, which were found most effective in the initial evaluation.
The intervention targets a number of individual risk factors including: students’ communication skills (e.g., ineffective strategies to solve problems, difficulties retelling events,
poor conversation skills, difficulties sharing emotions, and
understanding the link between cause and effect); hidden
communication needs (e.g., receptive-expressive language
difficulties); behavioural problems in school (e.g., disruptive
behaviour in the classrooms, violence); academic problems,
poor attainment and attendance below the expected level.
At the family level, the intervention targets risk factors such
as poor family support for academic activities whereas at
the school level, the intervention is focused on risk factors
such as poor classroom management (Ellis 2013).
One of the basic assumptions grounding the intervention is that communication difficulties play a role in behavioural problems at school. Put another way, children
who are unable to understand instructions, negotiate in an
assertive manner or require further explanations, and may
display maladaptive behaviours such as, social withdrawal,
somatic complains or aggressive behaviours (see Carr and
Durand 1985; Clegg et al. 2009; Van Daal et al. 2007). In
addition, the intervention builds on the assumption that
the social environment plays an important role in young
Obsuth et al. BMC Psychology 2014, 2:24
/>
people’s development. Catch22 contend that positive
change is achievable when family members, teachers,
and other members of the school environment are engaged in and supportive of the development of the
young people’s new skills. For this reason, the intervention seeks to involve these actors, as well as mentors
from the community who provide positive role models.
In fact, evidence demonstrates that a strong attachment
with a caring adult may help build resilience by building
‘competence, confidence, character, connection and caring’ (Lerner et al. 2005; p. 13). In line with the original
Engage in Education programme goals, the intervention
aims to develop the students’ awareness of a range of
adaptive communication skills and emotions and support their skills in interacting positively with others, in
order to facilitate their engagement in more prosocial
behaviours and less antisocial behaviour.
Programme delivery The intervention is delivered in
three main components: group work sessions, one-to-one
meetings and family support.
Group work consists of a set of 12 semi-structured
one-hour long sessions facilitated by a trained ‘core
worker’.l The sessions are delivered utilising participative
techniques (e.g., pair and group work activities and whole
group discussions) aimed at encouraging the students’ active involvement. The young people also agree to follow
rules set by the group during discussions. Each session is
structured around specific goals, which are outlined at the
beginning of each session. Session content and the resources required for delivering each session (e.g., scheme
of work, session plans, session worksheets) are described
in a guidebook available to each core worker at the time
of the training. Table 1 displays the curriculum and main
goals of each of the 12-sessions.
One-to-one work is designed to offer personalised
support to each youth as well as reinforce concepts and
skills learned during group sessions. The one-to-one
meetings take place on a weekly basis during the school
day, timetabled around the group sessions. The young
person is given a list of skills that they rank, using this
as a guideline they decide on up to three areas to work
on. Throughout this process the core worker can help to
prompt them to reflect on areas to focus on and also
help them with how to structure this into written goals.
The core worker will also structure their one-to-one activities/discussions around these target areas. These
goals are reviewed in one-to-one sessions at various
points throughout the intervention, new goals can be set
if previous ones have been met. Example target areas include: calming down in arguments, listening to teachers,
using positive body language. Thus, in the one-to-one
meetings, led by core workers, the curriculum covered
in the group sessions is adapted to each young persons’
Page 6 of 16
Table 1 Catch 22 intervention sessions
Sessions
Main contents
1. The skills I
start with
To learn effective communication skills.
Participants are invited to think about their
strengths and difficulties in regard to their
communication strategies with teachers and
peers.
2. Managing
difficult emotions
To learn effective anger management skills.
Participants are made aware of a range of
emotions, the triggers for some emotions and
some alternatives for managing them.
3. Understanding
conflicts
To learn strategies for self-calming and
de-escalating confrontations.
4. I have choices
To learn to appreciate the availability of
different alternatives in a range of situations,
to appreciate choices; their causes and effects.
5. Check it out
To learn to identify difficulties in
comprehension; being aware of confusion by
instructions; positive skills and attitudes to ask
for extra explanations (e.g., interrupting
appropriately).
6. Different talk
To learn to adjust the way of talking
for different people depending on one’s conversation partner and
location. Develop an understanding of the
difference between formal and informal
communication exchanges.
7. Looking back
looking forward
Evaluate personal performance and setting
goals for the second part of the course.
8. Co-operating
with others
To learn assertive communication skills
in-group situations. Discussing with others in
small groups, accepting others’ opinion,
changing personal opinions.
9. Aggressive,
Assertive, Passive
To learn to understand and be aware of
different styles of communication (aggressive,
assertive, passive) and develop skills for
adaptive, assertive interchange.
10. Communication
without talk
To learn to understand body language and
non-verbal signals. To be aware of potential
biases based on non-verbal signs/stereotypes
(dress, ethnicity, posture, etc.).
11. I can change
my world
To learn to identify and acknowledge personal
difficulties with classroom behaviour and
identify strategies to improve.
12. Summing up
Final session summarizing the learning
process, relevance of communication skills,
personal achievements and personal
challenges.
specific needs. This individual level approach ensures that
there is a degree of autonomy for each core worker to
tailor their delivery for each participant and source the appropriate support, whether academic, pastoral or familial.
Finally, when appropriate and necessary family support
is offered. Core workers make home-visits, offering support in transferring families to suitable community services.
The intervention intends to engage families in the task of
supporting children to remain (or re-engage) in school
and to improve their behaviours.
Obsuth et al. BMC Psychology 2014, 2:24
/>
Core worker training The recruitment of core workers
is an essential aspect of the intervention as its success is
largely dependant on their relationship building abilities
and delivery of the intervention. In August 2013, 11 core
workers were recruited based on several criteria, in particular their previous experience of working with young
people and schools, ability to understand the challenges of
engaging positively with young people who have complex
needs, as well as experience of assessing and formulating
support plans for young people’s achievement of learning
outcomes. In September 2013, all core workers attended a
four-week-long training and induction programme run by
Catch22. This intervention training programme familiarised core workers with the organisation and its policies
and procedures and equipped them with the relevant
knowledge and practical skills to effectively deliver the 12week intervention programme as well as to manage a
caseload of young people though the one-to-one individual work.
During the staff training core workers were introduced
to the delivery model and resources through presentations
and workshops delivered by the service manager and I
CAN Communication Advisors. Communication difficulties in young people with behaviour difficulties often go
unrecognised (Gilmour et al. 2004; Ripley and Yuill 2005)
and so an understanding of communication difficulties,
how to identify and support them is crucial. Core workers
were given a guidebook and resource pack that included
the 12-week delivery model plan and scheme of work, a
chart of the programme staffing structure and an example
of the group and 1:1 session ‘planning & evaluation’ template. During the training month core workers take part in
a variety of training activities, including an introduction to
communication awareness training, behaviour management training, as well as instruction and practical experiences in using the intervention resources. For example,
core workers are asked, in pairs, to review the group session delivery resources before deciding upon and planning
a selected activity to run with the rest of the group. The
core workers then role-play and run their activity with the
other participating trainees. The group is then encouraged
to provide feedback to each pair relating to their delivery
style, use of resources or any other relevant observations.
I CAN ‘Behaviour Talks’ Workforce Development
programme for schools
An additional component of the intervention is delivered by a partnering agency called I CAN. I CAN delivers a programme called “Behaviour Talks” to
participating schools. Intervention schools are offered
the I CAN Behaviour Talks workforce development
programme. Behaviour Talks is a clear step-by-step
programme of ‘Communication Focused’ activities and
resources. It gives school staff the tools and confidence
Page 7 of 16
to identify and support the communication needs of
young people with behaviour difficulties.
Control Group ‘Light Intervention’
Schools in the control group are offered a one-off workshop delivered by trained corporate volunteers. These
workshop sessions address employability skills of young
people, provide insight into the world of work and facilitate discussions concerning employment.
Design
The trial is conducted and it will be reported in accordance with the requirements of the Consolidated Standards
of Reporting Trials (CONSORT) Statement (Campbell
et al. 2012).
Type of trial
The study design is a cluster-randomised controlled trial
with randomisation at the school level. The sample consists of 36 schools, which are randomly allocated into
one of two intervention conditions. Originally, we
planned to complete baseline data collection in the
month of September and randomise all schools at the
end of September. Based on this plan all schools were
going to be engaged with the intervention (‘Intensive’ or
‘Light’) for the duration of the entire academic year
2013/2014. The intervention was going to be delivered
to Year 9 (50% of the schools) or Year 10 (50% of
schools) students in each of the schools in Autumn 2013
and to the complementary Year group in each school in
Winter/Spring 2014.
However, due to scheduling difficulties on the part of
the schools, by the end of September we were only able
to collect baseline information from 20 schools. As a result and following consultation with Catch22, EEF and
GLA, the treatment delivery plan was revised and the
schools were divided into two groups (Phases). Phase I
schools were randomised and received the intervention
in both Year groups in Autumn 2013 and Phase II
schools were randomised later and received the intervention in both Year groups in Winter/Spring 2014.
Please see Additional file 1: Table S1 for the data collection and intervention timeline for Phase I and II.
Twenty schools with available baseline data were randomised as planned at the end of September (constituting
Phase I). The remaining 16 schools (constituting Phase II)
were randomised on 15th of November. Please see
Figure 1 for the CONSORT flowchart (Campbell et al.
2012; Moher et al. 2010) reporting school recruitment and
randomisation.
The Phase I randomisation yielded 11 schools in the ‘Intensive’ intervention condition and 9 schools in the ‘Light’
intervention condition. Due to capacity limitations, the
intervention provider was unable to deliver the intervention
Obsuth et al. BMC Psychology 2014, 2:24
/>
to 11 schools (22 intervention groups) so one school was
approached and accepted the proposal to receive the ‘Intensive’ intervention in Winter/Spring 2014. Thus, although
20 and 16 schools, respectively were randomised for Phase
I and Phase II; 19 and 18 schools received the intervention
corresponding to the Phase relevant intervention timeline.
Randomisation method
Randomisation was carried out through the process of
‘minimisation’ (Tavers 1974; Pocock and Simon 1975;
Freedman and White 1976). This process was selected as
it offers several advantages over pure random allocation,
in particular that small-sample variation can lead to very
imbalanced trials, some have even argued it is the ‘platinum standard’ for randomisation (Treasure and McRae
1998). The essence of the minimisation approach is that it
does not rely solely on chance – it aims to reduce (i.e.,
minimise) differences in determinants of the outcome so
that any remaining differences can be attributed to the
outcome (Treasure and McRae 1998). To overcome the
issue that pure minimisation is deterministic, the algorithms used also include a random component that reduces the chance of prediction – rather than favouring a
reduction in imbalance scores, preference is given to allocation to treatment (Saghaei and Saghaei 2011). Thus, the
minimisation algorithm is a flexible allocation method in
which the allocation of each subject (e.g., individual or
school) is influenced by the existing overall balance of allocated subjects (Saghaei and Saghaei 2011). One consequence of focusing on balance is that minimisation can
lead to unequal sample sizes in treatment allocation arms.
Minimisation takes a series of steps (Saghaei and
Saghaei 2011): (1) The first subject is allocated ‘truly
randomly’. (2) All following subjects are allocated hypothetically to both treatment and control groups and imbalance scores are calculated for each alternative. The
question asked is: to which group would allocation of
the next school make the two groups more balanced?
(Altman and Bland 2005). If it makes no difference (i.e.,
the scores are tied) then allocation is again truly random.
(3) Balance scores are compared for the alternative scenarios and the subject is allocated to the group that
results in the ‘least worst’ imbalance score, but with
‘treatment’ being the preferred allocation. (4) Subsequent allocations use existing information to then repeat
steps (2) and (3) until all subjects have been allocated.
These steps do not guarantee perfect balance, but they
do reduce the likelihood of imbalance versus simple randomisation. There are several software implementations
of minimisation (Altman and Bland 2005). Here we use
the open-source MinimPy software developed by Saghaei
and Saghaei (2011).
In a simple random allocation model we expect to see
that factors empirically or theoretically related to the
Page 8 of 16
outcome are ‘balanced’ between the arms of a trial. This
might be assessed, for example, by exploring whether the
proportion of males is roughly the same in each school.
This is not the same as assessing whether such differences
are statistically significant. There are several scores provided for assessing imbalance within MinimPy. We use the
mean marginal balance score, with lower scores achieving
greater balance. This can also be assessed by statistically
testing differences between schools once allocation has
been completed.m
Balancing schools
There are many variables that might be ‘important’ for
school exclusion. We balanced on those variables originally used to select schools and based on prior research on
factors strongly associated with the likelihood of exclusion: free school meal eligibility (FSM) and special educational need (SEN) derived from the 2012 school census
data by the Department for Education (2012). In addition,
as schools varied with respect to size and/or tailoring to
only one gender, we also considered these two factors in
the balancing of schools. Finally, we incorporated data
from the baseline teacher questionnaire relating to
assessed pupil behaviour (discussed below). Following the
example in Altman and Bland (2005) we set out how each
measure used in the minimisation process was created,
presenting summary statistics for each measure in Table 2.
Proportion of children on free school meals
To be considered for the study, schools had to have
> =28% of children currently eligible for free school
meals (FSM) based on Department for Education (2012)
data from the 2012 school census (Sutherland and Eisner
2014) meaning that the schools’ intake is a priori, made
up of children from poor backgrounds. The values of
FSM for those schools eventually included in the trial
ranged between 28-61%, with a median of 37%. We
created a variable that took two values, splitting at 37%.
Panel A of Table 2 shows the average proportion of FSM
eligible children for each group.
Special Education Needs
The proportion of children classified as having special
educational needs (SEN) ranged from 4.5-42.6%, with a
median value of 12.05%. Schools with less than 12.05%
were classified as ‘low SEN’ and those equal to or greater
than 12.05% as having ‘high SEN’. Panel B of Table 2
shows the distribution of these variables between the
schools and the mean proportion with special education
needs in both groups.
School gender
Department for Education data from the 2012 school
census stated that we had a mixture of eight single sex
Obsuth et al. BMC Psychology 2014, 2:24
/>
Page 9 of 16
Table 2 School variables used for minimisation
Teacher questionnaire data
Panel A. FSM group
Mean % FSM eligible
Freq.
0 < 37%
32
17
1 > =37%
45
19
Total
38.9
36
Panel B. SEN group
Mean % SEN
Freq.
0 < 12.05%
8.0
18
1 > =12.05%
19.3
18
Total
13.7
36
Panel C. School gender
% of schools
Freq.
Mixed sex
72
26
To ensure balance on factors directly relating to exclusion,
we also incorporated data from the baseline teacher questionnaire data. Section 1 of the questionnaire (see Table 3)
consisted of 15 questions relating to pupil behaviour, both
positive and negative. In order to incorporate this information, we use principle component analysis to reduce
the dimensionality of the data. This resulted in questions
clustering around two dimensions, what we termed ‘AntiSocial Behaviour’ (ASB) and ‘Pro-Social Behaviour’ (PSB).
This information was then aggregated to the school level
and split at the mean. Only the ‘Anti-Social Behaviour’
score was used in minimisation. Panel E of Table 2 shows
the number of schools designated as ‘high’ and ‘low’ ASB.
Single sex
28
10
Total
100
36
Panel D. Year 9/10 Cohort sizes
Mean n pupils
Freq.
Sample size calculations
Small <250
747
8
Medium 250-400
900
13
Large >400
1246
15
Total
1010
36
Panel E. Teacher questionnaire
Mean PCA score
Freq.
0 < Mean ASB
-.760
17
1 > Mean ASB
.741
19
Total
-.045
36
In an experiment (e.g., RCT) we are asking whether two
groups are the same (Null Hypothesis – H0) or different
(Alternative Hypothesis – HA). “Power” is the probability
of detecting a difference (e.g., due to the effect of a treatment) between groups, if it exists. Therefore, when designing an experiment, our goal is to make sure that we
have a large enough sample size to ensure a high probability to be able to detect differences. This typically
means having a large enough sample, however; other
factors also influence power: sample size, effect size, significance level, and the statistical test used (Cohen 1988;
Hedges and Rhoads, 2010) set out some additional factors that influence power in complex designs such as
cluster-randomised trials. In brief, these are: (i) the number of clusters – when there is statistical dependence
among scores within a cluster (e.g., pupils in classrooms
or schools), power is no longer purely a function of how
many individuals there are in a trial, but is much more
strongly affected by the number of clusters, which is always a smaller number. This reduced sample size in turn
affects statistical power (as above). (ii) Intra-class correlation (ICC). The ICC is the proportion of the variance
of the dependent variable that occurs between clusters. If
the differences in the data are not due to the differences
between the clusters, then the ICC will be 0 and the effective sample size for the study will be all the individuals who participated in the study. If, however, all of the
differences are due to differences between clusters then
the ICC will be 1 and the effective sample size will be
the number of clusters. In reality, the ICC will be somewhere between 0 and 1, therefore, the effective sample
will be somewhere between the number of individuals
and clusters. (iii) Baseline adjustment. Assessment of the
dependent variables (i.e., outcome variables) at baseline
as well as following treatment allows controlling for the
baseline levels of each outcome and thus increases the
operative sample size (the essence of this is that it reduces the ‘noise’ between the groups and thus makes it
schools (three all-boys, five all-girls) and thirty mixed sex
schools. However, upon closer inspection, via examining
the proportion of male pupils in each school, some
schools listed as ‘mixed sex’ in Department for Education
data were in fact all male. The median value for percent
male was 56%, but the range for supposed mixed sex
schools, was between 45-101% with 101% being a school
that was above capacity and with an all-male intake.
‘Mixed sex’ schools that consisted of all-male pupils were
classified as ‘single sex’ for the purposes of randomisation.n
This resulted in ten schools classified as ‘single sex’. Panel C
of Table 2 reports the number of schools classified as
‘mixed’ or ‘single sex’.
School size (total number of pupils enrolled)
Schools were split into three groups (small, medium and
large) based upon information returned by schools on
the current size of their Year 9 and 10 cohorts. This
partly determined how many pupils the research team
requested were put forward for the intervention. Schools
were classified into ‘small’ (less than 250 pupils),
‘medium’ (250–400) or ‘large’ (more than 400) based on
the number of pupil enrolled in each year groups. Of the
36 schools 8 (22%) are small, 13 (36%) are medium and
15 (42%) are large. Panel D of Table 2 displays the average number of pupils in the school for each of these
groups.
Obsuth et al. BMC Psychology 2014, 2:24
/>
Page 10 of 16
Table 3 Teacher questionnaire - anti-social behaviour items
For the following questions, please indicate how often in the past YEAR this young person has…
Never
Rarely
Sometimes
About once About once Almost every
(1 to 2 times) (3 to 10 times)
a month
a week
day
… Physically attacked another young person.
□
□
□
□
□
□
… Verbally abused/ threatened another young person.
□
□
□
□
□
□
… Physically attacked an adult/s.
□
□
□
□
□
□
… Verbally abused/ threatened an adult/s.
□
□
□
□
□
□
… Abused others because of their race.
□
□
□
□
□
□
… Deliberately disrupted teaching.
□
□
□
□
□
□
… Engaged in sexually inappropriate behaviours.
□
□
□
□
□
□
… Used drugs and/or alcohol.
□
□
□
□
□
□
… Damaged the school's or somebody else's property at school.
□
□
□
□
□
□
… Was rude and belligerent toward me.
□
□
□
□
□
□
… Stole something at school.
□
□
□
□
□
□
easier to detect differences). In order to maximize power
based on baseline adjustment we need to utilize measures with acceptable test-retest reliability.
the research team and teachers were blind to whether their
school is in the treatment or control condition we achieved
a double blind design for baseline data collection.
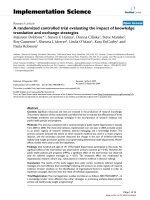
Minimum detectable effect size
Ethics statement
Ethics/code of conduct
Logistical restrictions on the maximum number of
schools and pupils within schools that could receive the
intensive intervention mean that instead of calculating
an optimum sample size to detect a desired effect size,
we are instead calculated the minimum detectable effect
size (MDES). Bloom (1995; cited in Spybrook et al. 2011;
p. 7) ‘defines the MDES as the smallest true effect that
can be detected for a specified level of power and significance level for any given sample size’. At the outset of
study design, we used the Optimal Design software
(Raudenbush et al. 2011) with 40 schools (J); 20 pupils
(n) within each school; a desired power of .80; an alpha
of .05; an assumed ICC of 10%; assuming no correlation
between baseline and post-intervention data; and no
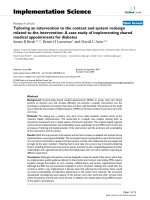
level two measures.o Using these parameters the (conservative) estimate of MDES is d = .35, which is in the
‘small’ to ‘medium’ range (Cohen 1988) see Figure 2.
With the addition of baseline and school level covariates
the MDES will reduce accordingly as power increases.p
Blinding
Screening data and baseline teacher reports were collected
in July 2013 prior to the end of the 2012/2013 academic
year to ensure that the teachers had sufficient exposure to
and experience with the pupils to reliably report on their
behaviour. Some schools (n = 6) returned data after the
new school year had started but before randomisation. One
school failed to submit any teacher questionnaires, hence
was randomly allocated a score for minimisation. As both
The project and the consent procedure described below
were approved by the Institute of Criminology Ethics
Review Committee on 20 May 2013 (approval letter
available upon request). All data for the project will be
held in compliance with the 1998 Data Protection Act.
All schools involved in the study signed data sharing
agreements with the University (example data sharing
agreement available upon request).
Teacher consent
Teachers were asked to complete an informed consent
form when filling out the online and paper versions of
the study questionnaire.
Parental consent
Following identification of the (average of ) 20 young
people per school, consent was sought from parents.
After much deliberation with colleagues within the University, as well as consultation with teachers, local
council education officers, the intervention provider
(Catch22) and the Educational Endowment Foundation,
we decided that a parental ‘opt-out’ approach would
best fit the study design, the target group of (high risk)
young people and is in keeping with how schools routinely approach the provision of additional support.
These letters were prepared by the research team but
amended/sent by the schools themselves and signed by
the Headteacher or other school representative. Parents
Obsuth et al. BMC Psychology 2014, 2:24
/>
Page 11 of 16
Figure 2 Minimum detectable effect size (MDES) for LEIP.
were given one week to advise the research team by contacting the school (either by post or phone) and indicating
that they wish to opt out of the study. Of the approximately
800 letters sent to parents, 15 parents/guardians indicated
that they wished to opt their child out of the study.
Young person assent
Prior to completing any questionnaires, participants were
presented with an Information Sheet/Assent Form. Fieldworkers read out the study information portion of the
assent form to the group and make sure that each young
person understood what was being asked of them. As we
plan to follow up participants beyond the life of the study
and link their data to government records, they were asked
to tick separate boxes to consent to linking self-reported
data to official records from the Ministry of Justice and
Department for Work and Pensions. We reiterated that we
would not share any of this information with the school,
their parents, the police or anyone else, that their responses
to the questionnaires are confidential, and that all of their
information will be anonymised. Once this was completed
and the young people had the opportunity (or been
prompted) to ask questions, they were asked to confirm
their willingness to participate by signing the forms. When
parental consent and young person assent were opposed
then parental consent was considered.
Fieldwork data collection procedures
Staffing For the baseline data collection, 15 fieldworkers
(FW) were recruited from University College London
(UCL; n = 14) and the London School of Economics (LSE;
n = 1). Following a thorough selection procedure all FWs
attended a two-day training course on administration of the
questionnaires as well as conduct with the young people,
led by the research team.
For the post-intervention data collection three of the
original FWs who were still available were invited back to
participate in the collection of the post-intervention data.
As the post-intervention data collection overlapped with
the exam period at UCL, we widened the recruitment net
to include other Universities (Departments of Psychology
and other social science fields) throughout London. Fifteen
new FWs were recruited from Royal Holloway University
(n = 2), University of Roehampton (n = 4), Kingston
University (n = 5), Goldsmiths University (n = 3) and one
visiting student from Deakin University in Australia. Based
on feedback from FWs following the baseline data collection the training and all training material was delivered in a
Obsuth et al. BMC Psychology 2014, 2:24
/>
one-day training session. All FWs were provided with a
handbook containing details of the study and procedures to
follow in the field. Regular contact is maintained with FW
staff by the central research team to provide support as well
as monitor and facilitate the data collection process.
Data Collection Timeline Baseline data was collected
from teachers and the young people prior to randomisation
of all schools as specified below. The post-intervention data
collection from both teachers and young people is currently
(March – May, 2014) ongoing for Phase I schools and is
planned to be completed in June – July for Phase II schools.
The post-intervention data collection is being completed in
two stages to follow approximately one month after the
completion of the intervention in the intervention groups
in each Phase. Both teachers and young people are asked to
report about the young people’s behaviours and experiences
from the previous month (see Additional file 1: Table S1 Timeline).
Teacher questionnaires Teachers completed an online
or paper and pencil version of an assessment with respect
to potential participants. Baseline teacher reports were collected in June/July 2013 for the majority of schools (n = 30).
For a few ‘hard to reach’ schools and those coming later
into the study, teacher questionnaires were returned in
September 2013. Schools were asked that the form tutors
or the teacher who knew the children best should complete
the questionnaire. This was to increase the probability that
the teachers being asked have sufficient knowledge of the
young people participating in the study. In all schools, this
assessment was collected prior to randomisation. The
teacher questionnaire asks about the young person’s behaviour problems, prosocial behaviours and likely reactions to
punishment disciplinary actions that had been taken against
that child, as well as the quality of the teacher-student relationship. Any teacher baseline data relating to young people
who will not be included in the study (i.e., any reserve
young people) will not be kept beyond the lifetime of the
study. Form tutors (note that these may be different
teachers than at baseline) will be approached to provide the
same information about the young people.
Young people Baseline measurements were carried out in
groups of 10–20 young people, overseen by two to four
trained FWs, with a maximum of five young people per
FW. Both at baseline and at post-intervention data collection, the young people complete a questionnaires as well as
a computerized educational abilities measure. FWs were
instructed to first explain the study to the young people
and ensure that they understand it, administer the young
person assent form (at baseline) and then proceed with the
administration of the paper and pencil and online questionnaires. Whenever possible both assessments are carried out
Page 12 of 16
on the same day and young people not present during the
initial group-based baseline data collection are followed up
by pairs of FWs individually.
Young person questionnaire The young people complete
a paper and pencil questionnaire, consisting of 144 questions rated (mainly) on Likert Scales tapping the young
people’s behaviours, emotions, relationships with peers and
teachers, as well as communication skills. The duration of
the administration of the questionnaire is 30–40 minutes.
The questionnaire and procedure were first piloted in a
local comprehensive school on a sample of 19 young
people. It was then adjusted to account for the difficulties
to maintain the attention of groups of young people.
Scripted instructions, which were read out by the FWs to
the group of young people, were also added.
Educational abilities measure The young people also
complete a computer-administered measure developed by
the Centre for Evaluation and Monitoring at Durham
University.q This measure provides a standardised, adaptive,
curriculum free assessment of the young people’s maths and
verbal abilities. The duration of administration is up to one
hour.
Outcome measures
Outcomes are designed to reflect the main domains
targeted by the intervention. A multi-informant approach is
adopted whereby data will be collected from official
records, teachers and the study participants. We anticipate
that the planned intervention will have positive effect on
five interrelated primary outcomes:
1. Improve communication skills as the main proximal
mechanism targeted by the intervention.
2. Reduce behavioural problems, including the likelihood
of school exclusions up to the end of compulsory
schooling.
3. Improve academic outcomes, in particular the number
of GCSEs being sat and GCSE exam results.
4. Reduce the risk of becoming NEET in the years after
compulsory schooling.
5. Reduce the risk of arrests and criminal convictions
during and after compulsory schooling.
In addition, given the emphasis placed by the intervention programme on communication skills, we expect these
to improve regardless of other outcomes. Table 4 gives a list
of the outcomes and measures. We plan to follow up
participants for at least two years after the intervention via
administrative records in various government agencies
(e.g., Ministry of Justice; Department for Education;
Department for Work and Pensions), but this falls outside
of the remit of this trial.
Obsuth et al. BMC Psychology 2014, 2:24
/>
Table 4 Outcomes and source
Source
A) Academic outcomes
Academic Attainment Test, Verbal
and Maths
Online academic tests
administered in schools
Academic Achievements
School records
Attendance
School records & teacher assessments
B) Interpersonal skills
Student communication skills
Self-Report
Student communication skills
Teacher assessment
Student prosocial skills
Self-Report
Student prosocial skills
Teacher assessment
Student-teacher relationship
Self-report
Student-teacher relationship
Self-report
C) Behaviour problems
School exclusions
School records
Bullying perpetration
Self-report
Delinquency
Self-report
Antisocial behaviour
Self-report
Antisocial behaviour
Teacher assessment
Page 13 of 16
Clustering
To take into account the clustering of the subjects within
schools we will use models that assume correlated errors
within each cluster such as multilevel models, or models
with cluster-robust standard errors.
Missing values
Missing values due to attrition or non-response will be
imputed. The imputation strategy will depend on the extent
of missingness (e.g., what proportion of our data matrix is
missing) and the missingness mechanism.
Outcome assessment
Initial analyses of all outcomes will be conducted on an
intention-to-treat (ITT) basis, i.e., all participants allocated
to the treatment and control conditions will be included.
We are planning a covariate-controlled assessment of
differences in each outcome at baseline. Analyses will be
conducted on all outcomes listed in Table 4. We will
conduct two-tailed hypothesis tests against the standard 5%
alpha level, applying family-wise error correction where
necessary (e.g., Bonferroni). As noted above, clustering will
be taken into account via multilevel models or by using
cluster-robust standard errors.
Sub-group analyses
Analysis plan
To reduce or minimise threats to internal validity, selection
bias and post-randomisation biases (Shadish et al. 2002) the
trial was designed, is conducted and will be reported according to CONSORT standards (Campbell et al. 2012). These
consist of a ‘quality assurance’ checklist for such studies.
Baseline equivalence
In a first step t-tests (or equivalent for proportions) will be
calculated to examine differences in all baseline measures,
socio-demographic measures and mediators between the
control and the treatment group. Test of equivalence at
baseline will take into consideration the clustering of the
data. The hypothesis is that if the randomisation was
successful the outcomes will not differ at baseline.
Attrition and missing values
A CONSORT diagram will document the loss of participants between the baseline and post-intervention assessments. We expect to keep attrition to approximately 15%
of the baselined sample. Ideally, we would have oversampled by 15% to increase the sample size required to
account for attrition. However, this proved difficult for two
reasons: a) schools reported not having any more young
people who would meet criteria and b) the intervention
provider was only able to accommodate a maximum of 12
young people per intervention group and a maximum of 20
intervention groups per phase.
Subsequent to the main ITT analyses we are planning a
number of subgroup analyses:
– Exposure to treatment: Data will be collected on
whether and what proportion of the planned
intervention was received by each young person. We
expect a dose-response relationship in that children
who more fully participated in the intervention show
more change in the expected direction. To test this
hypothesis we will carry out a subgroup analysis by
levels of exposure to treatment.
– Implementation: Data will be collected on the
implementation process. We will analyse whether
higher implementation quality is associated with
better treatment effects.
– Engagement with school: Baseline measures will be
taken on the children’s engagement with the school
and the teacher. We hypothesize that children who
are more engaged with the school and the teacher
will show greater improvements than children who
are less engaged.
– Initial behaviour: Research suggests that higher
levels of initial problem behaviour are often
associated with better effects. We will examine
intervention effects by baseline level of behaviour
and communication problems.
– Year group and sex: We will also examine whether
the intervention had different effects by year group
Obsuth et al. BMC Psychology 2014, 2:24
/>
and sex, although we do not have theory-led hypotheses about sex and age-specific differences in
the effects of the intervention.
Furthermore, we plan analyses of mediating mechanisms. More specifically, we will examine whether improvements in communication and social skills mediate
effects on more distal behaviour and academic outcomes.
Process evaluation methods
In recent years researchers and policy makers have argued
that in addition to answering the question of “Does an
intervention work?” in randomised treatment trials it essential to also carry out process evaluation to answer questions
such as “What works?”, “Why does it work/does not work?”
(Oakley 2006) and “What works for whom?” (Pawson and
Tilley 2004). Process evaluations focus on documenting
and evaluating the implementation of the intervention, dosage of each component, adherence to treatment, treatment
delivery, contextual factors that may influence the intervention and possible subgroup effects (Wight and Obasi 2002).
Each of these components may influence as well as help in
the interpretation of the outcome results (Durlak and
DuPre 2008). According to Oakley (2006) process evaluations are particularly important in multi-site trials, in which
the same intervention may be delivered in more or less
different ways across the different sites, which may lead to
systematic differences. Therefore, in the current evaluation,
Catch22 will provide regular data on the programme delivery relating to: planned interventions, compliance with the
intervention (e.g., attendance, dropout, disruption), any
problems with maintaining fidelity, any deviations from
what was planned with documented explanations and
completion. We have also carried out semi-structured
interviews with the Catch22 core workers providing the
Intensive intervention to find out more about their experiences with their training and implementation of the EiE
London programme. This information will be utilized to
evaluate the above listed processes identified as key in
process evaluation and will be also be used in relevant subgroup analyses.
Trial status
The trial is in the initial stages of post-intervention data
collection.
Discussion
The UK has perhaps one of the highest rates of schoolexclusions. Already in 1998 the (UK Social Exclusion Unit)
concluded that the school exclusion levels have reached a
‘crisis point’. They suggested that “The thousands of children
not in school on most school days have become a significant
cause of crime. Many of today’s non-attenders are in danger of becoming tomorrow’s criminals and unemployed”
Page 14 of 16
(Macrae et al. 2003; p. 91). Compared to other countries,
for example in Switzerland where school-exclusions are
utilized as a ‘treatment’ strategy, in the UK schoolexclusions are utilized largely as one of the more extreme
types of disciplinary measures (Parsons 2005). Despite recent evidence from other countries suggesting that
school-exclusions are not only non-effective in achieving
behavioural and/or educational improvements in young
people, but may in fact be harmful (Gazeley 2010; Osler
and Vincent 2003), they continue to be widely used in
schools throughout the UK.
The current study builds on preliminary evidence on
the effectiveness of the Catch22 intervention carried out
by the Department for Education in 2011/13 (Catch22
2013b). It is a large-scale field trial, which aims to provide and solidify the evidence of the effectiveness (with
respect to both behavioural and educational outcomes)
of this intervention specifically targeting difficult to engage young people at the highest risk for school exclusion. It also aims to gather a wide range of information
about this high-risk group of young people, which will
allow for the better understanding of their experiences
at and outside of school. Based on this information, the
study also aims to elucidate some of the processes which
may link school exclusions to later adverse behavioural
and/or educational outcomes.
Furthermore, in addition to the assessment of shortterm effects, long-term follow-up of these young people
based on official records will enable the evaluation of
the long-term effects of the intervention on their employment as well as possible engagement in antisocial/
criminal behaviours.
The study has further strengths in that, to our knowledge,
it is the first cluster-randomised controlled trial of a preventive intervention for a very specific group of young
people at the highest risk for school exclusion in the UK. It
is also an independent evaluation, in which the programme
is implemented and evaluated by two separate teams
funded by two different funding sources. Moreover, the
study has high external validity as, amongst others, it
models a recruitment process parallel to the one generally
utilised by the Catch22 intervention. As a result, the findings from this study will be generalizable to a wide population of young people at high-risk for school exclusion to
who may benefit from this intervention.
Endnotes
These are also known as fixed term exclusion or ‘suspension’; all three terms are used interchangeably throughout.
b
Other legislation relevant to school exclusion is given
here: />c
Boys are around three times more likely to receive a
permanent or fixed period exclusion than girls (similar to
a
Obsuth et al. BMC Psychology 2014, 2:24
/>
the previous year). More starkly pupils eligible for free
school meals are four times more likely to receive a permanent exclusion than those not eligible and the fixed
period exclusion rate for these children is around three
times higher than the rate for those not eligible (Department for Education 2012).
d
Physically assaulting a pupil or an adult (20.5%), ‘persistent disruptive behaviour’ (24.1%), verbal abuse or
threatening behaviour towards an adult or pupil (25.5%)
(Department for Education).
e
AKA ‘school climate’ in the US, see e.g.: http://www.
schoolclimate.org/climate/.
f
Specifically, being NEET (Not in Education, Employment or training).
g
This cut-point of 28% was determined by the EEF on
the basis of it representing above average levels of
deprivation within London.
h
i
The EEF’s aim is to narrow the gap in attainment for
pupils from disadvantaged backgrounds.
j
/>l
Core workers are full-time staff responsible for the management of a caseload of young people deemed “at risk of
exclusion”. Their role is to a) assess those young people
and develop an agreed action plan of bespoke interventions
that meets their needs, review this regularly and feedback
to stakeholders as required; b) to work with colleagues in
the delivery of small group activities and workshops for
young people and the wider community throughout the
lifecycle of the project; c) to conduct all necessary administration and evaluation duties and to work in line with
Catch22 policies at all times.
m
Ideally, we would include balancing variables as covariates in later analyses because these capture the selection process.
n
The two schools were one secondary school and an
‘all boys’ school. It may seem obvious that an all-male
school could only have male pupils, but it might be that
the school has a mixed sex sixth form. Equally, the DfE
classification could have been incorrect.
o
Meaning that both the test-retest correlation and
school level variance explained were assumed to be zero.
p
With J = 35 and the same parameters as above, MDES
is d = .38; with J = 30, MDES is d = .40.
q
Additional file
Additional file 1: Table S1. Project Timeline – intervention and data
collection.
Competing interests
As this trial is an independent evaluation, the Intervention Team and the
Evaluation Team consist of different groups of people funded by different
external funding sources. Rosanna Hall is part of the Intervention Team
Page 15 of 16
(funded by the Education Endowment Foundation), in her role she oversees
all aspects of the delivery of the intervention but had no role in the design
of the evaluation. The remaining authors are all part of the Evaluation Team
(funded by the European Commission and Greater London Authority).
As such these authors declare that they have no competing financial or
non-financial interests.
Authors’ contributions
IO participated in the design of the study, organization and supervision of
data collection and training, preparation of this manuscript. AS helped
secure funding for the project, participated in the design of the study,
organization and supervision of data collection and training, preparation of
this manuscript. SV participated in collecting information to describe the
intervention section of this protocol/manuscript. SS participated in collecting
information for key aspects of this manuscript and contributed to first drafts
of some parts. LN participated in collecting information for key aspects of
this manuscript and contributed to first drafts of some parts. RH participated
in the development, implementation and description of the intervention. ME
secured the funding for the project, participated in the design of the study
as well implementation of the study; has been involved in revising this
manuscript for important intellectual content. All authors read and approved
the final manuscript.
Acknowledgements
We thank the European Commission, which via a Social Experimentation
Grant (EC reference VS/2012/0345) provided funding to the Greater London
Authority for this specific project in collaboration with Professor Manuel
Eisner, University of Cambridge. The information contained in this
publication does not necessarily reflect the position or opinion of the
European Commission. We also thank the Education Endowment
Foundation, which provided funding for the implementation of the Engage
in Education – London programme, the target intervention of this trial.
Author details
1
Institute of Criminology, University of Cambridge, Sidgwick Avenue,
Cambridge CB3 9DA, UK. 2Catch22, Unit 4, First Floor, 1-3 Stratford Office
Village, 14/30 Romford Road, Stratford, London E15 4EA, UK.
Received: 3 July 2014 Accepted: 18 July 2014
Published: 15 August 2014
References
Altman, DG, & Bland, JM. (2005). Treatment allocation by minimisation. British
Medical Journal, 330(7495), 843.
Boxford, S. (2006). Schools and the Problem of Crime. Willan: Cullompton, Devon.
Campbell, MK, Piaggio, G, Elbourne, DR, & Altman, DG. (2012). Consort 2010
statement: extension to cluster randomised trials. British Medical Journal,
345, e566.
Carr, EG, & Durand, VM. (1985). Reducing behaviour problems through functional
communication training. Journal of Applied Behavior Analysis, 18(2), 111–126.
Catch22. (2013a). Transforming lives, transforming communities. [Retrieved from
/>Catch22. (2013b). Evaluation of Engage in Education, Department for Education.
[Retrieved from />Centre for Social Justice. (2011). No Excuses - a review of Educational Exclusion.
[Retrieved from />%20reports/CSJ_Educational_Exclusion.pdf]
Clegg, J, Stackhouse, J, Finch, K, Murphy, C, & Nicholls, S. (2009). Language
abilities of secondary age pupils at risk of school exclusion: A preliminary
report. Child Language Teaching and Therapy, 25(1), 123–140.
Cohen, J. (1988). Statistical power analysis for the social sciences (2nd edition). New
Jersey: Lawrence Erlbaum Associates.
Cohen, LE, Felson, M, & Land, KC. (1980). Property crime rates in the United
States: A macro dynamic analysis, 1947–1977; with ex ante forecasts for the
mid-1980s. The American Journal of Sociology, 86, 90–118.
Department for Education. (2012). Permanent and fixed-period exclusions from
schools in England: academic year 2010 to 2011. In London: Department for
Education [ />
Obsuth et al. BMC Psychology 2014, 2:24
/>
Department for Education. (2013a). Permanent and fixed period exclusions from
schools in England: 2011 to 2012 academic year. In London: Department for
Education [Retrieved from />permanent-and-fixed-period-exclusions-from-schools-in-england-2011-to2012-academic-year]
Department for Education. (2013b). School discipline and exclusions. In London:
Department for Education [ />permanent-and-fixed-period-exclusions-from-schools-in-england-2011-to2012-academic-year]
Department for Education. (2013b). Schools, uniform. In London: Department for
Education [Retrieved from />schools/Uniform/a005643/school-uniform]
Dupper, DR, Theriot, MT, & Craun, SW. (2009). Reducing Out-of-School
Suspensions: Practice Guidelines for School Social Workers. Children and
Schools, 31, 6–14.
Durlak, JA, & DuPre, EP. (2008). Implementation matters: a review of research on
the influence of implementation on program outcomes and the factors
affecting implementation. American Journal of Community Psychology,
41(3–4), 327–350.
Ellis, P. (2013). Final Evaluation of Engage in Education – A Department for
Education funded pilot programme delivered by Catch22 and partners
(2011–2013). [ />Engage-in-Education-Final-evaluation-Executive-summary-June-2013.pdf]
Freedman, LS, & White, SJ. (1976). On the use of Pocock and Simon’s method for
balancing treatment numbers over prognostic factors in the controlled
clinical trial. Biometrics, 32, 691–694.
Galloway, D, Martin, R, & Wilcox, B. (1985). Persistent absence from school and
exclusion from school: the predictive power of school and community
variables. British Educational Research Journal, 11(1), 51–61.
Gazeley, L. (2010). The role of school exclusion processes in the re-production of
social and educational disadvantage. British Journal of Educational Studies,
58(3), 293–309.
Gilbertson, D. (1998). Exclusion and crime. In N Donovan (Ed.), Second Chances:
Exclusion from school and equality of opportunities. London: New Policy
Institute.
Gilmour, J, Hill, B, Place, M, & Skuse, DH. (2004). Social Communication Deficits in
Conduct Disorder: a clinical and community survey. Journal of Child
Psychology & Psychiatry, 45(5), 967–978.
Graham, J. (1988). Schools, disruptive behavior and delinquency - a review of
research. In Research Study 96. London: Home Office.
Hayden, C. (2009). Deviance and violence in schools: A review of the evidence in
England. International Journal of Violence and School, 9, 8–35.
Hedges, L, & Rhoads, C. (2010). Statistical Power Analysis in Education Research.
Washington: National Center for Education Research, Institute of Education
Sciences, US Department of Education.
Jaffee, SR, Strait LB, O, & Candice, L. (2012). From correlates to causes: Can quasiexperimental studies and statistical innovations bring us closer to identifying
the causes of antisocial behavior? Psychological Bulletin, 138(2), 272–295.
Lerner, RM, Almerigi, JB, Theokas, C, & Lerner, JV. (2005). Positive youth
development a view of the issues. The Journal of Early Adolescence, 25, 10–16.
Macrae, S, Maguire, MEG, & Milbourne, L. (2003). Social exclusion: Exclusion from
school. International Journal of Inclusive Education, 7(2), 89–101.
Massey, A. (2011). Best behaviour: School discipline, intervention and exclusion.
[Retrieved from />Best_Behaviour_Apr_11.pdf]
McAra, L, & McVie, S. (2010). Youth crime and justice: Key messages from the
Edinburgh study of youth transitions and crime. Criminology and Criminal
Justice, 10(2), 179–209.
Meltzer, H, Gatward, R, Corbin, T, Goodman, R, & Ford, T. (2003). Persistence, onset,
risk factors and outcomes of childhood mental disorders. London: Office of
National Statistics.
Moher, D, Hopewell, S, Schulz, KF, Montori, V, Gøtzsche, PC, Devereaux, PJ,
Elbourne, D, Egger, M, & Altman, DG. (2010). CONSORT 2010 Explanation and
Elaboration: updated guidelines for reporting parallel group randomised trial.
British Medical Journal, 340, c869.
Munn, P, & Lloyd, G. (2005). Exclusion and excluded pupils. British Educational
Research Journal, 31(2), 205–221.
Munn, P, Lloyd, G, & Cullen, MA. (2000). Alternatives to Exclusion from School.
London: Paul Chapman Publishing Ltd.
Oakley, A. (2006). Process evaluation in randomised controlled trials of complex
interventions. British Medical Journal, 332, 413–416.
Page 16 of 16
Osler, A, & Vincent, K. (2003). Girls and exclusion. London, Routhledge Falmer:
Rethinking the agenda.
Parsons, C. (2005). School exclusion: The will to punish. British Journal of
Educational Studies, 53(2), 187–211.
Pawson, R, & Tilley, N. (2004). Realistic Evaluation. In S Matthieson (Ed.),
Encyclopedia of Evaluation. Newbury Park: Sage.
Pocock, SJ, & Simon, R. (1975). Sequential treatment assignment with balancing
for prognostic factors in the controlled clinical trial. Biometrics, 31, 103–115.
Raudenbush, SW, Spybrook, J, Congdon, R, Liu, X, & Martinez, A. (2011). Optimal
design software for multi-level and longitudinal research (Version 3.01).
[Software]. []
Ripley, K, & Yuill, N. (2005). Patterns of Language Impairment and Behaviour in
Boys Excluded from School. British Journal of Educational Psychology,
75(1), 37–50.
Rosenbaum, PR, & Rubin, DB. (1983). The central role of the propensity score in
observational studies for causal effects. Oxford Journals, 70(1), 41–55.
Rosenbaum, PR, & Rubin, DB. (1985). Discussion of 'On State Education Statistics':
A difficulty with regression analyses of regional test score averages. Journal
of Educational Statistics, 10(4), 326–333.
Rosenthal, R, & Jacobsen, L. (1968). Pygmalion in the Classroom: Teacher
expectation and pupils’ intellectual development. New York: Holt, Rinehart &
Winston.
Rutter, M, Maughan, B, Mortimore, P, & Outston, J. (1979). Fifteen Thousand Hours:
Secondary Schools and their Effects on Children. Cambridge, M.A.: Harvard
University Press.
Saghaei, M, & Saghaei, S. (2011). Implementation of an open-source customizable
minimization program for allocation of patients to parallel groups in clinical
trials. Journal of Biomedical Science and Engineering, 04(11), 734–739.
Shadish, WR, Cook, TD, & Campbell, DT. (2002). Experimental and QuasiExperimental Designs for Generalized Causal Inference (2nd edition). Boston:
Houghton-Mifflin.
Sherman, LW. (1993). Defiance, Deterrence and Irrelevance: A Theory of the
Criminal Sanction. Journal of Research in Crime and Delinquency, 30, 445–473.
Sparkes, J. (1999). Schools, education and social exclusion. CASEpaper,
29. [Retrieved from />Speilhofer, T, Benton, T, Evans, K, Featherstone, G, Golden, S, Nelson, J, & Smith, P.
(2009). Increasing participation: Understanding young people who do not
participate in education or training at 16 or 17. [Retrieved from https://www.
nfer.ac.uk/publications/PEJ01/PEJ01_home.cfm]
Spybrook, J, Raudenbush, SW, Congdon, R, & Martınez, A. (2011). Optimal design
for longitudinal and multilevel research: Documentation for the “Optimal
Design” software. []
Sutherland, A, & Eisner, M. (2014). The Treatment Effect of School Exclusion on
Unemployment. SSRN. />Tavers, DR. (1974). Minimization: A new method of assigning patients to
treatment and control groups. Clinical Pharmacological Therapy, 15, 443–453.
Treasure, T, & McRae, KD. (1998). Minimisation: the platinum standard for trials?
Randomisation doesn’t guarantee similarity of groups; minimisation does.
British Medical Journal, 317(7155), 362–363.
Van Daal, J, Verhoeven, L, & Van Balkom, H. (2007). Behaviour problems in
children with language impairment. Journal of Child Psychology and
Psychiatry, 48(11), 1139–1147.
Wight, D, & Obasi, A. (2002). Unpacking the “black box”: the importance of
process data to explain outcomes. In J Stephenson, J Imrie, & C Bonell (Eds.),
Effective sexual health interventions: issues in experimental evaluation
(pp. 151–166). Oxford: Oxford University Press.
(1998). UK Social Exclusion Unit. [Retrieved from http://webarchive.
nationalarchives.gov.uk/+/http:/www.cabinetoffice.gov.uk/media/
cabinetoffice/social_exclusion_task_force/assets/publications_1997_to_2006/
seu_leaflet.pdf]
doi:10.1186/s40359-014-0024-5
Cite this article as: Obsuth et al.: London Education and Inclusion
Project (LEIP): A cluster-randomised controlled trial protocol of an
intervention to reduce antisocial behaviour and improve educational/
occupational attainment for pupils at risk of school exclusion. BMC
Psychology 2014 2:24.