Evaluating the applicability of a low-cost sensor for measuring PM2.5 concentration in Ho Chi Minh city, Viet Nam
Bạn đang xem bản rút gọn của tài liệu. Xem và tải ngay bản đầy đủ của tài liệu tại đây (1.13 MB, 5 trang )
Science & Technology Development Journal, 22(3):343- 347
Original Research
Open Access Full Text Article
Evaluating the applicability of a low-cost sensor for measuring
PM2.5 concentration in Ho Chi Minh city, Viet Nam
Nguyen Doan Thien Chi* , To Thi Hien
ABSTRACT
Use your smartphone to scan this
QR code and download this article
Introduction: Continuous monitoring provides real-time data which is helpful for measuring air
quality; however, these systems are often very expensive, especially for developing countries such
as Vietnam. The use of low-cost sensors for monitoring air pollution is a new approach in Vietnam and this study assesses the utility of low-cost, light-scattering-based, particulate sensors for
measuring PM2.5 concentrations in Ho Chi Minh City. Methods: The low-cost sensors were compared with both a Beta attenuation monitor (BAM) reference method and a gravimetric method
during the rainy season period of October to December 2018. Results: The results showed that
there was a very strong correlation between two low-cost sensors (R = 0.97, slope = 1.0), and that
the sensor precision varied from 0 to 21.4% with a mean of 3.1%. Both one-minute averaged data
and one-hour averaged data showed similar correlations between sensors and BAM (R2 = 0.62 and
0.69, respectively), while 24-hour averaged data showed excellent agreement (R2 = 0.95, slope =
1.05). In addition, we also found a strong correlation between those instruments and a gravimetric
method using 24-hour averaged data. A linear regression was used to calibrate the 24-hour averaged sensor data and, once calibrated, the bias dropped to zero. Conclusion: These results show
that low-cost sensors can be used for daily measurements of PM2.5 concentrations in Ho Chi Minh
City. The effect of air conditions, such as temperature and humidity, should be conducted. Moreover, technical methods to improve time resolution of low-cost sensors need to be developed and
applied in order to provide real-time measurements at an inexpensive cost.
Key words: Low-cost sensor, particulate, PM2.5, Ho Chi Minh City
INTRODUCTION
Faculty of Environment,
VNUHCM-University of Science
Correspondence
Nguyen Doan Thien Chi, Faculty of
Environment, VNUHCM-University of
Science
Email:
History
• Received: 2019-06-18
• Accepted: 2019-09-09
• Published: 2019-09-30
DOI :
/>
Copyright
© VNU-HCM Press. This is an openaccess article distributed under the
terms of the Creative Commons
Attribution 4.0 International license.
Particulate matter is one of the most important components of air pollution. The particulate matter is
emitted from various sources which may affect the
size and composition of the particles. Particulate matter whose aerodynamic diameter is 2.5 µ m or below
is known as PM2.5 . The smaller the particles are,
the easier it is for them to penetrate the respiratory
system and for PM2.5 to enter into human blood 1 .
In addition, the composition of particles is also an
important factor that directly affects human health.
PM2.5 affects not only human heath but also has an
impact on the global climate. There are a variety of
methods used for determining the concentration of
particles in the atmosphere. Both gravimetric and
continuous methods 2,3 such as impactors (gravimetric method), tapered element oscillating microbalances and beta attenuation monitors are widely used,
while instruments such as the DustTrak and SidePak
use light scattering to obtain particle mass concentrations. These methods are often time-consuming or
expensive, especially for continuous monitoring devices.
Around the world the application of low-cost sensors
in monitoring air pollutants has received a great deal
of attention in recent years with one of the first studies
of small, low-cost sensors being recently described 4 .
Based on the report from the World Meteorological
Organization, imple, low-cost single pollutant sensors
are available for below $50 USD. High-cost sensor
have not been clearly defined however, more sophisticated multi-parameter, fully autonomous sensors systems with hardware cost more than ~ $10,000 USD 5 .
Low-cost dust sensors based on light scattering have
been developed 6 , and usually consist of an infrared
emitting diode and a phototransistor. Air particles
pass through the sensor, scatter light, and the detector
measures the intensity of the scattered light which is
related to the mass concentrations of particles 7 . There
has been an increasing focus on calibrating the performance of low-cost sensors to account for the effects of
particle size, composition, atmospheric temperature
and humidity, etc, against established reference methods 7,8 . Low-cost sensors have some important limitations, such as stability and cross-sensitivity. There is
much to be gained by comparing the performance of
Cite this article : Thien Chi N D, Hien T T. Evaluating the applicability of a low-cost sensor for measuring PM2.5 concentration in Ho Chi Minh city, Viet Nam. Sci. Tech. Dev. J.; 22(3):343-347.
343
Science & Technology Development Journal, 22(3):343-347
low-cost sensors against reference devices and methods under a range of environmental conditions.
There is no national monitoring network for PM2.5
concentrations in Vietnam and measurement data are
still rare. The few previous studies of the levels of
PM2.5 in Vietnam found very high concentration that
greatly exceed the Vietnam National Technical Regulation on Ambient Air Quality or World Health Organization ambient air quality standards 9,10 .
Ho Chi Minh City is a populous city and one of the
economic hubs of Vietnam. Besides economic activities, environmental protection has increasingly become an important issue. As such there is a clear need
for monitoring in Ho Chi Minh City. Unfortunately,
since 2010 automatic monitoring stations belonging
to the Ho Chi Minh City Air Quality Monitoring Network have not been able to operate. Therefore, data
of air quality, especially particulate matter (PM), are
lacking.
The application of low-cost sensors to measure air
quality is a new approach in Vietnam. There has
been one previous study in Hanoi using a Panasonic
PM2.5 sensor 9 , while there have not been any papers
on the application of low-cost sensors in air quality
assessment in Ho Chi Minh City. Therefore, in this
study, we compare a Plantower Laser PM2.5 dust sensor PMS 3003 against reference methods, with the aim
of assessing the applicability of low-cost sensors for
measuring PM2.5 .
METHODS AND MATERIALS
Setting up PM2.5 sensor
The Plantower Laser PM2.5 dust sensor PMS 3003 is
a low-cost (~ $15 USD) commercially-available laser
particle sensor. This sensor is used for measuring
PM2.5 in a network of low-cost devices from Location
Aware Sensing Systems. The sensor effective measurement range is between 0 and 500 µ g/m3 , with a
resolution of 1 µ g/m3 . The working conditions (temperature and relative humidity) of the sensors are -10
to 60 ◦ C and 0 to 99%, characteristics which are suitable for measuring the PM2.5 in ambient air in Ho Chi
Minh City. A Plantower Laser PM2.5 dust sensor and
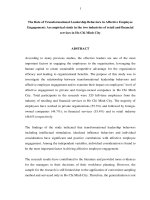
a LinkIt ONE board were combined to become a lowcost sensor (<100$), as illustrated in Figure 1a. The
data from two of these low-cost sensors were compared against those obtained with a reference method,
using a FH 62 C14 beta attenuation monitor (BAM)
(Thermo Scientific, USA). The BAM was situated in
the air monitoring station of the Faculty of Environment, VNU-HCM University of Science, located on
the rooftop of a 11-storey building. The BAM is calibrated twice per year by mass foils. The two sensors
344
and the BAM were located physically close to each
other so that the two devices could measure the same
air (Figure 1 b).
Figure 1: A combination of a Plantower Laser
PM2.5 dust sensor PMS3003 and a LinkIt ONE
board as a sensor system (a); location of sensor
and BAM (b).
Collecting data
The instruments were run for three months from October 2018 to December 2018, and one-minute sensor
readings were averaged over one-hour and 24-hour
periods, for comparison with BAM and gravimetric
data (obtained with an SKC Inc Impactor at 10 L/min
over 24 hours on quartz fiber filters). Initially the two
low-cost sensors were tested over two days to compare
their responses to atmospheric PM2.5 concentrations.
Subsequently, data from the sensors and BAM were
collected at the same time and same location, with a
1-week period of coincident impactor measurements.
Calibrating the low-cost sensor
The laboratory calibration method was provided by
the EPA 2014 Air Sensor Guidebook 11 . We compared
the response of the low-cost sensor with data from the
reference device. Then, we created a calibration curve
that relates the responses of the low-cost sensor to the
reference instrument using a mathematical equation.
We used a set of one month of sensor data for plotting
a calibration curve and then applied the mathematical equation to the data from the following month.
Finally, bias was calculated to assess the performance
of low-cost sensor.
RESULTS
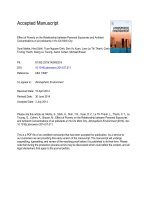
To obtain theintra-sensor correlation, a scatter plot of
one-minute data from two days of sensor measurements was created, as illustrated in Figure 2. It shows
a very good correlation between the two low-cost sensors (R2 = 0.95, slope = 1).
The sensor data were compared to those of the BAM
using one-minute data, one-hour averages, and 24hour averages. The one-minute sensor and BAM data
show a correlation of R2 =0.62 and a slope = 0.75, with
Science & Technology Development Journal, 22(3):343-347
DISCUSSION
The response of two low-cost sensors to
PM2.5
Figure 2: Scatter plot between the two sensors
(n=2634).
the correlation of one-hour averages being slightly
better (R2 = 0.69). However, a strong correlation between the 24-hour averages of the two instruments
was found (R2 = 0.96, slope = 0.88). Figure 3 illustrates the variation of one-minute data and 24-hour
averaged data of the low-cost sensor and BAM over
the measurement period.
As shown in Figure 2, there was a very good correlation between the two low-cost sensors (R2 = 0.95,
slope = 1) which is in agreement with the study by
Sayahi, which also found high agreement between the
same type of low-cost sensors 12 . A statistical t-test
was used to determine if there are any significant differences between the two measurements, and the results are shown in Table 1. The means of the two
sensors were 33.86 and 34.16 µ g/m3 , with variance
of 69.46 and 72.40, respectively (n = 2634). The t
stat value was smaller than the t critical, showing that
there was no difference between the two sensors. Sensor precision was calculated via the coefficient of variation (CV) of the raw outputs: CV = Cs/Cm (where
CV is the precision, Cs is the standard deviation of the
measurements, and Cm is the measurement mean),
and with acceptable CV values being smaller than
10% 7 . The CV was calculated for each minute for the
two sensors and varied from 0 to 21.4%, with a mean
of 3.1% (with the third quartile of CV being less than
5%). These results suggest that the two low-cost sensors can be treated similarly when monitoring PM2.5
concentrations.
Table 1: The t-test result of the two sensors
t-Test: Two-Sample Assuming Unequal Variances
Sensor 1
Sensor 2
Mean
33.86
34.16
Variance
69.46
72.40
Observations
2634
2634
Hypothesized Mean Difference
0
t Stat
-1.28
P(T<=t) two-tail
0.20
t Critical two-tail
1.96
Comparison of sensor to BAM
Figure 3: Variation of minute data (a) and 24hour averaged data (b) of the low-cost sensor
(red line) and BAM (blue line).
The one-minute data from the sensors showed very
similar variations of PM2.5 to those measured by the
BAM. However, there were many spikes in the sensor data (Figure 3 a) which were not evident in the
BAM record. Although the 24-hour averaged data
of the sensors give very similar results to the BAM,
345
Science & Technology Development Journal, 22(3):343-347
the spikes in the 24-hour averaged data were higher
than those of the BAM. The study of similar sensors
in Hanoi showed a higher correlation of hourly data
between a Panasonic sensor and a BAM (3.1 km away
from Panasonic sensor), with R2 = 0.85 and slope of
0.99 9 . The Panasonic and Plantower sensors are both
low-cost sensors which are based on the light scattering principle. However, there are no studies comparing these sensors against each other.
To compare sensor data to the true value of PM2.5 obtained from BAM, bias calculations can be performed.
Bias is a fixed value that is added or subtracted from
the true value due to the response of the sensor 11 . A
bias calculation is as follows: B = CCR − 1, where B is
the bias, C is the average of the sensor, and CR is the
true concentration of the pollutant. Zero bias is ideal,
but bias values lower than 0.1 can be acceptable. The
bias calculated for one-minute, one-hour and 24-hour
averaged data were 0.66, 0.43 and 0.11, respectively.
The bias of the one-minute data was large; however,
the bias of the 24-hour averaged data was acceptable.
Over a seven-day period, both the sensor and BAM
data were compared against a gravimetric method and
both showed high correlations with the impactor data
(R2 = 0.95 for sensor and R2 = 0.99 for BAM, (n = 7)).
The 24-hour averages of the sensor, BAM and filters
were 34.6 ± 10.5, 31.9 ± 9.9, and 30.9 ± 10.6 µ g/m3 ,
respectively.
Calibration of low-cost sensor
Calibrations of the sensor measurements were performed using 24-hour averaged data from the lowcost sensor because these data gave the highest correlation with the BAM. A calibration curve that relates sensor to BAM data was created by linear regression resulting in the equation Y = 0.74X + 4.41, where
Y is the calibrated value and X is the measured sensor value. Calibrated 24-hour averages of PM2.5 are
shown in Figure 4.
After the calibration, the sensor data were much
closer to the true value of PM2.5 , with the bias decreasing from 0.11 to 0.01. To test the calibration, the
linear equation was applied to 10 more days of sensor
data. The mean of the 24-hour averaged data of the
sensor, BAM, and sensor were 27.0 ± 6.0, 24.8 ± 4.9,
and 24.3 ± 4.5, respectively. The bias also decreased
from 0.08 to -0.01. These results suggest that a linear
relationship can be used for calibrating 24-hour averaged data obtained from the Plantower Laser PM2.5
dust sensor. For comparison with other studies, as Table 2 shows, this sensor and reference method can be
used, along with other low-cost sensor and reference
methods.
346
Figure 4: Variation of 24-hour averaged data of
the low-cost sensor (red), BAM (blue) and calibrated sensor (sensor’) shown in green.
The Plantower sensors give the highest correlation coefficient when comparing 24-hour measurements to
the reference method. However, it is not good for
measuring higher time resolutions, such as hourly and
minute data. The Panasonic and DC1700 could effectively compare hourly and minute data; however, the
DC1700 (~ $400 USD) has a much higher cost than
the Panasonic or Plantower sensors (~ $15 USD). The
DC1700 is a completed sensor system that can measure PM in air without any further buildup.
CONCLUSION
This study focused on evaluating the applicability of
low-cost sensors for measuring PM2.5 concentration
in Ho Chi Minh City. The results showed that the
Plantower sensor had a high intra-sensor correlation
(R2 = 0.97, slope = 1) and that during a three-month
test under real conditions, it was found that 24-hour
measurements of the sensor can be used for PM2.5
monitoring in Ho Chi Minh City. After calibration,
the bias was approximately zero and close to the true
value of PM2.5 concentrations in the air. In the future,
research on the effects of temperature and humidity in
each season in Ho Chi Minh City on the performance
of low-cost sensors should be conducted. Moreover,
the technical methods to improve time resolution of
low-cost sensors need to be developed and applied so
that they can provide real-time measurements at a relatively inexpensive cost.
LIST OF ABBREVIATIONS
BAM: beta attenuation monitor
PM: Particulate matter
CV: Coefficient of variation
CPC: Condensation particle counter
SMPS: Scanning Mobility Particle Sizer
TEOM: Tapered element oscillating microbalance
Science & Technology Development Journal, 22(3):343-347
Table 2: Performance of different low-cost particles sensors
Sensor
Sampling
time
Reference
method
Coefficient
(R2 )
Mathematical
equation
Bias
%
References
DC1700
minutely
CPC and
SMPS
0.99
-
-1.1 to -9.1
Panasonic-PM2.5 sensor
hourly
BAM
0.73
Y = 1.4X
-
Plantower PMS 1003/5003
hourly
TEOM
24-h averaged
Plantower PMS3003
24-h
averaged
0.18 - 0.32
(in spring)
Various
models
0.88 - 0.97
BAM
0.90
-22.1
-29.1
7
9
to
12
-
Y = 0.74X +
4.41
-0.01
This
study
CPC: Condensation particle counter
SMPS: Scanning Mobility Particle Sizer
TEOM: Tapered element oscillating microbalance
AUTHORS’ CONTRIBUTIONS
The author Nguyen Doan Thien Chi did the experiment and wrote the manuscript. The author To
Thi Hien discussed the results and contributed to
the final manuscript. All authors approved the final
manuscript.
COMPETING INTERESTS
The authors declare that they have no competing interests.
ACKNOWLEDGMENTS
The authors are grateful to VNUHCM-University of
Science for supporting to do this research under Grant
No. T2018-28. The authors would like to thank Location Aware Sensor System (LASS) group and ShihChun Candice Lung, Sc.D. from Research Center
for Environmental Changes, Academia Sinica, Taipei,
Taiwan for providing the sensors. We would like to
thank Dr Graham Mills from Centre for Ocean and
Atmospheric Sciences School of Environmental Sciences, University of East Anglia, Norwich, UK for
editing the manuscript.
REFERENCES
1. Dockery DW, Pope CA, Xu X, Spengler JD, Ware JH, Fay ME,
et al. An Association between Air Pollution and Mortality in Six
U.S. Cities. New England Journal of Medicine. 1993;329:1753–
1759.
2. Stocker T, Qin D, Plattner G, Tignor M, Allen S, Boschung J,
et al.. Climate Change 2013: The Physical Science Basis. Contribution of Working Group I to the Fifth Assessment Report of
the Intergovernmental Panel on Climate Change. IPPC; 2013.
3. Hien PD, Bac VT, Tham HC, Nhan DD, Vinh LD. Influence
of meteorological conditions on PM2.5 and PM2.5−10 concentrations during the monsoon season in Hanoi, Vietnam.
2002;36:3473–3484.
4. Holstius D, Pillarisetti A, Smith K, Seto E. Field Calibrations of
a Low-Cost Aerosol sensors at a Regulatory Monitoring Site
in California. Atmospheric Measurement Techniques Discussions. 2014;7:605–632.
5. World Meteorological Organization. Low-cost sensors for the
measurement of atmospheric composition: overview of topic
and future applications; 2018.
6. Sousan S, Koehler K, Thomas G, Park JH, Hillman M, Halterman
A, et al. Inter-comparison of low-cost sensors for measuring
the mass concentration of occupational aerosols. Aerosol Science and Technology. 2016;50:462–473.
7. Chowdhury Z, Rufus DE, Johnson M, Shields KN, Allen T,
Canuze E, et al. An inexpensive light-scattering particle monitor: field validation. Journal of Environmental Monitoring.
2007;9:1099–1106.
8. Liu D, Zhang Q, Jiang J, Chen DR. Performance Calibration
of Low-cost and Portable Particular Matter (PM). Journal of
Aerosol Science. 2017;112:1–10.
9. Ly BT, Matsumi Y, Nakayama T, Sakamoto Y, Kajii Y, Nghiem
TD. Characterizing PM2.5 in Hanoi with New High Temporal Resolution Sensor. Aerosol and Air Quality Research.
2019;18:2487–2497.
10. Giang NTH, Oanh NTK. Roadside levels and traffic emission
rates of PM2.5 and BTEX in Ho Chi Minh City, Vietnam. Atmospheric Environment. 2014;94:806–816.
11. EPA. Air Sensor Guidebook; 2014.
12. Sayahi T, Butterfield A, Kelly KE. Long-term field evaluation of
theplantower PMS low-cost particulate matter sensors. Environmental Pollution. 2018;245:932–940.
347