Study on the effect of exposure time and layer thickness on properties of 3D printing parts using DLP method
Bạn đang xem bản rút gọn của tài liệu. Xem và tải ngay bản đầy đủ của tài liệu tại đây (375.4 KB, 5 trang )
Journal of Science & Technology 138 (2019) 023-027
Study on the Effect of Exposure Time and Layer Thickness on Properties
Of 3D Printing Parts Using DLP Method
Nguyen Thanh Nhan1*, Nguyen Huy Ninh1, Tran Vu Minh, Nguyen Quang Huy1, Le Anh Tuan2
1
Hanoi University of Science and Technology, No. 1, Dai Co Viet, Hai Ba Trung, Hanoi, Viet Nam.
2
SeojinVina Co. Ltd
Received: April 23, 2019; Accepted: November 28, 2019
Abstract
In recent years, 3D printing technology has been used in many industrial and home products. This paper
investigates the effects of process parameters on the mechanical properties of 3D printing parts using
photopolymer material. A DLP 3D printing machine was constructed for experimental researches and
education. Two input control parameters: exposure time T(s) and layer thickness L(mm) were selected to
investigate (i) the effects they have on various output data of tensile strength, bending strength and Shore A
hardness and (ii) the effects of layer thickness to the shrinkage along Z axis. The results can be used in the
process of choosing the suitable process parameters when printing 3D using the DLP method.
Keywords: Additive Manufacturing, 3D printing, DLP, Process parameters, Shore A hardness.
1. Introduction
Additive* Manufacturing (AM) or 3D printing is
a technology in which parts are fabricated layer by
layer directly from 3D CAD data without removal of
material with cutting tools. AM has significant
advantages in Rapid Prototyping Technology because
it can fabricate prototypes without moulds [2].
Furthermore, since the manufacturing process is layer
based, AM can create complex structures that might
not be possible with traditional manufacturing
methods. In recent years, AM witnesses a trend from
prototyping to manufacturing [3]. Hence, 3D printed
parts need to be at better quality, more resilient to
loads.
screen instead of laser like in SLA. Because of this,
DLP 3D printers can print a layer at a time and the
printing speed increases noticeably. Moreover, the
structure of the machines is also considerably
simplified. It has the advantages and overcomes the
disadvantages of SLA and SCB techniques. This paper
investigates the effect of process parameters on the
properties of DLP 3D printing parts. The study was
conducted on a DLP 3D printer fabricated for research
and educational purpose.
Nowadays, the standard file format for 3D
printing is STL or Stereolithography created by 3D
Systems and native to Stereolithography CAD
software [4]. The imported STL file has to be sliced
into layers and sent to 3D printing machine to begin
the manufacturing process.
Introduced by Texas Instrument and Digital
Projection Ltd in the end of the 20th century, Digital
Light Processing technology based on optical microelectro-mechanical technology that uses a matrix of
Digital Micro mirror Devices with pixel pitch of less
than 5.4 μ [5]. Each device projects one or more
pixels of the image. The movement of the mirrors
creates the colours and shape of the image.
2. Experimental procedure
2.1 Digital light Processing technology
There are many 3D printing technologies in the
world today, for example: Fused Deposition Modeling
(FDM), Stereolithography (SLA), Solid-Base Curing
(SBC)… [9] or Digital Light Processing (DLP).
However, in Vietnam, most researches focus on the
FDM technique.
DLP technology can be used with a various of
light sources. However, Xenon arc lamp unit is the
most popular light source.
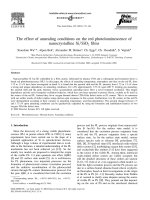
2.2 Photopolymer
The DLP 3D printing technology uses
photopolymer like the SLA technology but the main
difference is that DLP uses digital light projector
Photopolymer is a polymer that changes its
properties when exposed to light, often in the
*
Corresponding author: Tel: (+84) 932311568
Email:
23
Journal of Science & Technology 138 (2019) 023-027
ultraviolet or visible region of the electromagnetic
spectrum as shown in figure 1 [6]. To be hardened,
photopolymer goes through a process known as curing
where UV light induces polymerization [7].
There are two methods of DLP 3D printing:
- The model will be printed by being pulled layer
by layer out of the polymer sink. This method has
many advantages, but machine operators need to
ensure that the first layer sticks firmly to the printing
base and does not stick to the bottom of the polymer
sink.
- The model will be printed by being pushed in the
polymer sink. The new layer will be created on the
surface of the liquid polymer.
A DLP 3D printer was fabricated based on the
principle above, as shown in figure 3. The machine has
prismatic motion on the Z axis. A Nema 17 Stepper
motor is controlled by board Arduino 2560 embedded
with Marlin source code. A power screw with the pitch
of 8 mm and the diameter of 8 mm are used to convert
rotary motion into prismatic motion.
Fig. 1. Polymerization process.
2.3 DLP 3D printer
Principle of a DLP 3D printer, as shown in figure 2:
The printing base moves closely to the bottom of
the polymer sink with the distance of a printing layer.
The light source is the DLP office projector Acer
X-113PH
The DLP Projector projects the shape of that
layer for a period of time. The length of one exposure
period depends largely on the light source and has
effects on properties of printed parts.
The printing base moves up from 3 mm to 7 mm to let
photopolymer fill in the printed area. In this research,
to ensure a new polymer layer covering the surface, the
speed of 25mm/min. was chosen to lift the base to 7
mm.
The printing base moves down. To increase
productivity and guarantee convection, and ensure that
the liquid photopolymer filling the new layers, the
downward feed rate was set to 150 mm/min.
The DLP Projector continues projecting the next
layer.
The process from 3 to 5 above repeats until final
layer is printed.
Fig. 3. DLP 3D Printer.
2.4 Experiments to calibrate printing ratio:
The testing prototype was designed as a
rectangular cuboid with the dimension of 30 x 20 x 1
mm.
Chosen process parameters: T = 40s; L = 0.1 mm;
The printed prototype had the average dimension
of 58.8 x 39.3 x 0.9 mm.
Since the printed parts were thin, if the shrinkage
ration is ignored, the printing ratio along the X axis and
Y axis is 1.96. With this result, the ratio in the Creation
Fig. 2. DLP 3D printing process
24
Journal of Science & Technology 138 (2019) 023-027
Workshop software to 51% along the X axis and Y axis
was calibrated to get the dimension of the printed part
equal to the designed part.
The specimens and testing machines at the
Laboratory of Polymer and Composite, Hanoi
University of Science and Technology are shown in
figure 5.
2.5 Experimental model
The quality of fabricated parts can be influenced
by process parameters[8]. In the DLP 3D printer, 2
control parameters are layers thickness and exposure
time. Both can be controlled by slicing software and
embedded control program.
The luminous intensity of the projector was set to
50% because with the too intense light source, the
polymer outside projected zone would also be cured.
In addition to the effects of layer thickness to the
strength of parts, another process parameter which
might directly affect the strength of the printed parts is
the exposure time. This is vital to the bond between
layers. Too long exposure time can make the build
losing its definition while too short exposure time can
make the build not sticking together [3].
a-
Tension testing.
b- Specimens.
Table 1. Process parameters
Exposure Time T(s)
30
40
50
60
Layer thickness
L(mm)
0.10
0.20
0.30
-
Photosensitive resin material used in the
experiments is CTC- Xitong photosensitive resin.
c-
Material properties: High toughness material
Flexural testing
Cured wavelength: 405nm
The standardized testing specimens were
fabricated with the process parameters as described in
Table 1.
Testing specimen dimensions were used
according to standard TCVN 9853:2013, as shown in
figure 4.
Fig. 4. a) Tension Testing specimen
b) Bending Testing specimen
d- Shore A testing
Fig. 5. Testing machines and specimens
25
Journal of Science & Technology 138 (2019) 023-027
3. Results and discussion:
Testing results are shown in tables 2, 3 and 4.
Table 2. Tension strength
Exposure
Time T(s)
30
40
50
60
Layer thickness (mm)
0.2
0.3
Tension strength (MPa)
8.42
7.06
6.60
9.88
9.08
7.06
11.37
11.12
7.75
12.38
11.86
8.46
0.1
Fig.8. Shore A hardness results
Table 3. Bending strength
Based on the above results, the authors made the
following observations:
Layer thickness (mm)
0.1
0.2
0.3
Bending strength (MPa)
13.6
9.8
6.2
19.7
12.8
7.6
16.6
11.2
6.8
16.0
9.8
6.3
Exposure Time
T(s)
30
40
50
60
3.1 Effects of layer thickness:
Increasing the layer thickness will decrease the
tensile strength and the bending strength of the parts.
However, when the exposure time is long enough, the
effects reduce due to the fact that the thick layers have
enough curing time. When the thickness reaches
0.3mm, the strength decreases significantly.
Table 4. Shore A hardness
Exposure
Time T(s)
Average
Shore A
30
40
50
60
77.33
83.33
89.33
92.00
Apart from the effects of layer thickness to
strength and hardness of the specimens, the layer
thickness also effects the shrinkage of specimen
especially along Z axis. The part thickness is measured
by digital calliper and the results show that the
shrinkage along Z axis is from 3.5%, 3.8% and 4.2%
with the layer thickness of L=0.1mm, L=0.2mm and
L=0.3mm respectively.
3.2 Effects of exposure time:
The tensile and bending strength of parts also
increase when increasing the exposure time. However,
when the layers are thin and the exposure time
increases from 50s to 60s, the strength of the parts does
not increase noticeably. This can be explained by the
fact that the layer is thin so the exposure time of 50s is
enough to cure the polymer to the highest strength
possible.
Fig. 6. Tension strength results
Figure 8 shows that when increasing the exposure
time, the Shore A hardness of parts increases almost
linearly, but when the exposure time is over 50s the
hardness nearly reaches the possible hardness of the
polymer, thus the increase rate reduces.
4. Conclusion
After the experiments, the paper has a few
suggestions for machine operators: when printing with
the thick layers, long exposure time should be applied.
However, the exposure time should not be too long
because apart from reducing the productivity, long
exposure time will make the photopolymer around the
parts cured due to light scattering and increase the
Fig.7. Flexural strength results
26
Journal of Science & Technology 138 (2019) 023-027
[5]
Texas Instruments, DLP3010 Mobile HD Video
and Data Display Description & parametricsitle,
2014.
[6]
This research is funded by the Hanoi University
of Science and Technology (HUST) under project
number T2017-PC-040
J. V Crivello and E. Reichmanis, Photopolymer
Materials
and
Processes
for
Advanced
Technologies,Chem. Mater., vol. 26, no. 1, pp. 533–
548, Jan. 2014.
[7]
R. Phillips, Photopolymerization,J. Photochem.,
vol. 25, no. 1, pp. 79–82, 1984.
References
[8]
B. Raju, Vhandrashekar.u, d. Drakshayani, and c.
Kunjan, determining the influence of layer
thickness
for
rapid
prototyping
with
stereolithography (SLA) process, vol. 2. 2010.
[9]
Nguyen Huy Ninh, Bài giảng môn Cơ sở thiết kế
Khuôn Mẫu. Bach Khoa Publishing House -Hanoi2010
dimensional errors along X and Y axis. The exposure
time can be adjusted based on the demanded properties
of parts. Shrinkage of printing parts along Z axis
increases when layer thickness increases.
Acknowledgments
[1]
A.
Gebhardt,
Understanding
Additive
Manufacturing. Munich: Hanser Publication, 2012.
[2]
L. Chen, Y. He, Y. Yang, S. Niu, and H. Ren, The
research status and development trend of additive
manufacturing technology,Int. J. Adv. Manuf.
Technol., vol. 89, no. 9–12, pp. 3651–3660, 2017.
[3]
A. Ibrahim and M. Ibrahim, Optimization of
Process Parameter for Digital Light Processing (
Dlp ) 3D Printing,no. April, pp. 19–22, 2017.
[4]
3D
Systems,
StereoLithography
Specification, 1988.
Interface
27