DOA estimation method for wideband signal using nested antenna array based on matrix pencil algorithm
Bạn đang xem bản rút gọn của tài liệu. Xem và tải ngay bản đầy đủ của tài liệu tại đây (351.73 KB, 5 trang )
Journal of Science & Technology 136 (2019) 039-043
DOA Estimation Method for Wideband Signal using Nested Antenna Array
Based on Matrix Pencil Algorithm
Han Trong Thanh*
Hanoi University of Science and Technology – No. 1, Dai Co Viet Str., Hai Ba Trung, Ha Noi, Viet Nam
Received: March 07, 2019; Accepted: June 24, 2019
Abstract
Radio Direction Finding (RDF) systems have a lot of applications in both civil and military area such as
Radio Navigation, Electronic warfare or Emergency Aid and intelligent operations. In modern communication
system, wideband signals are widely used especially in wireless localization field. In this paper, a novel RDF
system using Nested Antenna Array and Total Forward Backward Matrix Pencil Algorithm is proposed. This
system can calculate the DOA of signals coming from the number of sources more than the number of
antenna elements. The simulation results for DOA estimation of wideband signals using the proposed
system will be shown and analyzed to verify its performance.
Keywords: Direction of Arrival (DOA), Nested Antenna Array (NAA), TFBMP.
covariance matrix of the received signals at each
antenna element.
1. Introduction
Direction* Of Arrival (DOA) of incoming signal
is the most important information estimated by Radio
Direction Finding systems which have a lot of
applications in practice such as Radio Navigation,
Emergency Aid and intelligent operations, etc...
Recently, wideband or ultra-wideband signals are
widely used in wireless localization system in both
civil and military areas such as radar, sonar or car
collision warning system, Wireless Sensor Network
[1-3]… To estimate the DOA of wideband signal,
many methods have been proposed [4-7]. They can be
divided into three orientations: system architecture
development and research on DOA estimation
algorithms or hybrid of the two.
In [9-10], Matrix Pencil (MP) algorithm was
proposed as a high – resolution technique for DOA
estimation. In this algorithm, the independent data
samples are directly processed. This fact helps the MP
to be less processing power and faster executing in
comparison with the other super – resolution methods
for DOA estimation which generally must calculate
the signal covariance matrix such as MUSIC [4],
ESPRIT [7]. One of the most remarkable advantages
of this technique is that it can extract the DOA
information with one snapshot.
The Total Forward – Backward Matrix Pencil
(TFBMP) algorithm is an extension of the Matrix
Pencil Method. The Total Forward – Backward is the
pre – processing technique to break the correlative
property of the received signals. Therefore, the DOA
information of the coherent incoming signals can be
accurately calculated [11]. In [12], TFBMP was used
for the high – resolution frequency estimator with the
better estimation results than the other methods such
as Fourier technique.
Uniform Linear Antenna Array (ULA) model
can be described as a set of M isotropic antenna
elements spaced at a uniform interval along some
line in space. This is one of the most convenient
mathematical models for array processing especially
in Radio Direction Finding systems due to its
simplicity and regularity. However, with ULA model,
the number of radio incoming signals which can be
detected and estimated the DOA information by RDF
system always must be less than M. In order to
overcome this restriction, in [8], the author proposed a
novel array structure called Nested Antenna Array
(NAA). This is a variant of an ULA model which can
increase degrees of freedom by vectorizing the
In this paper, a novel method to estimate the
DOA of ultra – wideband incoming signals using
NAA based on TFBMP algorithm is investigated. The
performance of this method will be assessed in many
cases that depend on the characteristics of incoming
signals as well as antenna array properties.
The paper is organized as follows. Section II
describes the structure of the NAA. In section III, we
present in detail the ultra-wideband signals model and
TFBMP technique for DOAs of those signals. The
*
Corresponding author: Tel: (+84) 918823638
Email:
39
Journal of Science & Technology 136 (2019) 039-043
simulation results are shown in the section IV. The
conclusion is given in the section V.
Assuming the array manifolds of different DOAs
are independent. In other words, array manifolds
with
different DOAs should span a
dimensional subspace. Moreover, considering the
number of signal sources is either known or can be
estimated. The bandwidths of the wideband sources
need not be identical, but there should be some
frequency band [ , ] where
and
are
minimum and maximum angular frequency of
wideband signal spectrum, respectively. In order to
ensure the Fourier transform of the output signal at
each antenna element has a good resolution, we
suppose the observation time is long enough. Then
the DFT of the
element output is
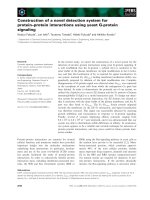
2. Nested Antenna Array Architecture
( )=∑
Fig. 1. Nested Antenna array in the coordinate
system
(
( )
( )
(2)
, ) ( )+ (
= 0, 1 …
),
1
(3)
is number of bins and
(
)=[
(
)
(
) …
(
)=[
(
)
(
) …
(
(
)]
(4)
)] ,
(5)
in which " " denotes transpose matrix,
<
<
with = 0,1, …
1 , ( , ) is the ×
steering matrix:
In practice, there are several radio signals
crossing the antenna array simultaneously. The
received signal at each antenna element will be the
sum of all arriving radio signals. In case of signals
approaching the array from some azimuth
directions
, …
, according to [7-9], the
wideband signal received at the
antenna element
can be modeled as
+
)= (
where
Assume that the incoming signal at the far field
of the array impinging on the ULA has DOA
information in both elevation ( ) and azimuth ( ) as
shown in Fig.1. However, in this work, only the
signal in the same plane with antenna array is
concerned. This means that the DOA of signal of
interest is estimated in azimuth and ( ) = 90 .
.
+
Equation (2) describes the received wideband
signals at each antenna element in frequency domain.
In order to estimate the DOA information, this signal
is split into several narrowband bins using filter banks
or the DFT technique. If the intersection of the
frequency bands of all incoming signals is [ , ],
then the output of the filter bank or DFT module can
be written in frequency vector form as follows:
In our research, we utilize an
– element
Nested Antenna Array (NAA) which is a variant of
ULA. Basically, NAA is composed by two ULAs that
are hooked together. Two ULAs are called inner and
outer array, respectively, in which the inner ULA
includes
antenna elements with spacing
and
outer ULA has
elements with spacing
=
( + 1) . The reference point is defined as the
origin of the three – dimensional Cartesian coordinate
system shown in Fig.1.
( )=∑
( )
( , )
=[ ( ,
)
(
) …
,
(
,
)]
(6)
The columns of the matrix are the × 1 array
manifolds ( , ) at frequency
. The array
manifold is defined as
(
,
)
= 1
(1)
where = 0,1, … ,
incoming signal.
where ( ) is the
incoming signal; ( ) is noise
at the
antenna element, which is assumed to be
uncorrelated with the signal sources and is white
noise in both temporal and spatial domain; = ,
in which
is the distance between the
element
and the reference point, and is the speed of the
signal propagation.
(7)
…
and
is the DOA of the
3. DOA estimation based on TFBMP
In case of ULA model, the array manifold as in
Eq.7 is Vandemonde in form. The DOA of incoming
signal can be estimated by a lot of methods. However,
in the NAA model, the form of manifold vector does
not have Vandemonde form due to the varying
distance between antenna elements (
≠
).
40
Journal of Science & Technology 136 (2019) 039-043
≤
Therefore, the DOA information cannot be directly
calculated using TFBMP [13]. In order to do that, the
vector manifold as in Eq.7 have to be transformed
into basic Vandemonde form using Kronecker (KR)
product [14]. By using this product, a new full rank
matrix is constructed as
=
⊙
(8)
where
denotes the KR product,
conjugate of .
(
+ 1)
,
=
(
where
,
( )=∑
( )
+
( )
(11)
X1
X2
...
XL
XL
... X L 1
...
...
... X M 1 ( M L ) x ( L 1)
.
+
=
(15)
+
(16)
and
are (
) × matrices, =
2 ), + 1;
and
are × matrix;
are obtained from .
where
((2
and
Step 4 – Extract DOA information: in order to
get DOA information, must be calculated. It can be
extracted from matrix . By deleting the last and the
first
columns from
, two matrices
and
are created, respectively. After that, the matrix
will be established, in which
is Moore –
Penrose pseudo – inverse of
as
=(
( )
)
(17)
is a × matrix. This matrix has the
eigenvalues which is the value of . Therefore, by
using the values of the generalized eigenvalues of
, angles of arrival can be estimated as
–
X0
X
1
Ym
...
X M L 1
(14)
)
Step 3 – Decompose all data matrix – : based
on Eq. 15 and SVD operation,
can be represented
as follow:
According to [15,18], the DOA information
could be extracted by using TFBMP with the
following steps.
Step 1 – Compute the Hankel matrix of
)×(
=
Therefore, instead of using ,
will be used
to determine the DOA information. After applying
Eq.8 to Eq.6, the Eq.7 has been transformed in to
=
:
is complex conjugate matrix of
(10)
Vandemonde form. In
bin, let
Equation (2) can be rewritten as
(13)
is odd
In this step,
is performed SVD to obtain
signal and noise subspace –
and , respectively.
(9)
÷
K + 1, if
=
The position of each element is defined as
=
is even.
Step 2 – Compute all data matrix –
is complex
1
, if
≤L≤M
can be considered as a steering matrix of a
virtual antenna array created from NAA. This array is
similar to the ULA where the number of elements is
= 2
≤
...
(12)
=
2
( )
where ( ( )) is the imaginary part of
(18)
( ).
where
is the Pencil parameter. Because of the
efficient noise filtering issue described in [10], is
chosen with the conditions as:
Table 1. The DOAs (Degrees) estimated in each narrow bin
Bin 8
Bin 9
Bin 10
Bin 11
-50.0178
Bin 1
-50.0081 -49.8702 -49.8298 -49.7394 -50.2243 -50.1369
Bin 2
Bin 3
Bin 4
Bin 5
Bin 6
Bin 7
-49.7431
-49.7544
-50.2252
-50.2467
-20.0797
-19.8219 -20.1454 -19.8356 -19.8324 -20.3086 -20.0676
-20.1617
-19.8637
-19.856
-19.8735
-4.20666
-5.02361 -4.83493 -4.83376 -5.38063 -4.96236 -4.71186
-5.19552
-5.37901
-4.86456
-4.685
0.771525
-0.22281 -0.07285 0.185544 -0.33092 0.273637 0.178447
-0.21928
-0.25914
0.270418 0.306662
10.20457 9.850208 10.17114 10.11359 9.910392 10.15309 10.10738 9.988073
9.972345
9.986968 10.05102
45.15433 44.64176 44.9434
44.9559 45.12949 45.00409 44.84692
44.99299
45.15949 45.06566
59.97074 59.51571 59.92597 60.15467 59.77095 60.11518 60.24357 59.63743
60.16791
60.0365
83.2818
85.79736
85.14746 87.14824
44.909
83.51892 86.54906 86.99451 84.67087 85.56649 86.04664 84.72545
41
60.3525
Journal of Science & Technology 136 (2019) 039-043
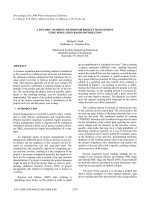
number of DOAs than number of antenna elements.
Obviously, it is a considerable advantage of NAA in
comparison with ordinary antenna array such as ULA
and UCA where the number of DOA must be smaller
than the number of antenna element. Moreover, it can
be seen that DOA information can be extracted with
only one snapshot. This is the most significant
advantages of TFBMP that other methods such as
MUSIC, ESPRIT… cannot do.
4. Simulation results
The proposed method is simulated using Matlab
to examine its performance in DOA estimation. In
this paper, it is assumed that the incoming signals are
far field wideband signals are based on IEEE
802.15.4a standard [19] and they can be divided into
11 bins (
= 11 ), in which
= 5.944
and
= 10.234
are the minimum and maximum
frequency of wideband signal spectrum, respectively.
Moreover, they are also assumed as a sum of complex
exponentials as follow
( )= ( )
exp{ (2
+
)}
(19)
where the amplitude ( ) is a Rayleigh random
variable; the phase
is uniformly distributed in
[
÷ ] and
is the number of frequency
components of wideband incoming signal.
In this research, a 6 – elements Nested antenna
array ( = 6), in which
= 3 and
= 3, element
spacing of inner array
= 0.5
, where
=
with
is the maximum frequency of all bins
Fig. 2. DOA estimation result of eight incoming
signals with only one snapshot
and the Pencil parameter is chosen = 9. In order to
evaluate the accuracy of the algorithm, the Root Mean
Square Error (RMSE) is used. RMSE can be defined
as
=
∑
,
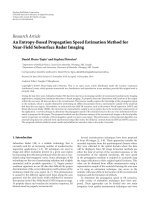
Simulation result shown in Fig.3 presents the
influence of the number of snapshots on the
performance of this algorithm. Clearly, when the
number of snapshots are increased, the accuracy of
this method increases. However, it can be seen that
when the number of snapshot is more than 50, change
in accuracy of the algorithm is trivial. Furthermore,
the computation time will significantly increases
when the number of snapshot increases. Therefore, it
should be taken into account the trade-off between the
computation time and the accuracy of the algorithm.
(20)
where is the expected value and , is the estimated
value of measurement object
and is the number
of measurement objects. In our research, the
measurement object is the DOA information.
In the first simulation, the proposed RDF system
is executed to estimate the DOAs of eight incoming
signals at 50 , 20 , 5 , 0 , 10 , 45 , 60 , 85 in
the AWGN channel with
= 3
. The
simulation results in each bin are presented in the
table 1. This table shows that the DOAs are estimated
accurately for all bins. And in order to get the best
result, the average value in each row is calculated and
chosen as the final estimated DOA information.
However, DOA estimation results are the
numerical values as in Eq.18, therefore, in order to
demonstrate visually the results, estimated DOA
values will be illustrated in XOY plane, in which the
X – Axis is the DOA of incoming signal and the Y –
Axis is the indicating factor. This factor is set to 1
corresponding to the estimated DOA in X - Axis. The
estimated result is shown in Fig.2. This figure
indicates that all DOA of eight incoming signals have
been successfully determined with very small error.
Thus, the DF system is able to estimate a larger
Fig. 3. Impact of number of snapshots on DOA
estimation accuracy
Figure 4 depicts the performance of system in the
AWGN channel with the variable SNRs from 10dB
to 30dB with one snapshot. The RMSE is presented to
prove the accuracy of system performance. It is quite
42
Journal of Science & Technology 136 (2019) 039-043
Transactions on Signal Processing, vol. 59, pp. 42564270.
good in white noise environment although with one
snapshot.
[6] Yoon Y.-S., Kaplan L. M., and McClellan J. H, (2006)
TOPS: new DOA estimator for wideband signals,
IEEE Transactions on Signal Processing, vol. 54 , pp.
1977-1989.
[7] Ottersten B. and Kailath T. Direction-of-arrival
estimation for wide-band signals using the ESPRIT
algorithm, IEEE Transactions on Acoustics, Speech
and Signal Processing, vol. 38 (1990), pp. 317-327.
[8] Pal, P., & Vaidyanathan, P. P. (2010), Nested arrays: A
novel approach to array processing with enhanced
degrees of freedom, IEEE Transactions on Signal
Processing, 58(8), 4167-4181.
[9] Hua Y. and Sarkar T. K, (1990) Matrix pencil method
Fig. 4. DOA estimation accuracy in AWGN channel
with varying SNR
for
estimating
parameters
of
exponentially
damped/undamped sinusoids in noise, IEEE
Transactions on Acoustics, Speech and Signal
Processing, vol. 38 , pp. 814-824.
5. Conclusions
In this paper, a novel RDF system for wideband
signal using NAA and TFBMP method is proposed.
The power of this system is that it can produce
exactly DOA information of incoming wideband
signals which are more than the number of antenna
element with only one snapshot. By this way, the
proposed system will reduce quantity of antenna
element in comparison with other systems. Moreover,
with one snapshot, the wideband RF signal can be
directly converted to digital domain by highpass
sampling. Therefore, the proposed system can be
implemented for real time all digital RDF system.
[10] Koh J. and Sarkar T. K. (2004), High resolution DOA
estimation using matrix pencil, in IEEE Antennas and
Propagation Society International Symposium, pp.
423-426.
[11] Pillai S. U. and Kwon B. H, (1989) Forward/backward
spatial smoothing techniques for coherent signal
identification, IEEE Transactions on Acoustics, Speech
and Signal Processing, vol. 37, pp. 8-15.
[12] Del Rı́ J. E. F. and Sarkar T. K., (1996) Comparison
between the matrix pencil method and the Fourier
transform technique for high-resolution spectral
estimation, Digital Signal Processing, vol. 6, pp. 108125.
References
[1] Xie, Fei, Wenying Liu, and Jianhua Wang. Research
[13] Han Trong Thanh, Vu Van Yem, Nguyen Duy Minh
on Vehicle Active Anti-Collision Warning System"
2015 International Conference on Electromechanical
Control Technology and Transportation. Atlantis Press,
2015.
and Hoang Duc Thang, (2014) Direction of Arrival
estimation using the Total Forward - Backward Matrix
Pencil Method, International Conference on
Communications and Electronics (ICCE 2014),
Vietnam, pp.718 - 722.
[2] V. Tran-Quang, P. Nguyen Huu, and T. Miyoshi,
[14] W.-K. Ma, T.-H. Hsieh, and C.-Y. Chi, DOA
Adaptive transmission range assignment algorithm for
in-routing image compression on wireless sensor
networks, 3rd Int’l Conf. Commun. Electron (ICCE),
Nha Trang, Vietnam, Aug. 2010.
estimation of quasistationary signals via Khatri-Rao
subspace, in Proc. Int. Conf. Acoust., Speech Signal
Process. (ICASSP), Apr. 2009, pp. 2165–2168.
[3] P. Nguyen Huu, V. Tran-Quang, and T.Miyoshi,
Multi-hop Reed-Solomon encoding scheme for image
transmission on wireless sensor networks, 4th Int’l
Conf. Commun. Electron. (ICCE), Hue, Vietnam, pp.
74-79, Aug. 2012
[4] Hirata A., Morimoto T., and Kawasaki Z. DOA
estimation of ultra-wideband EM waves with MUSIC
and interferometry, IEEE antennas and wireless
propagation letters, vol.2 (2003), pp. 190-193.
[5] Liu Z.-M., Huang Z.-T., and Zhou Y.-Y, (2011),
Direction-of-arrival estimation of wideband signals via
covariance matrix sparse representation, IEEE
43