Heavy metal accrual in soils and crops grown in the peri urban areas of Jabalpur district of Madhya Pradesh, India using geospatial techniques
Bạn đang xem bản rút gọn của tài liệu. Xem và tải ngay bản đầy đủ của tài liệu tại đây (1.22 MB, 27 trang )
Int.J.Curr.Microbiol.App.Sci (2019) 8(2): 64-90
International Journal of Current Microbiology and Applied Sciences
ISSN: 2319-7706 Volume 8 Number 02 (2019)
Journal homepage:
Original Research Article
/>
Heavy Metal Accrual in Soils and Crops Grown in the Peri Urban Areas of
Jabalpur District of Madhya Pradesh, India using Geospatial Techniques
Balram Patel, Y. M. Sharma, G.S. Tagore*, G.D. Sharma and G. Halecha
Department of Soil Science and Agricultural Chemistry
Jawaharlal Nehru Krishi Vishwa Vidyalaya, Jabalpur, Madhya Pradesh, India
*Corresponding author
ABSTRACT
Keywords
Heavy metal,
Wastewater,
Transfer factor
clustering, GIS,
Peri urban areas of
Jabalpur
Article Info
Accepted:
04 January 2019
Available Online:
10 February 2019
The findings of present study suggested that the pH in soils neutral to slightly alkaline safe
in electrical conductivity and low to medium in organic carbon content. Metals
concentration was below the permissible limits at 200,400,600 and 800 m, from both side
of Omati Nala, in rainy and winter seasons, respectively. In water, pH ranged from 6.5 to
8.5 and EC under permissible range. However, Pb and Cr were comparatively higher than
the Indian permissible limits. The concentration of Ni, Cr and Cd in rice, wheat and Brinjal
was higher than the limit given by WHO/Indian standard. The transfer factor was recorded
for these metals in order of Brinjal, followed by the Spinach and Tomato. Result revealed
that, the pH had negatively correlated with OC (r=-0.252*) and Cr (r=-0.413**) in rainy
season and similar relationship with EC(r=-0.601**), OC (r=-0.356**), Cd (r=-0.696**)
and Pb (r=-0.619**) in winter season. While, it had significant positive relationship with
Cr (r=0.304**). In winter season, the EC had positive and significant relationship with OC
(r=0.239*), Cd (r=0.366**) and Pb (r=0.420**). In rainy and winter seasons, the OC
showed significant positive relationship with Ni (r=0.305**), Cd (r=0.279*) and Pb
(r=0.232*) and Cd (r=0.333**) and Pb (r=0.240*) respectively. The Cd in soil showed
significant and positively related with Ni and Cd content in plant. Multivariate analysis
results revealed that, the variables are correlated with two principal components in which
64.61 and 66.89% of the total variance were extracted in rainy and winter seasons
respectively. The first component with 40.56 and 43.56 % of variance comprises Ni Cd
and Pb and pH, EC, OC, Cd and Pb with high loadings whereas; the second component
contributes pH, EC, OC and Cr and Ni and Cr at 24.04 and 23.32% total variance in rainy
and winter seasons, respectively. Clustering result grouped all sampling sites into nine and
seven zones on the basis of spatial similarities among sites and differences among different
groups in rainy and winter seasons, respectively. In rainy season, 1, 2, 3 and 4 zones were
containing higher heavy metal concentrations than the zone 5,6,7,8 and 9 whereas in
winter season, zone 1, 2, 3, 5 and 6 had higher concentrations of metals than the zone 4
and 7.
64
Int.J.Curr.Microbiol.App.Sci (2019) 8(2): 64-90
industries that are released in form of
untreated industrial effluents (Lin et al.,
2002). Heavy metals present in industrial
waste migrate via different sources e.g. water,
soil sediments and air to nearby agricultural
lands and thus become a source of heavy
metal pollution in agricultural soils (De Vries
et al., 2005).
Introduction
The accumulation of heavy metals in
agricultural soils is of increasing concern due
to the food safety issues and potential health
risks as well as its detrimental effects on soil
ecosystems (Qishlaqi and Moore, 2007).
These metals have peculiar characteristics one
of they do not decay with time; they can be
necessary or beneficial to plants at certain
levels but can be toxic when exceeding
specific thresholds; they are always present at
a background level of non-anthropogenic
origin, their input in soils being related to
weathering of parent rocks and pedogenesis
and they often occur as cations which strongly
interact with the soil matrix, consequently,
heavy metals in soils can become mobile as a
result of changing environmental conditions.
This situation is referred to as “chemical
timing bomb” (Facchinelli et al., 2001).
Heavy metal contamination of soil is a far
more serious problem than air or water
pollution because heavy metals are usually
tightly bound by the organic components in
the surface layers of the soil. Consequently,
the soil is an important geochemical sink
which accumulates heavy metals quickly and
usually depletes them very slowly by leaching
into groundwater aquifers or bioaccumulating
into plants (Infotox, 2000). Heavy metals can
also be very quickly translocated through the
environment by erosion of the soil particles to
which they may adsorbed or bound and redeposited elsewhere. Irrigation of agricultural
land with wastewater leads to the
accumulation of heavy metals in soil
(Chandra and Kulsheshtha, 2004; Tung et al.,
2009; Jan et al., 2010). Once deposited on the
soil certain metals such lead and chromium
may be virtually permanent (Okeyode and
Moshood, 2010).
Sources of these elements in soils mainly
include natural occurrence derived from
parent materials and human activities. The
most important sources of heavy metals in the
environment are the anthropogenic activities
such as mining, smelting procedures, steel
and iron industry, chemical industry, traffic,
agriculture as well as domestic activities
(Stihi et al., 2006;Jantschi et al., 2008).
Chemical and metallurgical industries are the
most important sources of heavy metals in
soils (Schutze et al., 2007; Jantschi et al.,
2008; Pantelica et al., 2008). Many reports
have clearly documented the various human
activities as a major cause for heavy metal
contamination of the soil ecosystem which
include mining processes, iron and steel
industries, transportation, open disposal of
waste, and use of inorganic fertilizers,
pesticides on to the agricultural lands (Lado et
al., 2008). Heavy metals contamination is
more dominating in agricultural fields near by
industrial areas because of large consumption
of acidifying compounds and metal ores in
Heavy metal pollution of soil enhance plant
uptake causing accumulation in plant tissues
and eventual phytotoxicity and change in
plant community (Gimmler et al., 2002).
Heavy metals such as Pb, Cd, Cu, and Zn
have been reported to be released into the
atmosphere during different operations of the
road transport (Atayese et al., 2008; Sharma
and Prasade, 2010; Zhang et al., 2012). Zhang
et al., (2012) reported engine oil consumption
as the largest emission for Cd, tyres wear for
Zn, and brake wear for Cu and Pb. Soil,
vegetation and animals including man act as
„sinks‟ for atmospheric pollutants (Osibanjo
and Ajayi, 1980). Heavy metals are that either
65
Int.J.Curr.Microbiol.App.Sci (2019) 8(2): 64-90
leach into ground or surface water and enter
into the growing food crops (Janos et al.,
2010). From here, they migrate in to the food
chain by direct or indirect usage of respective
crops. Although some heavy metals like Cu,
Fe, Mn, Zn are required for growth of plants
in trace amounts, but prove fatal if present
beyond their maximum permissible limits
(Freitas et al., 2010). Various heavy metals
viz., arsenic, cadmium, copper, cobalt, lead,
manganese, mercury, nickel and zinc are
reported to cause genotoxicity upon reaching
the living systems (Suciu et al., 2001;
Chandra et al., 2005; Bertin et al., 2006).
Organic matter and pH are the most important
parameters controlling the accumulation and
the availability of heavy metals in soil
environment (Nyanangara and Mzezewa,
1999). It is necessary then to evaluate the
relationship among these parameters and
heavy metal accumulation in soil.
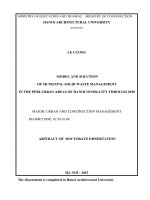
meter above the mean sea level (MSL). Its
present population is above 2 million (Fig. 1).
Two decades back it was 7, 00,000. Rapid
increase in population and change in life style
have resulted in a dramatic increase in the
generation of waste. Collection, transportation
and handling of the waste must also be
properly dealt with, if not, the waste creates a
number of problems, many of which are
related to human health and environment.
Collection of wastewater, soil and plant
samples
Twenty water samples (20+20=40) were
collected along Omti Nala in rainy and winter
seasons. GPS based (80+80=160) soil and
(20+20=40) plant samples were collected at
200, 400, 600 and 800 m distances both sides
of Omti Nala in rainy and winter seasons,
respectively. These samples were analyzed
for heavy metal concentration using AAS.
Statistical analysis was carried out using
SPSS 16.0 software. Maps were generated
using Arc GIS 10.2 software. During the
course of investigation various observations
were taken viz,
Heavy metal concentration in the soil solution
plays an important role in controlling metal
bioavailability to plants. The accumulation of
heavy metals in crop plants is of great
concern due to the probability of food
contamination through the soil root interface.
Though the heavy metal like, Cd and Pb are
not essential for plant growth, they are readily
taken up and accumulated by plants in toxic
forms. Ingestion of vegetables irrigated with
waste water and grown in soils contaminated
with heavy metals possesses a possible risk to
human health and wildlife. Presently, due to
constraint in availability of fresh water for
irrigation, waste water is being used for
irrigation of agricultural fields resulting toxic
metal contamination.
Water samples that were used for irrigation
practices were collected from each site in pre
cleaned high-density polyethylene bottles.
These bottles were rinsed earlier with a metalfree soap and then soaked in 10% HNO3
overnight, and finally washed with deionised
water. The heavy metals in water were
determined
by
Atomic
Absorption
Spectrophotometer.
Soil sampling, processing
chemical analysis
and
their
Materials and Methods
Non soil particles e.g. stones, wooden pieces,
rocks, gravels, organic debris were removed
from soil. Soil was oven dried and this dried
soil was sieved through a 2 mm sieve and
stored in the labelled polythene sampling
Description of study area
Jabalpur is situated at 23.90° N latitude and
79.58° E longitude at an altitude of 411.78
66
Int.J.Curr.Microbiol.App.Sci (2019) 8(2): 64-90
bags. The pH was determined in 1: 2.5 soilwater suspensions using digital pH meter
(Jackson, 1973). The electrical conductivity
of the 1: 2.5 soil- water extract was measured
using solu bridge (Jackson, 1973). The
organic carbon was determined by rapid
titration method as described by Walkley and
Black (1934). The DTPA (pH 7.3) extractable
Cr, Ni, Cd, and Pb extracted by 0.005 M
DTPA, 0.01 M CaCl2 and 0.1 M Triethanol
amine (TEA) and analyzed on atomic
absorption spectrometer (Norvell and
Lindsay, 1978).
Plant sampling, processing and
chemical analysis
To investigate whether there are differences
in the heavy metal concentrations between the
two sites, discriminate analysis was used. The
results of this analysis were assessed by
examining the canonical correlation statistics,
the Wilk‟s lambda, the significance level and
the percentage of original group cases
correctly classified. In order to quantitatively
analyze and confirm the relationship among
soil properties (pH and OC) and heavy metal
content, a Pearson‟s correlation analysis was
applied to dataset.
PCA was adopted to assist the interpretation
of elemental data. This powerful method
allows identifying the different groups of
metals that correlate and thus can be
considered as having a similar behavior and
common origin. The theoretical aspects of
these statistical methods have been described
in advanced statistical literatures. It should be
noted that parametric statistical tests require
the data to be normally distributed. Therefore,
it was checked if the data came from a
population with normal distribution by
applying Shapiro-Wilk‟s test (significance
level, = 0.05). The non-normal data were
transferred logarithmically to ensure normal
distribution. All the statistical analysis were
performed using SPSS for Windows (release
Ver.11, Inc, Chicago, IL) and spatio-temporal
maps of physio-chemical and heavy metals in
soils were prepared using GIS open sources
software.
their
A diversity of crops and vegetables are grown
in the study area; Rice, Wheat and vegetables
were collected from each site of the sampling
zone and stored in labelled polythene
sampling bags.
Chemical analysis of plant
Weigh 1 g plant sample in a conical flask
(corning, 100 ml capacity). Add 10 to 12 ml
of di acid mixture (1 part perchloric + 3 part
nitric acid) and digested the mixture on hot
plate till the residue was colourless samples
were then taken off, cooled diluted with
distilled water and filtered through Whatman
No.1 filter paper. Made up the volume of
digested to 50 ml, Read for heavy metals
content
on
atomic
absorption
spectrophotometer (AAS).
Results and Discussion
Soil to plant metal transfer was computed as
transfer factor (TF), which was calculated by
using the equation
Concentration of heavy metals in water
The irrigation water was neutral in reaction
with pH values ranged from 6.50 to 8.50 with
mean value of 7.77 and 7.52 to 8.81 with an
average value of 8.16 in rainy and winter
season,
respectively.
The
electrical
conductivity (EC) value of water ranged from
0.59 to 0.78 dSm-1 with mean value of 0.69
TF = CPlant / DTPA CSoil
Where, CPlant is the concentration of heavy
metals in plants and DTPA CSoilis the Di
ethylene thiamine penta acetic acid
concentration of heavy metals in soil.
67
Int.J.Curr.Microbiol.App.Sci (2019) 8(2): 64-90
dSm-1 and 0.67 to 0.93 dSm-1 with mean
value of 0.77 dSm-1 in rainy and winter
season, respectively. The concentration of Ni
in waste water ranged from 0.000 to 0.014
and 0.001 to 0.025 with an average value of
0.001 and 0.010 mgL-1 in rainy and winter
seasons, respectively. The concentration of Cr
in waste water ranged from 0.015 to 4.171
and 0.004 to 0.058 with an average value of
0.787 and 0.028 mgL-1 in rainy and winter
seasons, respectively. The concentrations of
Cd in waste water were negligible in rainy
and winter seasons, respectively. However,
the concentrations of Pb in waste water
ranged from 0.00 to 0.26 and 0.001 to 0.050
with an average value of 0.100 and
0.009mgL-1 in rainy and winter seasons,
respectively. The permissible limit suggested
by WHO and Indian standard by Awasthi
(2000) were 0.2 and 1.4 mgL-1, 0.1 and 0.05
mg L-1, 0.05 and 0.01 mg L-1 and 0.01 and
0.10 mgL-1 for Ni, Cr, Cd and Pb,
respectively.
of organic matter, season, average rainfall and
stream discharge level. For example Qadir et
al., 2008 reported that the highest
concentrations for EC, Pb and Cd were
recorded during winter season which
gradually reduced from spring season to
monsoon. Whereas during the rainfall Nala
will flow at high discharge level and dilute
the total contents and lower concentrations
are recorded. In the Jabalpur city, millions of
litres wastewater is generated per day that
drains into the Nala. Industrial and municipal
sewage of city are discharged in these
drainages, which is the main route of heavy
metal accumulation in wastewater (Wozniak
and Huang, 1982). Jayaprakash et al., (2010)
indicated that the marshy region is more
heavily contaminated with Cd, Hg, Cr, Cu,
Ni, Pb, and Zn than other regions on the
southeast coast of India. A study had also
revealed the dominance of heavy metals
present in Pallikaranai wetland following the
sequence:
Pb>Cr>Fe>Ni>Zn>Cd>Cu
(Ramachandran et al., 2012). In addition, the
presence of heavy metals like lead, cadmium,
zinc, cobalt, chromium etc. in the
environment associated with industrial areas
of Ranipet and Vellore are well accounted by
many research papers (Mahesh and Selvaraj,
2008; Gowd and Govil, 2008; Saraswathy et
al., 2010; Ambiga and Annadurai, 2013).
Similarly results were also reported by Kar et
al., 2008 and Rana et al., 2010)
The pH ranged from 6.0 to 7.0 is normally
considered to be the most desirable for
irrigation water. However, our results
indicating slightly alkaline water, this may be
due to the presence of carbonate and
bicarbonate. The EC provides a rapid and
convenient means for estimating the
concentration of electrolytes and gives
information about all the dissolved minerals
(Ahmed et al., 2002). BIS <0.25 dSm-1 in
considered good and >0.75 dSm-1 is
unsuitable for irrigation. The higher EC
causes inhabits of the plant to compete with
ion in soil solution for water, thus less is
available to crop plants, usable plant water in
soil solution decreases dramatically as EC
increases. In water which is being used for
irrigation in the cultivation of food crops
particularly vegetables, the concentration of
Pb and Cr was higher compared with the
Indian permissible limits (Awashthi, 2000).
Certain factors that may affect total contents
Status of metals in soil
In rainy and winter seasons, the pH in soils
ranged from 6.44 to 8.30 with mean value of
7.71 and 6.38 to 8.25 with mean value of
7.51, respectively. The EC in soil ranged from
0.07 to 0.97 with mean value of 0.17 and 0.11
to 0.68 dSm-1 with mean value of 0.27 dSm-1
in rainy and winter seasons, respectively. The
organic carbon content in soils ranged from
1.20 to 6.76 g kg-1 with mean value of 4.02
and 1.26 to 8.57 g kg-1 with mean value of
68
Int.J.Curr.Microbiol.App.Sci (2019) 8(2): 64-90
4.69 g kg-1 in rainy and winter seasons,
respectively. Data revealed that the status of
organic carbon content was low to medium
soil samples collected from both side of Omti
Nala of Jabalpur city.
1% and typically less than 0.5%. In present
study, the metals concentration was below the
permissible limits of the EU standard
(European Union, 2002) and Indian standards
(Awashthi, 2000). Continuous removal of
metals by food crops (vegetables and cereals)
grown at the wastewater irrigated soil and
heavy metals leaching into the deeper layers
of soil may be a reason of low concentration
of heavy metals than the permissible limits
(Singh et al., 2010). Similarly results were
also reported by Tiwari et al., (2011) and
Nazir et al., (2015).
The Ni concentration in soils ranged from
0.35 to 1.55 mgkg-1 with an average value of
0.63 and 0.00 to 2.83 mgkg-1 with an average
value of 0.97 mgkg-1 in rainy and winter
seasons, respectively. The Cr concentration in
soils varied from 0.00 to 0.88 with mean
value of 0.39 and 0.00 to 2.01 mgkg-1 with
mean value of 0.16 mgkg-1 in rainy and winter
seasons, respectively. The values of Cd in
soils varied from 0.01 to 0.65 and 0.00 to
1.13mgkg-1 with an average value of 0.13 and
0.30 in rainy and winter seasons, respectively.
The Pb accumulation in soils ranged from
0.56 to 7.24 mgkg-1 with mean value of 3.40
and 0.00 to 16.00 mgkg-1 with mean value of
5.98 mgkg-1 in rainy and winter seasons,
respectively. The mean data showed that the
observed value of Ni, Cr, Cd and Pb in soil in
both seasons was below than the permissible
limit set by WHO and Indian standard.
ANOVA result showed that the physicochemical properties and heavy metals
concentration in soil were significant differed
in rainy and winter seasons.
Physic-chemical properties of soil from
both sides of Omti Nala at 200,400,600 and
800 m distances in both seasons
In rainy season the pH in soils ranged from
6.85 to 8.28, 6.87 to 8.30, 6.44 to 8.15 and
6.88 to 8.24 with mean values of 7.78, 7.71,
7.63 and 7.68 at 200,400,600 and 800 m
distances, respectively. However, 6.38 to
8.21, 6.75 to 8.25, 6.65 to 8.25 and 6.67 to
8.22 with mean value of 7.52, 7.52, 7.48 and
7.53 at 200,400,600 and 800 m, respectively
in winter season. In rainy season the EC in
soil ranged from 0.08 to 0.35, 0.08 to 0.97,
0.08 to 0.35 and 0.07 to 0.86 dSm-1 with mean
values of 0.15, 0.20, 0.14 and 0.19 dSm-1 at
200,400,600 and 800 m, respectively.
However, 011 to 0.68, 0.15 to 0.47, 0.13 to
0.53 and 0.11to 0.61 dSm-1 with mean values
of 027, 0.24, 0.28 and 0.26 dSm-1 at 200,
400,600 and 800 m, respectively in winter
season. In rainy season the OC in soil ranged
from 1.61 to 6.45, 2.08 to 5.79, 1.31 to 5.93
and 1.20 to 6.76 gkg-1 with mean values of
4.04, 4.11, 3.77 and 4.15 gkg-1 at 200,400,600
and 800 m, respectively. However, 1.68 to
8.57, 1.26 to 7.81, 1.46 to 8.57 and 1.95 to
7.60 g kg-1 with mean value of 4.81, 4.64,
5.00 and 4.33 gkg-1 at 200, 400, 600 and 800
m, respectively, in winter season. ANOVA
result were also indicated that the pH, EC and
OC content in soil were not significant
Soils of study area are neutral to slightly
alkaline in reaction. This may be due to the
reaction of carbonates with other elements
present in soil. These results are substantiate
by Godoy-Faundez, et al., (2008). Criteria
given by Muhr et al., (1965) low conductivity
indicating that salinity is not at all a problem
(Singh, 2012). The low to medium status of
organic carbon content might be due to
unbalanced fertilization, high summer
temperature and good aeration in the soil,
resulting in rapid decomposition of it. Swarup
et al., (2000) and Sharma et al., (2004) who
reported that the amount of SOC in soils of
India is relatively low, ranging from 0.1 to
69
Int.J.Curr.Microbiol.App.Sci (2019) 8(2): 64-90
differed with the increasing distance from the
Omti nala in rainy and winter seasons.
formation of these soils from basaltic parent
material rich in basic cations. Similar findings
were reported by Jibhakate et al., (2009).
Mandal et al., (2007) observed that crop
species and cropping systems that may also
play an important role in maintaining SOC
stock because both quantity and quality of
their residues that are returned to the soils
vary greatly affecting their turnover or
residence time in soil and thus its quality. Soil
type and plant community significantly
affected the SOC (Yang et al., 2014).Lower
content of heavy metals in black soils is due
to its fixation by clay due to high soil pH
values which have resulted in the formation of
insoluble compounds (Tandon 1995).
Similarly results were also reported by
Ekmekyapar et al., (2012).
Heavy metals accumulation in soils
The Ni in soils ranged from 0.40 to 1.55, 0.45
to 1.02, 0.42 to 0.85 and 035 to 1.34 with
mean values of 0.66, 0.63, 0.60 and 0.64 at
200, 400, 600 and 800 m, respectively in
rainy season. However, 0.00 to 1.77, 0.00 to
2.02, 0.00 to 2.83 and 0.00 to 1.78 with mean
value of 0.99, 0.99, 1.03 and 0.95 at
200,400,600 and 800 m, respectively in
winter season. The Cr in soils ranged from
0.03 to 0.67, 0.00 to 0.74, 0.10 to 0.88 and
0.17 to 0.82 with mean values of 0.37, 0.39,
0.38 and 0.41 at 200, 400, 600 and 800 m,
respectively in rainy season. However, 0.00 to
0.37, 0.00 to 054, 0.00 to 2.01 and 0.00 to
0.31 with mean value of 0.14, 0.16, 0.22 and
0.12 at 200, 400, 600 and 800 m, respectively
in winter season. The Cd in soils ranged from
0.03 to 0.41, 0.05 to 0.65, 0.04 to 0.36 and
0.01 to 0.47 with mean values of 0.13, 0.13,
0.12 and 0.13 at 200,400,600 and 800 m,
respectively in rainy season. However, 0.00 to
1.13, 0.00 to 0.72, 0.00 to 0.81 and 0.00 to
0.71 with mean value of 0.34, 0.26, 0.35 and
0.25 at 200, 400, 600 and 800 m, respectively
in winter season. In winter season the Pb in
soils ranged from 1.68 to 7.24, 1.22 to 5.82,
1.44 to 6.76 and 0.56 to 6.18 with mean
values of 3.53, 3.33, 3.39 and 3.34 at
200,400,600 and 800 m, respectively in rainy
season. However, 0.00 to 15.00, 0.00 to
15.00, 0.00 to 16.00 and 0.00 to 13.00 with
mean value of 6.20, 5.75, 6.81 and 5.17 at
200, 400, 600 and 800 m, respectively.
ANOVA result showed that the metals
concentrations in soil were not significant
differed from the different distance from Omti
nala in rainy and winter seasons.
Concentration of
crops/vegetables
heavy
metal
in
On dry weight basis the concentration of Ni,
Cr, Cd and Pb in rice, ranged from 2.70
mgkg-1 (S-8) to 10.35 mgkg-1 (S-37); 7.00
mgkg-1 (S-67) to 18.70 mgkg-1 (S-45); 0.20
mgkg-1 (S-67) to 0.80 mgkg-1 (S-36) and 1.45
mgkg-1 (S-15) to 15.50 mgkg-1 (S-63) in rainy
season. In winter season, the concentration of
Ni, Cr, Cd and Pb in wheat (Triticum
aestivum), ranged from 2.70 mgkg-1 (S-8) to
10.35 mgkg-11(S-37); 7.00 mgkg-1(S-67) to
18.70 mgkg-1(S-45); 0.20 mgkg-1 (S-67) to
0.80 mgkg-1 (S-36) and 1.45 mgkg-1(S-15) to
15.50 mgkg-1 (S-63). The concentration of Ni,
Cr, Cd and Pb in Spinach (Spinacea
oleracea), 6.80 and 6.70, 9.15 and 13.50, 1.30
and 0.55 and 17.50 and 19.50 mgkg-1 in S-9
and S-80 sites, respectively in winter season.
The concentration of Ni, Cr, Cd and Pb in
sugar beet (Beta vulgaris), 7.15, 9.65, 0.80
and 11 mgkg-1 in S-42 site, respectively in
winter season. The concentration of Ni, Cr,
Cd and Pb in Tomato (Lycopresicon
esculantum), 4.53 and 7.70, 10.40 and 13.30,
0.75 and 0.85 and 0.95 and 12.50 mgkg-1 in S-
Data indicated that these soils are neutral to
alkaline in reaction, whereas EC of soil were
categorized as normal. It may also be due to
70
Int.J.Curr.Microbiol.App.Sci (2019) 8(2): 64-90
8 and S-40 sites, respectively in winter
season. The observed values of Ni Cr and Cd
were safe as permissible limit given by
WHO/Indian
standard.
However,
the
concentration of Pb was higher than the limit
given by WHO/Indian standard. The
concentration of Ni, Cr, Cd and Pb in Brinjal
(Solanum melongena), were 8.15, 11.85 and
15.90, 16.10, 19.10 and 29.10, 1.60, 1.80 and
2.10 and 16.50, 22.00 and 32.00 mgkg-1 at S11, S-17 and S-13, respectively in winter
season. The observed value of Ni was safe as
permissible limit given by WHO/Indian
standard. However, the concentration of Cr,
Cd and Pb were higher than the limit given by
WHO/Indian standard. In the present study,
metals concentrations in the all vegetables
were in the range of Indian safe limits
(Awashthi, 2000) except Pb which was
greater. However, concentration of Cr and Cd
were also exceeding the safe limits in Brinjal.
A variation in the metal concentration may be
due to the variable factors like heavy metal
concentration in soil; wastewater used for
irrigation, atmospheric deposition and plant‟s
capability to uptake and accumulates the
heavy metals (Pandey et al., 2012).
Wastewater used for the irrigation purposes
may route the uptake of heavy metals from
roots to the edible parts of the vegetables. It
was found that the leafy vegetables have a
higher concentration of heavy metals. Further,
in vicinity to the study area a number of
industries and automobiles emit their smoke
in the open air; the atmosphere of that area
remains smoky and this smoke contains
various toxic metals that may cause
atmospheric deposition of heavy metals on
the leaves of vegetables, which may be a
reason of higher concentration of heavy
metals in leafy vegetables (Khan et al., 2010).
Jan et al., (2010) and Akbar et al., (2009) also
indicated that the vegetables grown in
wastewater accumulate higher concentration
of heavy metals than those vegetables grown
at the ground water. Metal concentration and
uptake differed among the studied soils
among different plant species and may be
attributed, to the soil properties, such as
organic carbon, soil pH, clay and free Fe
contents. It is well documented that free Fe
oxides are the dominant soil constituents
responsible for metal sorption (Fendorf et al.,
1997), and soil organic matter can also adsorb
metals, thus reducing its availability (Redman
et al., 2002). Our results corroborate the
findings of McLaren et al., (2006) that have
indicated acidic soil pH and low clay content
caused low sorption on inorganic pollutants.
Similarly results were also reported by
Karatas et al., (2006) and Chauhan (2014).
Transfer factor of metals from soil to crops
and vegetables
The metal transfer factor for Brinjal (Solanum
melongena) was 68.90, 75.46 and 93.92,
14.25, 20.99 and 27.45, 3.02, 3.60 and 1.29,
1.82 and 4.58, for Ni, Cr, Cd and Pb,
respectively. Ni TF was the highest for
Brinjal (Solanum melongena) (93.92),
followed by the Spinach (Spinacea oleracea)
(40.96)
and
Tomato
(Lycopresicon
esculantum) (35.08). Cr TF was the highest
for Brinjal (Solanum melongena) (27.45),
followed by the Spinach (Spinacea oleracea)
(8.79) and Tomato (Lycopresicon esculantum)
(14.05). Cd TF was the highest for Brinjal
(Solanum melongena) (7.39), followed by the
Spinach (Spinacea oleracea) (4.66) and
Tomato (Lycopresicon esculantum) (1.89). Pb
TF was the highest for Brinjal (Solanum
melongena) (4.58), followed by the Spinach
(Spinacea oleracea) (7.74) and Tomato
(Lycopresicon esculantum) (0.07). Cr TF was
the highest for rice compared to wheat.
Metal transfer factor from soil to plants is a
key module of human exposure to heavy
metals via food chain. Transfer factor of
metals is essential to investigate the human
health risk index (Cui et al., 2004). TF of
71
Int.J.Curr.Microbiol.App.Sci (2019) 8(2): 64-90
metals varied significantly in different
vegetables. Among vegetables, Brinjal
(Solanum melongena), Tomato (Lycopresicon
esculantum) and Spinach (Spinacea oleracea)
showed a higher metal transfer factor from
soil to plants than other vegetables. Leafy
vegetable has a higher transpiration rate to
sustain the growth and moisture content of
plant that may be the reason of high uptake of
metals in them (Tani and Barrington, 2005;
Lato et al., 2012). Similar results were also
reported by Jan et al., (2010) and Khan et al.,
(2010). Similarly results were also reported
by Mahmood and Malik (2013).
Relationship of metals
chemical properties of soil
with
showed only Cd (r=0.333**) and Pb
(r=0.240*) in winter season. Result showed
the Cr in soil showed significant negative
relationship with Pb (r= -0.241*) in rainy and
positive with Ni (r=0.438**) in winter season.
The Ni, Cd and Pb were positively related
with each other in both rainy and winter
season. Several earlier studies have reported
that soil pH has a negative correlation with
micronutrients for some calcareous alkaline
soils (Chahal et al., 2005; Sharma et al.,
2005; Murthy and Murthy 2005; Verma et al.,
2013).
Data exhibited a significant positive
correlation between Cr, Cd and Pb in soil but
Ni had no significant correlation in soil as
well as plant. The data exhibited a significant
positive correlation between Cr, Cd and Pb in
soil but Ni was not significant correlation in
soil as well as plant. Cd and Pb in soil showed
significant correlation with Cr having r=0.46*
and 0.38*, respectively. The Cd in soil
showed significant and positively related with
Pb in soil, Ni and Cd content in plant showing
the r values of r=0.974**,0.474* and
0.699**,respectively. The Pb content in soil
had significant relationship with Ni and Cd
content in plant. The Ni, Cr Cd and Pb
content in plant were positively related with
each other. Similar results were also reported
by Bhattacharyya et al., (2005) (Table 1–8).
physic-
In rainy season, the pH was negatively
correlated with OC (r=-0.252*) and Cr (r=0.413**). In winter season, pH showed
significant negative relation with EC(r= 0.601**), OC (r= -0.356**), Cd (r= -0.696**)
and Pb (r= -0.619**). While, it had significant
positive relationship with Cr (r=0.304**). In
winter season, the EC had positive and
significant relationship with OC (r=0.239*),
Cd (r=0.366**) and Pb (r=0.420**). The OC
showed significant positive relationship with
Ni (r=0.305**), Cd (r=0.279*) and Pb
(r=0.232*) in rainy season whereas it had
Table.1 Permissible limit for water, soil and plants
Parameters
Ni (ppm)
Cr (ppm)
Cd(ppm)
Pb (ppm)
Indian standard
EU
Water
Soil Plant Plant Water
60
NA
3-6
250-500
1.4
0.05
0.01
0.1
67
20
1.5
2.5
50
100
3
100
0.02
1.31
0.004
0.05
72
WHO
Soil
Plant
0.150-1.03
4.5
0.30
0.4
10.00
1.30
0.02
2.00
FAO of
permissible limit
for irrigation
water
0.20
0.01
2.0
5.0
Int.J.Curr.Microbiol.App.Sci (2019) 8(2): 64-90
Table.2 pH, EC and heavy metals concentration in wastewater in rainy and winter seasons (n=20)
ID
Lat
Long
23˚10‟10.2”
79˚54‟33.6”
23˚10‟06.7”
79˚54‟32.1”
23˚10‟15.4”
79˚54‟35.1”
23˚10‟22.9”
79˚54‟30.1”
23˚10‟28.8”
79˚54‟16.1”
23˚11‟57.5”
79˚53‟22.6”
23˚11‟53.5”
79˚53‟25.2”
23˚11‟50.6”
79˚53‟25.4”
23˚11‟46.5”
79˚53‟26.4”
23˚11‟55.2”
79˚53‟20.3”
23˚11‟57.4”
79˚53‟21.6”
23˚12‟03.4”
79˚53‟22.6”
23˚12‟43.4”
79˚53‟06.8”
23˚12‟46”
79˚53‟00.4”
23˚13‟34.1”
79˚53‟3.9”
23˚14‟25.1”
79˚53‟38.9”
23˚14‟44.1”
79˚53‟58.8"
23˚14‟49.4”
79˚53‟57.6”
23˚14‟57”
79˚54‟0.4”
23˚15‟2.4”
79˚53‟54.6”
Min
Max
Mean
WHO/Indian standard Awasthi
(2000)
W-1
W-2
W-3
W-4
W-5
W-6
W-7
W-8
W-9
W-10
W-11
W-12
W-13
W-14
W-15
W-16
W-17
W-18
W-19
W-20
pH
Rainy Winter
6.66
7.68
7.19
8.34
7.81
8.78
6.50
8.21
7.20
8.81
6.91
8.05
7.45
7.76
8.20
8.73
7.80
8.12
8.23
8.56
8.35
8.00
8.30
8.16
8.10
8.52
8.34
7.96
8.05
7.70
7.91
7.90
8.32
8.12
8.40
7.52
7.73
8.35
7.90
7.92
6.50
7.52
8.40
8.81
7.77
8.16
EC(dSm-1)
Rainy Winter
0.59
0.67
0.66
0.68
0.66
0.68
0.69
0.71
0.78
0.70
0.67
0.69
0.65
0.69
0.64
0.75
0.65
0.75
0.65
0.75
0.65
0.77
0.65
0.87
0.75
0.83
0.73
0.93
0.73
0.88
0.73
0.80
0.72
0.84
0.73
0.89
0.68
0.69
0.69
0.88
0.59
0.67
0.78
0.93
0.69
0.77
73
Ni(mgL-1)
Rainy Winter
ND
0.003
ND
0.004
ND
0.001
ND
0.004
ND
0.007
ND
0.001
ND
0.007
ND
0.010
ND
0.002
ND
0.010
ND
0.006
ND
0.013
ND
0.022
ND
0.019
ND
0.004
0.001
0.022
0.007
0.024
ND
0.006
ND
0.009
0.014
0.025
ND
0.001
0.014
0.025
0.001
0.010
0.2/1.4
Cr(mgL-1)
Rainy Winter
0.703
0.006
3.694
0.011
4.171
0.008
0.089
0.004
3.992
0.009
1.629
0.011
0.129
0.015
0.159
0.012
0.029
0.052
0.075
0.023
0.015
0.028
0.016
0.033
0.072
0.058
0.088
0.029
0.042
0.050
0.334
0.054
0.189
0.045
0.041
0.056
0.025
0.041
0.244
0.018
0.015
0.004
4.171
0.058
0.787
0.028
0.1/0.05
Cd(mgL-1)
Rainy Winter
ND
0.011
ND
0.011
ND
0.009
ND
0.010
ND
0.004
ND
0.004
ND
0.004
ND
0.006
ND
0.006
ND
0.005
ND
0.005
ND
0.006
ND
0.007
ND
0.011
ND
0.005
ND
0.008
ND
0.009
ND
0.001
ND
ND
ND
0.005
ND
ND
ND
0.011
ND
0.006
0.05/0.01
Pb(mgL-1)
Rainy Winter
ND
0.004
ND
0.007
ND
0.004
0.260
0.005
0.050
0.002
0.020
0.002
0.030
0.001
0.170
0.013
0.060
0.005
0.080
0.003
0.090
0.001
0.060
0.005
0.100
0.003
0.150
0.002
0.230
0.001
0.170
0.004
0.120
0.005
0.220
0.007
0.180
0.050
0.010
0.050
ND
0.001
0.260
0.050
0.100
0.009
0.01/0.1
Int.J.Curr.Microbiol.App.Sci (2019) 8(2): 64-90
Table.3 Descriptive statistics of soil properties (n=80+80=160)
Para
meter
pH
EC
OC
Ni
Cr
Cd
Pb
Min
R
6.44
0.07
1.20
0.35
0.00
0.01
0.56
W
6.38
0.11
1.26
0.00
0.00
0.00
0.00
Max
R
8.30
0.97
6.76
1.55
0.88
0.65
7.24
Mean
W
8.25
0.68
8.57
2.83
2.01
1.13
16.00
R
7.71
0.17
4.02
0.63
0.39
0.13
3.40
W
7.51
0.27
4.69
0.97
0.16
0.30
5.98
S.E
R
0.04
0.02
0.15
0.02
0.02
0.01
0.15
SD
W
0.06
0.01
0.22
0.07
0.03
0.03
0.49
R
0.40
0.14
1.33
0.19
0.21
0.10
1.32
W
0.50
0.13
1.98
0.60
0.24
0.25
4.41
ANOVA result
for seasons
F value
Sig.
7.31
**
19.48
**
6.43
*
23.92
**
42.21
**
32.57
**
25.26
**
EU
(2006)
Indian
Standard
50.00
100.00
3.00
100.00
75-150
NA
03-06
250-500
EU (2006) * significant at 0.01 level; (Awasthi 2000) ** significant at 0.05 level
Table.4 Physic-chemical properties of soil from both sides of Omti Nala at 200,400,600 and 800
m distances in both season(n=80 in each season)
Variables
Season
pH
Rainy
Winter
EC
(dSm-1)
Rainy
Winter
OC
(gkg-1)
Rainy
Winter
Ni
(mgkg-1)
Rainy
winter
Cr
(mgkg-1)
Rainy
winter
Cd
(mgkg-1)
Rainy
winter
Pb
(mgkg-1)
Rainy
winter
200
6.85-8.28
(7.78)
6.38-8.21
(7.52)
0.08-0.35
(0.15)
0.11-0.68
(0.27)
1.61-6.45
(4.04)
1.68-8.57
(4.81)
0.40-1.55
(0.66)
0.00-1.77
(0.99)
0.03-0.67
(0.37)
0.00- 0.37
(0.14)
0.03-0.41
(0.13)
0.00-1.13
(0.34)
1.68-7.24
(3.53)
0.00-15.00
(6.20)
Distance (m)
400
600
6.87-8.3
6.44-8.15
(7.71)
(7.63)
6.75-8.25
6.65-8.25
(7.52)
(7.48)
0.08-0.97
0.08-0.35
(0.20)
(0.14)
0.15-0.47
0.13-0.53
(0.24)
(0.28)
2.08-5.79
1.31-5.93
(4.11)
(3.77)
1.26-7.81
1.46-8.57
(4.64)
(5.00)
0.45-1.02
0.42-0.85
(0.63)
(0.60)
0.00-2.02
0.00-2.83
(0.92)
(1.03)
0.00-0.74
0.10-0.88
(0.39)
(0.38)
0.00-0.54
0.00-2.01
(0.16)
(0.22)
0.05-0.65
0.04-0.36
(0.13)
(0.12)
0.00-0.72
0.00-0.81
(0.26)
(0.35)
1.22-5.82
1.44-6.76
(3.33)
(3.39)
0.00-15.00 0.00-16.00
(5.75)
(6.81)
NS = Non significant
74
800
6.88-8.24
(7.68)
6.67-8.22
(7.53)
0.07-0.86
(0.19)
0.11-0.61
(0.26)
1.20-6.76
(4.15)
1.95-7.60
(4.33)
0.35-1.34
(0.64)
0.00-1.78
(0.95)
0.17-0.82
(0.41)
0.00-0.31
(0.12)
0.01-0.47
(0.13)
0.00-0.71
(0.25)
0.56-6.18
(3.34)
0.00-13.00
(5.17)
ANOVA result for distances
F value
Sign
0.483
NS
0.047
NS
0.773
NS
0.367
NS
0.342
NS
0.396
NS
0.399
NS
0.131
NS
0.106
NS
0.701
NS
0.092
NS
0.773
NS
0.094
NS
0.484
NS
Int.J.Curr.Microbiol.App.Sci (2019) 8(2): 64-90
Table.5 Heavy metal concentration in plant samples collected from both sides of Omti Nala in
rainy and winter season(n=17)
Rainy
Site
Crop
ID
Rice
S-8
Rice
S-15
Rice
19
Rice
23
Rice
28
Rice
30
Rice
35
Rice
36
Rice
37
Rice
42
Rice
43
Rice
45
Rice
51
Rice
57
Rice
63
Rice
67
Rice
74
Permissible
limit
Ni
2.70
3.35
3.10
2.75
4.35
3.65
3.45
3.20
10.35
3.65
2.95
3.55
6.55
3.65
3.80
5.45
2.30
67.00
Cr
17.95
12.30
14.60
11.05
10.00
14.35
13.95
10.90
8.70
7.05
11.40
18.70
10.60
11.15
8.20
7.00
11.45
20
Cd
0.50
0.60
0.55
0.35
0.55
0.60
0.35
0.80
0.55
0.40
0.65
0.45
0.50
0.25
0.70
0.20
0.25
1.50
Winter
Pb
10.00
1.45
9.00
8.50
14.00
12.00
11.50
12.00
10.00
11.50
12.50
10.00
11.00
10.00
15.50
13.50
3.50
2.50
Site
ID
8
9
11
13
17
34
37
40
42
43
44
45
51
63
68
75
80
Crop
Tomato
Spinach
Brinjal
Brinjal
Brinjal
Wheat
Wheat
Tomato
Sugar beat
Wheat
Wheat
Wheat
Wheat
Wheat
Wheat
Wheat
Spinach
Ni
4.35
6.80
8.15
15.90
11.85
3.50
4.10
7.70
7.15
3.15
3.20
2.90
1.90
1.70
1.70
2.30
6.70
67.00
Cr
10.40
9.15
16.10
29.10
19.10
10.25
12.45
13.30
9.65
7.80
7.95
9.00
7.70
14.15
10.15
8.50
13.50
20
Cd
0.75
1.30
1.60
2.10
1.80
0.25
0.30
0.85
0.80
0.40
0.40
0.30
0.15
0.15
0.15
0.40
0.55
1.50
Pb
0.95
17.50
16.50
32.00
22.00
12.50
15.50
12.50
11.00
14.00
16.00
12.50
10.50
7.50
7.50
16.50
19.50
2.50
EU (2006) (Awasthi 2000)
Table.6 Correlation coefficient between DTPA extractable metals and metals content in crops
Parameters
DTPA extractable in soils
Ni
Cr
Cd
Pb
1
DTPA Ni in soil
0.047
1
DTPA Cr in soil
-0.279 0.469*
1
DTPA Cd in soil
-0.287 0.382* 0.974**
1
DTPA Pb in soil
-0.274
0.076
0.474*
0.404*
Ni in plant
-0.128
0.056
0.222
0.154
Cr in plant
-0.301
0.105
0.699** 0.626**
Cd in plant
-0.184
0.305
0.335
0.204
Pb in plant
*. Correlation is significant at the 0.05 level (2-tailed).
**. Correlation is significant at the 0.01 level (2-tailed).
75
Ni
1
0.563**
0.822**
0.726**
metals in plant
Cr
Cd
1
0.637**
0.502**
1
0.701**
Pb
1
Int.J.Curr.Microbiol.App.Sci (2019) 8(2): 64-90
Table.7 Transfer factor of heavy metals from soil to crops and vegetables grown at Omti Nala
Crop/vegetables
Rice
Rice
Rice
Rice
Rice
Rice
Rice
Rice
Rice
Rice
Rice
Rice
Rice
Rice
Rice
Rice
Rice
Tomato
Brinjal
Brinjal
Brinjal
Spinach
Spinach
Wheat
Wheat
Wheat
Ni
4.3
6.2
3.5
27.5
6.8
6.1
6.1
7.2
18.1
8.6
7.5
5.9
29.8
9.9
27.1
34.1
8.8
35.08
75.46
93.92
68.90
29.39
40.96
10.37
12.14
11.62
Cr
28.5
22.8
32.4
23.5
18.5
27.1
26.3
24.8
21.5
12.4
22.3
39.0
21.2
16.4
11.5
10.1
14.1
14.05
14.25
27.45
20.99
8.79
7.77
10.05
8.00
7.18
76
Cd
5.6
6.7
7.9
5.0
5.0
7.5
8.8
9.1
9.8
5.6
7.6
9.0
7.1
1.7
4.4
1.4
1.6
1.89
3.02
7.39
3.60
4.66
2.48
0.79
0.89
3.92
Pb
3.6
0.5
3.8
3.4
5.8
4.4
8.0
6.2
5.6
3.8
4.4
3.6
3.4
2.4
3.4
3.1
0.7
0.07
1.29
4.98
1.82
7.74
1.33
1.60
1.90
5.19
Int.J.Curr.Microbiol.App.Sci (2019) 8(2): 64-90
Table.8 Relationship of physico-chemical properties with heavy metals in soils in rainy and winter seasons (n=80+80=160)
parameter
pH
EC
R
W
EC
-0.106
-0.601**
OC
-0.252*
Cr
OC
R
W
-0.356**
0.162
0.239*
-0.413**
0.304**
0.191
Ni
-0.067
0.041
Cd
-0.159
Pb
0.033
Cr
R
W
-0.141
0.21
-0.218
0.124
0.01
0.305**
-0.696**
0.172
0.366**
-0.619**
0.089
0.420**
Ni
R
W
0.011
-0.121
0.438**
0.279*
0.333**
0.134
0.232*
0.240*
-.241*
*. Correlation is significant at the 0.05 level (2-tailed).
**. Correlation is significant at the 0.01 level (2-tailed).
77
Cd
R
W
-0.094
0.817**
0.318**
0.014
0.862**
0.369**
R
W
0.810**
0.833**
Int.J.Curr.Microbiol.App.Sci (2019) 8(2): 64-90
Table.9a Factor analysis-results (Rainy season)
Attributes
Principal Component
Communalities
PC1(Ni, Cd, Pb)
PC2(pH, EC, OC,
Cr)
pH
0.006
-0.747
0.55
EC
0.144
0.43
0.20
OC
0.335
0.537
0.40
Cr
-0.197
0.804
0.68
Ni
0.947
0.056
0.90
Cd
0.887
0.249
0.84
Pb
0.957
-0.086
0.92
Eigen values
2.839
1.683
% of
Variance
40.561
24.049
Total variance
(64.61%)
Table.9b Factor analysis-results (winter season)
Attributes
Principal Component
Communalities
PC1(pH, EC, OC, Cd, Pb)
PC2(Cr,
Ni)
pH
-0.866
0.245
0.81
EC
0.661
-0.182
0.47
OC
0.495
-0.253
0.30
Cr
-0.211
0.803
0.68
Ni
0.235
0.838
0.75
Cd
0.887
0.193
0.82
Pb
0.856
0.303
0.82
Eigen values
3.05
1.633
% of
Variance
43.569
23.327
Total variance
(66.896%)
78
Int.J.Curr.Microbiol.App.Sci (2019) 8(2): 64-90
Table.10 Clustering analysis and tests of equality of group means in rainy season
Zone
1
2
3
4
5
6
7
8
9
Sites
pH
S-60,S-72,S-62,S-57,S-52,S-56,S-78,S-55,S-77,S-80,S-61,S79,S-63,S-71
S-64,S-73,S-74,S-59,S-75,S-50,S-51,S-51,S-42,S-48,S-54,S53
S-68,S-70,S-76,S-65,S-67,S-66,S-69,S-58,S-2
S-3,S-4,S-5,S-1
S-40,S-41,`S-43,S-44
S-31,S-37,S-33,S-46,S-49,S-38,S-27,S-30,S-39,S-45,S-47,S32
S-18,S-20,S-21,S-16,S-25,S-26,S-19,S-24,S-34
S-6,S-10,S-9,S-15,S-28,S-12,S-11,S-14,S-8
S-22,S-23,S-17,S-29,S-36,S-7,S-13,S-3
Mean
SD
Wilks' Lambda
F
P-value
79
7.92
EC
OC
Ni
Cr
Cd
Pb
-1
-1
-1
-1
-1
(dSm ) (gkg ) (mgkg ) (mgkg ) (mgkg ) (mgkg-1)
0.16
4.97
0.72
0.24
0.15
4.36
7.91
0.1
3.91
0.65
0.26
0.13
3.66
7.85
7.16
7.94
7.9
0.22
0.3
0.13
0.14
2.79
6.07
1.35
2.64
0.78
1.15
0.5
0.49
0.3
0.6
0.29
0.42
0.21
0.4
0.09
0.06
4.71
6.74
3.07
2.26
7.69
7.13
7.42
7.71
0.39
0.45
10.7
**
0.21
0.2
0.16
0.17
0.14
0.88
1.18
0.32
5.69
4.59
3.75
4.02
1.33
0.11
70.4
**
0.52
0.55
0.5
0.63
0.19
0.29
21.7
**
0.53
0.58
0.44
0.39
0.21
0.62
5.45
**
0.08
0.09
0.07
0.13
0.1
0.36
15.8
**
2.16
2.76
2.16
3.4
1.32
0.13
57.4
**
Int.J.Curr.Microbiol.App.Sci (2019) 8(2): 64-90
Table.11 Clustering analysis and tests of equality of group means in winter season
Zone
1
2
3
4
5
6
7
Sites
S-38,S-46,S-42,S-45,S-47,S-20,S-44,S-48,S-49,S-50,S-34,S-40, S37,S-42,S-43
S-04,S-07,S-14,S-39,S-24,S-29,S-22
S-02,S-03,S-28,S-25,S-23,S-27,S-32
S-35,S-69,S-55,S-67,S-62,S-64,S-36,S-80
S-65,S-68,S-61,S-59,S-77,S-78,S-76,S-70,S-71,S-75,S-57,S-60
S-09,S-26,S-10,S-18,S-01,S-19
S-08,S-31,S-15,S-17,S-6,S-05,S-11,S-12,S-21,S-33
ANOVA result F
Sig.
Mean
SD
Wilks' Lambda
F
P-value
80
pH
6.93
EC
0.38
OC
6.19
Ni
1.00
Cr
0.17
Cd
0.55
7.12
0.37
4.28
1.11
0.12
0.50
6.94
0.31
5.76
0.96
0.07
0.62
7.50
0.24
4.60
0.36
0.02
0.21
8.05
0.17
3.76
1.41
0.41
0.15
8.00
0.22
4.99
1.35
0.21
0.17
7.75
0.24
3.89
1.08
0.20
0.14
17.81
4.66
26.25
15.55
2.84
31.49
0.00000 0.00046 0.00000 0.00000 0.01534 0.00000
7.51
0.27
4.69
0.97
0.16
0.3
0.5
0.13
1.98
0.59
0.24
0.25
0.311
0.679
0.841
0.586
0.715
0.478
27.01
5.76
2.302
8.593
4.848
13.291
0
0
0.043
0
0
0
Pb
10.91
11.59
8.32
3.52
3.88
4.44
3.23
202.05
0.00000
5.98
4.41
0.445
15.182
0
Int.J.Curr.Microbiol.App.Sci (2019) 8(2): 64-90
Fig.1 Location map of study area
81
Int.J.Curr.Microbiol.App.Sci (2019) 8(2): 64-90
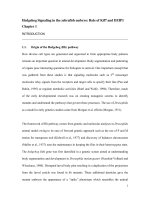
Fig.2 Spatio-temporal maps of physicochemical properties and heavy metals in soil
Fig.2(a) Status of pH in soil In rainy season
Fig.2(b) Status of pH in soil in winter season
Fig.3(a) EC of soil in rainy season
Fig.3(b) EC of soil in rainy season
82
Int.J.Curr.Microbiol.App.Sci (2019) 8(2): 64-90
Fig.4(a) Status of OC in soil of rainy season
Fig.4(b) Status of OC in soil of winter season
Fig.5(a) Status of Ni in soil in rainy season
Fig.5(b) Status of Ni in soil in winter season
83
Int.J.Curr.Microbiol.App.Sci (2019) 8(2): 64-90
Fig.6(a)Status of Cr in soil of rainy season
Fig.6 (b) Status of Cr in soil of rainy season
Fig.7(a) Status of Cd in soil in rainy season
Fig.7(b) Status of Cd in soil in rainy season
84
Int.J.Curr.Microbiol.App.Sci (2019) 8(2): 64-90
Fig.8(a) Status of Pb in soil in rainy season
Fig.8(b) Status of Pb in soil in rainy season
The second component (PC2) contributes pH,
EC, OC and Cr and Ni and Cr at 24.04
and23.32% total variance. This component
seems to be arisen from a different source
such as agrochemical products (organic
fertilizers) or solid manure.
Principal Component Analysis (PCA)
The variables are correlated with two
principal components in which 64.61 and
66.89% of the total variance in rainy and
winter seasons, respectively. The number of
significant principal components is selected
on the basis of the Kaiser criterion with eigen
value higher than 1 (Kaiser, 1960). According
to this criterion, only the first two principal
components are retained because subsequent
eigen values are all less than one. Hence,
reduced dimensionality of the descriptor
space is two. After varimax orthogonal
rotation, two components (factors) are
extracted. The first component with 40.56 and
43.56 % of variance comprises Ni Cd and Pb
and pH, EC, OC, Cd and Pb (bold figures)
with high loadings in rainy and winter season
respectively.
The obtained results demonstrate that
statistical procedures towards classifying the
metals as groups in terms of relationship with
soil properties and identifying their probable
origin in soil. This association strongly
suggests that these variables have a similar
source. It seems that use of untreated
wastewater recently reported at (Qishlaqi et
al., 2006) is the main reason for this
association. The physicochemical meaning of
PC1 also agrees with the correlation
coefficient between these variables. Extensive
application of wastewater has also resulted in
deterioration of the soil quality through
85
Int.J.Curr.Microbiol.App.Sci (2019) 8(2): 64-90
increase in SOM content facilitating the
accumulation of heavy metals in the surface
soils in winter season. Soil reaction (pH) is of
prime importance in controlling the
availability of micronutrients, since it affects
directly their solubility as well as activity in
the soil environment (Diatta, 2008; Rodriguez
et al., 2008; Diatta et al., 2009). Many
researchers have used this multivariate tool to
identify the most sensitive soil and
topographic properties influencing crop
production (Jiang and Thelen, 2004; Kaspar et
al., 2004; Blanco-Canqui et al., 2006).
Similarly results were also reported by
Qishlaqi and Moore (2007) (Table 9).
S-44), Zone 6 (S-31, S-37, S-33, S-46, S-49,
S-38, S-27, S-30, S-39, S-45, S-47, S-32),
Zone 7(S-18, S-20, S-21, S-16, S-25, S-26, S19, S-24, S-34), Zone 8 (S-6, S-10, S-9, S-15,
S-28, S-12, S-11, S-14, S-8) and Zone 9 (S22, S-23, S-17, S-29, S-36, S-7, S-13, S-3).
However, in winter season seven group zone
5,6,7,8 and 9 were found less heavy metals as
these were at a reasonable distance from
industries and also receives fresh water from
nearby running streams and nullahs. Hence
stream quality in these localities was better
because pollution load decreases from nearby
logged areas. Generally, levels of measured
parameters were low in this zone in
comparison to other zones. This could be
related to the dilution and recharging effects.
It is assumed that overall pollutant
concentration may decrease as suspended
particulate materials mostly settle down at the
bottom of the streams with decrease in water
flow. While in Zone 1, 2, 3 and 4 heavy loads
of pollutants were seen as they were
containing higher concentrations of metals
and other physic-chemical parameters.
However In winter season, all sampling sites
were grouped into seven groups (to be called
zones here) on the basis of spatial similarities
among sites and differences among different
groups (zones) (Table 10 and 11).
Clustering analysis
Data explain mean of all checked parameters
along with test of equality of group means by
Wilk‟s lambda statistics at p<0.05. Wilk‟s
lambda can also be used to measure potential
of parameters before test of factor analysis
(FA). It is observed that Wilk‟s lambda values
are small, showing strong discrimination
between all values. For grouping of all
studied locations, Cluster analysis was done
using statistics of agglomeration schedule and
by Ward‟s method as a clustering technique
and square Euclidean distance as interval. In
rainy season, all sampling sites were grouped
into nine groups (to be called zones here) on
the basis of spatial similarities among sites
and differences among different groups
(zones). Clusters are formulated on the basis
of variations in the loads of physic chemical
properties and heavy metals at each studied
location. The results grouped all sampling
localities into nine zones and each zone
contain following sites: Zone 1 (S-60, S-72,
S-62, S-57, S-52, S-56, S-78, S-55, S-77, S80, S-61, S-79, S-63 and S-71), Zone 2 (S-64,
S-73, S-74, S-59, S-75, S-50, S-51, S-51, S42, S-48, S-54, S-53), Zone 3 (S-68, S-70, S76, S-65, S-67, S-66, S-69, S-58, S-2), Zone 4
(S-3, S-4, S-5, S-1), Zone 5 (S-40, S-41, S-43,
ANOVA result also showed the significant
difference between different zone confirm the
result of clustering except EC. ANOVA result
showed that the zone created using clustering
was validated the result of because the all
zone were significantly differed for pH, EC,
OC and heavy mental Ni, Cr, Cd and Pb
confirm with Wilks‟ lamda value also except
OC.
This could be related to the dilution and
recharging effects. It is assumed that overall
pollutant concentration may decrease as
suspended particulate materials mostly settle
86
Int.J.Curr.Microbiol.App.Sci (2019) 8(2): 64-90
down at the bottom of the streams with
decrease in water flow. While in Zone 1, 2, 3,
5 and 6 heavy loads of pollutants were seen as
they were containing higher concentrations of
metals and other physic-chemical parameters.
contamination in Halsi Nala; an
assessment and spatial distribution
survey using geographical information
systems (GIS) approach. Journal of
Environmental
Chemistry
and
Ecotoxicology 7(4):37-48.
Bertin G and Averbeck D. 2006. Cadmium:
cellular effects, modifications of
biomolecules, modulation of DNA
repair and genotoxic consequences
Biochimie, 88, 1549-1559.
Bhattacharyya P, Chakraborty A, Chakrabarti
K, Tripathy S, Powell MA. 2005.
Chromium uptake by rice and
accumulation in soil amended with
municipal solid waste compost.
Chemosphere 60, 1481–1486.
Boman BJ, Wilson PC, Ontermaa EA (2002).
Understanding
water
quality
parameters for citrus irrigation and
drainage systems, Circular 1406, U.S.
Department
of
Agriculture,
Cooperative
Extension
Service,
University of Florida, IFAS, Florida,
USA.
Chahal V, Chand P, Nagpal A, Kaur KJ and
Pakade YB. 2014. Evaluation of
Heavy Metals Contamination and its
Genotoxicity in Agricultural Soil of
Amritsar, Punjab, India. International
Journal of Research in Chemistry and
Environment 4(4): 20-28.
Chandra S, Chohan LKS, Murthy RC, Sexana
PN, Pande PN, and Gupta SK. 2005.
Comparative
biomonitoring
of
leachates from hazardous solid waste
of two industries using Allium test,
Science Total Environmental. 347, 4652.
Chauhan G. 2014. Toxicity study of metals
contamination on vegetables grown in
the vicinity of cement factory
International Journal of Scientific and
Research Publications, (4)11.
De Vries W, Schütze G, Lofts S, Tipping E,
Meili M, Römkens PFAM and
However, overall load of Cd, Cr, Ni, and Pb is
contributed by lead batteries, industrial
effluents, municipal waste, paints and
varnishes, discharge from automobile
(Temnerud and Bishop, 2005). Lead is found
naturally in earth crust in small concentration
and it can cause irreversible effects if it is not
found in permissible limits (Boman et al.,
2000). Similarly results were also reported by
Azam et al., (2015).
Spatio-temporal maps generated using GIS
GIS has the capacity to relate layers of data
for the same points in space, combining,
analyzing and finally represent it in the map
form. Maps represent spatial distribution of
pH, EC, OC and heavy metals i.e. Ni, Cr, Cd
and Pb in rainy and winter seasons at all
studied sampling sites. Map were present
spatio-temporal map of pH, EC, OC, Ni, Cr,
Cd and Pb [Figs. 2–8(a&b)].
References
Akbar F, Ishaq M, Ihsanullah and Asim SM.
2009. Multivariate statistical analysis
of heavy metals pollution in industrial
area and its comparison with relatively
less polluted area: a case study from
the City of Peshawar and District Dir
Lower. J. Hazard. Mater. 176, 609–
616.
Awashthi SK. 2000. Prevention of Food
Adulteration Act no 37 of 1954.
Central and State Rules as Amended
for 1999. Ashoka Law House, New
Delhi.
Azam I, Afsheen S, Zia A, Sarwar MK and
Iqbal T. 2015. Surface water
87
Int.J.Curr.Microbiol.App.Sci (2019) 8(2): 64-90
Groenenberg JE. 2005. Calculation of
critical loads for cadmium, lead and
mercury. Background Document to a
Mapping Manual on Critical Loads of
Cadmium, Lead and Mercury,
Wageningen: Alterra, 43
Ekmekyapar F, Sabudak T And Seren G.
2012. Assessment Of Heavy Metal
Contamination In Soil And Wheat
(Triticum aestivum L.) Plant Around
The Çorlu–Çerkezkoy Highway In
Thrace Region Global Nest Journal,
14 (4) Pp 496-504.
European
Union
2006.
Commission
regulation (EC) No. 1881/2006 of 19
December 2006 setting maximum
levels for certain contaminants in
foodstuffs. Off. J. Eur. Union L. 364,
5–24.
Facchinelli A, Sacchi E and Mallen L. 2001.
Multivariate statistical and GIS-based
approach toidentify heavy metals
sources in soils. Environmental
Pollution. 114: 13-324.
Freitas M, Gomes A, Porto G and Fernandes
E. 2010. Nickel induces oxidative
burst, NF-kappaB activation and
interleukin-8 production in human
neutrophils, Journal Biology Inorganic
Chemistry. 15, 1275-1283.
Gimmler H, Carandang J, Boots A, Reisberg
E, Woitke M 2002. Heavy metal
content and distribution within a
woody plant during and after seven
years continuous growth on municipal
solid waste (MSW) bottom slag rich in
heavy metals. Journal Application
Botany, 76: 203-217.
Gowd S. 2010. Assessment of heavy metal
contamination in soils at Jajmau
(Kanpur) and Unnao industrial areas
of the Ganga Plain, Uttar Pradesh,
India. Journal of Hazardous Materials.
174: 113-121.
Jackson ML. 1973. Soil Chemical Analysis.
Constable Co. Ltd., London.
Jan FA, Ishaq M, Khan S, Ihsanullah I,
Ahmad I and Shakirullah M. 2010. A
comparative study of human health
risks via consumption of food crops
grown on wastewater irrigated soil
Janos P,Vavrova J, Herzogova L and Pilarova
V. 2010. Effects of inorganic and
organic amendments on the mobility
(leachability) of heavy metals in
contaminated soil: A sequential
extraction study, Geoderma, 159, 335–
341.
Jantschi L, Suciu I, Cosma C, Todica M and
Bolboaca SD. 2008. Analysis of soil
heavy metal pollution and pattern in
Central Transylvania, International
journal of molecular science. 9- 434.
Kaiser HF. 1960. The application of
electronic computers to factor
analysis. Edu. Psychol. Meas., 20:
141-151.
Kar SP, Mandal SK, Saha T and Kole
RK.2008. Assessment of heavy metal
pollution in surface water. Indian
Journal
Environmental
Sciences
Technology. 5(1): 119-124, Winter.
Karatas M, Dursun S, Guler E, Ozdemir C
and Argun ME. 2006. Heavy metal
accumulation in wheat plants irrigated
by waste water. Cellulose Chemistry
And Technology.
Khan S, Rehman S, Khan AZ, Khan MA and
Shah T. 2010. Soil and vegetables
enrichment with heavy metals from
geological sources in Gilgit, northern
Pakistan. Ecotoxicol. Environ. Safety
73, 1820–1827.
Lado LR, Hengl T, and Reuter HI. 2008.
Heavy metals in European soils: A
geostatistical analysis of the FOREGS
Geochemical database, Geoderma.,
148, 189-199.
Lin YP, Teng TP and Chang TK.2002.
Multivariate analysis of soil heavy
metal pollution and landscape pattern
in Changhua County in Taiwan,
88