Optimization of extraction of total phenolic and total flavonoid from seeds of Alpinia blepharocalyx K. Schum. using the response surface methodology
Bạn đang xem bản rút gọn của tài liệu. Xem và tải ngay bản đầy đủ của tài liệu tại đây (1.19 MB, 11 trang )
Vietnam Journal of Science and Technology 57 (3B) (2019) 105-115
doi:10.15625/2525-2518/57/3B/14443
OPTIMIZATION OF EXTRACTION OF TOTAL PHENOLIC AND
TOTAL FLAVONOID FROM SEEDS OF Alpinia blepharocalyx K.
SCHUM. USING THE RESPONSE SURFACE METHODOLOGY
Nguyen Tan Thanh1, Mai Thi Thanh Huyen1, Nguyen Ngoc Tuan2,
Tran Dinh Thang1, *
1
School of Chemistry, Biology and Environment, Vinh University, 182 Le Duan Street,
Vinh City
2
Institute of Biotechnology and Food Technology, Industrial University of Ho Chi Minh City,
12 Nguyen Van Bao Street, Ward 4, Go Vap District, Ho Chi Minh City
*
Email:
Received: 24 September 2019; Accepted for publication: 2 November 2019
Abstract. Seeds of Alpinia blepharocalyx contain high amounts of phenolic and flavonoid
compounds with potential antioxidant properties. In this study, the effects of the extraction
method on the recovery of phenolic and flavonoid compounds from Alpinia blepharocalyx seeds
were investigated. Response surface methodology (RSM) has been used to optimize the
extraction conditions of total phenolic and total flavonoid from seeds of Alpinia blepharocalyx.
A Box-Behnken design was used to investigate the effects of four independent variables, namely
extraction temperature (°C), extraction time (min), solvent/material ratio (ml/g) and ethanol
concentration (%) on the responses: total phenolic content (TPC) and yield. The optimal
conditions obtained from response RSM were 52.66 % v/v for the solvent composition, 62.34 °C
for extraction temperature, 34.48/1 ml/g for solvent/material ratio and 125.42 min for extraction
time. The experimental values of TPC, TFC and yield were 39.31 ± 0.05 mg GAE/g, 12.75 ±
0.07 mg CE/g and 6.97 ± 0.05 %, respectively.
Keywords: Alpinia blepharocalyx, total phenolic content (TPC), total flavonoid content (TFC),
response surface methodology (RSM), extraction.
Classification numbers: 1.1.3, 1.3.1, 1.4.4
1. INTRODUCTION
Phenolic and flavonoid compounds derived from vegetables and plants have gained
attention due to their capability to prevent age-related diseases [1]. These compounds reduce the
oxidative stress by the scavenging of free radicals. The genus Alpinia is an important member of
the Zingiberaceae family. It includes ca. 230 species [2]. Most of them are distributed in tropical
and subtropical Asia, including India, Vietnam, Malaysia, China, and Japan.To date, Alpinia
plants are also broadly used as traditional medicines in India, China, and Japan to treat many
diseases such as indigestion, gastralgia, vomiting, enterozoa, etc.[3, 4]. A. blepharocalyx K.
Nguyen Tan Thanh, Mai Thi Thanh Huyen, Nguyen Ngoc Tuan, Tran Dinh Thang
Schum. is a natural dye [5]. The genus Alpinia contains many groups of substances with
biological activity such as: terpenoids, diarylheptanoids, phenylpropanoids, flavanones,
phenolics, steroids, alkaloids, etc.[6].
Response surface methodology (RSM) is an effective statistical method for optimizing
experimental conditions and investigation of critical processes as well as reducing the number of
experimental trials. RSM helps to define effects of the independent variables, whether it is alone
or combination in the process [7, 8]. One of the most important points in the implementation of
this method is that the predicted values in the model should be verified experimentally. Thus,
RSM is a useful tool for optimizing the technology process over the conventional one-factor-at-a
time approach, which is relatively expensive and time-consuming. In this study, we have
optimized the extraction conditions of total phenolic and total flavonoid from seeds of Alpinia
blepharocalyx because these are two compounds found very much in genus Alpinia (flavonoid
account for 13 %, phenolic account for 12 % of total compounds in genus Alpinia).
2. MATERIAL AND METHODS
2.1. Material
Seeds of Alpinia blepharocalyx were collected in Ky Son District of Nghean Province,
Vietnam in September 2018 and identified by Prof. Dr. Ngo Anh from the Department of
Biology, Hue University. A voucher specimen was deposited at the herbarium of the School of
Chemistry, Biology and Environment, Vinh University. The material was dried, crushed and
stored at -20 oC for further experiments.
2.2. Methods
2.2.1. Total Phenolic Content (TPC)
The TPC of the Alpinia blepharocalyx seeds extracts was measured according to the
method reported by Singleton et al. [9] with a little modification. This method is based on
measuring color change caused by reagent by phenolates in the presence of sodium carbonate. 1
ml of sample was mixed with 5 ml of Folin-Ciocalteu’s solution. After 3 min, 4 ml of 7.5 %
sodium carbonate solution was added to a mixture and adjusted to 10 ml with deionized water.
The mixture was kept at room temperature in a dark environment for 60 min. The color change
was determined by scanning the wavelength at 765 nm (Agilent 8453 UV – Visible
Spectrophotometer) since maximum absorbance was obtained. TPC of the Alpinia blepharocalyx
seeds extract was determined as mg gallic acid equivalent using the standard curve prepared at
different concentrations of gallic acid and reported as mg GAE/g dry weight (DW).
2.2.2. Total Flavonoid Content (TFC)
The TFC of the Alpinia blepharocalyx seed extracts was estimated according to the
procedures described by D. Marinova et al. [10] with slight modification. An aliquot (1 ml) of
extracts or standard solution of catechin (0.01 ÷ 0.07 mg/ml) was added to 10 volumetric flask
containing 4 ml of H2O. To the flask was added 0.3 ml 5 % NaNO2. After 5 min, 0.3 ml 10 %
AlCl3 was added. At 6th min, 2 ml of 1 M NaOH was added and the total volume was made up to
10 ml with H2O. The solution was mixed well and the absorbance was measured against
prepared reagent blank at 510 nm (Agilent 8453 UV-Visible Spectrophotometer). Total
106
Optimization of extraction of total phenolic and total flavonoid from seeds of Alpinia …
flavonoid content of Alpinia blepharocalyx seeds extract was expressed as mg catechin
equivalents mg CE/g DW.
2.2.3. Determination of extraction yield
The method was described by Tian et al. [11] in which the yield of the Alpinia
blepharocalyx seeds extract can be calculated as the following equation:
2.2.4. Experimental design
Before the development of the study by RSM, determination of experimental ranges for
independent variables namely extraction time, extraction temperature, solvent/material ratio and
ethanol concentration were carried out using total phenolic content as a determinant factor.
Then, RSM was used to determine the optimum levels of extraction time (min), temperature
(°C), solvent/material ratio (ml/g) and using other ethanol concentration (%) as extraction
medium on three responses namely, TPC, TFC and Yield in the Alpinia blepharocalyx seeds
extracts. These four factors, namely extraction temperature (X1), extraction time (X2),
solvent/material ratio (X3) and ethanol concentration (X4) were coded into three levels (-1, 0,
+1). The coded independent variables used in the RSM design are shown in Table 1. Ranges of
extraction temperature, extraction time, solvent/material ratio and ethanol concentration and the
central point were selected based on preliminary experimental results. Statistical analysis on the
means of triplicate experiments was carried out using the ANOVA procedure of the design
expert software, version 7.0.
3. RESULTS AND DISCUSSION
3.1. Fitting the models
Table1. Coded level of independent variables used in the RSM design.
Independent variables
Extraction temperature
Extraction time
Solvent/material ratio
Ethanol concentration
Units
°C
min
ml/g
%
Coded
symbols
X1
X2
X3
X4
Coded variable levels
-1
0
+1
50
60
70
100
120
140
30/1
35/1
40/1
30
50
70
The responses consisting of TPC, TFC and yield for Alpinia blepharocalyx seeds extract by
using ultrasonic extraction were optimized based on the Box-Behnken. The Box-Behnken with
four independent variables was used as follows: extraction temperature, extraction time,
solvent/material ratio and ethanol concentration. This design consisted of 27 experimental points
with three replicates at the central point. The input range of the selected variables was
determined by the preliminary experiments (Table 1). Three dependent variables including total
phenolic compounds, total flavonoid compounds and yield were determined following extraction
under optimal conditions. These experimental values were compared with those of the predicted
values to check the validity of the model.
107
Nguyen Tan Thanh, Mai Thi Thanh Huyen, Nguyen Ngoc Tuan, Tran Dinh Thang
The effects of the extraction parameters were evaluated using the program Design-Expert®,
version 7.0.0. The response variable was fitted to be a second- order polynomial model as
follows:
∑
∑
∑∑
where Y is the predicted response; βo is the intercept coefficient; βi is the linear coefficient; βii is
the squared coefficient; βij is the interaction coefficient; Xi and Xj are the coded independent
variables; term of XiXj and Xi2 are the interaction and quadratic terms, respectively.
Table 2. Experimental design and response values.
1
X1
(°C)
60(0)
X2
(min)
120(0)
X3
(ml/g)
40/1(+1)
X4
(%)
30(-1)
TPC
Y1 (mgGAE/g)
29,12
TFC
Y2 (mgCE/g)
6.12
Yield
Y3 (%)
7,09
2
70(+1)
100(-1)
35/1(0)
50(0)
32,71
8.35
6,07
3
60(0)
140(+1)
30/1(-1)
50(0)
38,52
9.48
4,84
4
50(-1)
120(0)
30/1(-1)
50(0)
31,33
6.81
4,35
5
50(-1)
120(0)
35/1(0)
70(+1)
31,18
7.87
5,17
6
60(0)
120(0)
40/1(+1)
70(+1)
34,98
9.84
5,05
7
60(0)
140(+1)
35/1(0)
30(-1)
35,11
9.09
6,38
8
60(0)
120(0)
35/1(0)
50(0)
38,28
11.89
6,78
9
70(+1)
120(0)
40/1(+1)
50(0)
30,37
7.05
6,11
10
50(-1)
140(+1)
35/1(0)
50(0)
32,84
8.69
5,86
11
60(0)
140(+1)
35/1(0)
70(+1)
37,31
11.76
5,97
12
60(0)
100(-1)
35/1(0)
70(+1)
35,76
9.87
4,66
13
60(0)
120(0)
35/1(0)
50(0)
39,89
12.87
6,89
14
70(+1)
120(0)
35/1(0)
70(+1)
38,75
11.29
5,49
15
70(+1)
120(0)
30/1(-1)
50(0)
37,66
10.96
5,42
16
60(0)
100(-1)
40/1(+1)
50(0)
29,79
6.74
5,38
17
60(0)
120(0)
35/1(0)
50(0)
37,16
12.33
7,16
18
70(+1)
120(0)
35/1(0)
30(-1)
29,07
6.83
6,76
19
50(-1)
120(0)
40/1(+1)
50(0)
29,29
6.25
5,89
20
50(-1)
100(-1)
35/1(0)
50(0)
27,74
6.16
4,97
21
50(-1)
120(0)
35/1(0)
30(-1)
30,84
7.45
5,68
22
60(0)
120(0)
30/1(-1)
30(-1)
36,87
8.69
5,21
23
70(+1)
140(+1)
35/1(0)
50(0)
34,08
10.34
6,32
24
60(0)
100(-1)
35/1(0)
30(-1)
29,44
6.42
6,06
25
60(0)
120(0)
30/1(-1)
70(+1)
38,13
11.35
4,72
26
60(0)
100(-1)
30/1(-1)
50(0)
32,09
6.86
5,09
27
60(0)
140(+1)
40/1(+1)
50(0)
31,56
6.31
6,76
RUN
108
Optimization of extraction of total phenolic and total flavonoid from seeds of Alpinia …
The values of the three evaluation indices for each extracting condition were listed in Table
2. At extracting condition: 60 °C, 50 % ethanol and solvent/material ratio is 35/1 ml/g in 120
min, the maximal TPC was 39.89 mg GAE/g and the maximal TFC was 12.87 mg CE/g. Also at
these parameters, the maximal Yield was 7.16 %. From the regression analysis of the 27 data
entries, empirical second-order polynomial models of TPC, TFC and Yield scavenging capacity
were derived (Table 3).
Table 3. Empiric second-order polynomial model of TPC, TFC and Yield.
Response
Model equations
R2
p-value
Y1 – TPC
Y1= 38.44+ 1.62X1+ 1.82X2 – 2.46X3 +2.14X4 - 0.93X1X2 –
1.31X1X3 + 2.34X1X4 – 1.17X2X3 – 1.03X2X4 + 1.15X3X4 – 4.09X12
– 2.71X22 – 2.36X32– 1.51X42
0.9784
<0.0001
Y2 – TFC
Y2= 12.36 + 0.97X1+ 0.94X2 – 0.99X3 + 1.45X4– 0.84X1X3 +
1.01X1X4 – 0.76X2X3– 2.28X12 – 2.03X22 – 2.48X32 – 1.22X42
0.9546
<0.0001
Y3 – Yield
Y3= 6.94 + 0.35X1 + 0.32X2 + 0.55X3 – 0.51X4 - 0.16X1X2 –
0.21X1X3 – 0.19X1X4 + 0.41X2X3 + 0.25X2X4 – 0.39X3X4 – 0.60X12
– 0.56X22 – 0.87X32 – 0.58X42
0.9863
<0.0001
ANOVA analysis results for multiple regression and response surface quadratic model of
Y1, Y2 and Y3 were evaluated using the corresponding p and R2 values (Table 3). F values of Y1,
Y2 and Y3 were calculated to be 38.83; 18.02; 61.67, both leading to a p value < 0.05, suggesting
both the models were statistically significant. The models’ coefficient of determination (R 2)
were 0.9784; 0.9546 and 0.9863, indicating that more than 97.84 %; 95.46 % and 98.63 % of the
response variability were explained, and supporting a good accuracy and ability of the
established model within the range limits used. The F-values of Lack of Fit of Y1, Y2 and Y3 were
0.21; 2.14; 0.40, respectively, implying that the Lack of Fit was not significant relative to the
pure error. This indicated that the accuracy of the polynomial model was adequate.
3.2. Response surface analysis
To visualize the interactions of two operational parameters on extraction efficiency, the
responses were generated as response surfaces (Figure 1, Figure 2 and Figure 3). Two variables
unshown in the Figures were kept constant at their respective central experimental values and
the other two variables presented on the two horizontal axis varied within their experimental
ranges in order to understand their main and interactive effects on the dependent variables.
The X- and Y- axes of the three-dimensional response surfaces represented two factors, for
extraction temperature and extraction time (ethanol concentration 50 %, solvent/material ratio
35/1 ml/g), extraction temperature and solvent/material ratio (extraction time 120 min, ethanol
concentration 60 %), extraction temperature and ethanol concentration (extraction time 120 min,
solvent/material ratio 35/1 ml/g), extraction time and solvent/material ratio (extraction
temperature 60 °C, ethanol concentration 60 %), extraction time and ethanol concentration
(extraction temperature 60 °C, solvent/material ratio 35/1 ml/g), ethanol concentration and
solvent/material ratio (extraction temperature 60 °C, extraction time 120 min). The Z-axes
represented one of the four evaluation indices (TPC, TFC or Yield). Three dimensional response
surfaces were constructed as depicted in Fig. 1, Fig. 2 and Fig. 3.
109
Nguyen Tan Thanh, Mai Thi Thanh Huyen, Nguyen Ngoc Tuan, Tran Dinh Thang
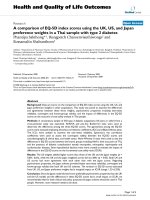
3.2.1. Response surface analysis of total phenolic content
a)
b)
c)
d)
e)
f)
Figure 1. The response surface plot of TPC.
The response surface plots for total phenolic extraction of Alpinia blepharocalyx seeds
extract are shown in Fig. 1 demonstrating the effect and interaction of independent variables on
the yields of total phenolics. As shown in Fig. 1 and Table 4, all of four factors (extraction
temperature, extraction time, ethanol concentration and solvent/material ratio) have showed
negative quadratic effects (p < 0.0001). It can be observed that the yields of total phenolic
content increased with the increase of extraction temperature from 30 °C to 62.33 °C, followed
by a decline thereafter. TPC increases linearly with the increases of extraction time from 100 to
125.44 min and then the TPC level falls slightly when extending extraction time from 125.44 to
140 min. Higher solubility and diffusion coefficient of polyphenols were observed with
increased temperature, allowing more extraction rate [12]. However, an upper limit of
temperature must be respected in order to prevent decomposition of thermo sensitive phenolics
during extraction [8]. The yields of TPC increased with the increase of ethanol concentration
from 30 % v/v to 52 % v/v, and thereafter decreased. This indicated that low to medium
concentrations of ethanol were favorable for extracting phenolic compounds from such plants.
This was due to the addition of ethanol in water which improved the breakage degree of cell
membranes of plant raw material and improved the solubility of phenolic substances [13, 14]. In
the present study, TPC increases linearly with increasing of solvent/material ratio from 40/1 to
30/1 (ml/g). The results of this research are in line with that of Şahin and Şamli [15].
110
Optimization of extraction of total phenolic and total flavonoid from seeds of Alpinia …
Table 4. Regression coefficients of the predicted second- order polynomial models for the total phenolic
content, total flavonoid content and yield.
Y1 – TPC
Source
Y2 – TFC
Y3 – Yield
F- value
p- value
F- value
p-value
F- value
p- value
Model
38.83
<0.0001***
18.02
<0.0001***
61.67
<0.0001***
X1
48.87
<0.0001***
23.82
0.0004***
78.42
<0.0001***
X2
62.09
<0.0001***
22.53
0.0005***
66.04
<0.0001***
X3
112.69
<0.0001***
24.86
0.0003***
192.00
<0.0001***
X4
85.32
<0.0001***
53.57
<0.0001***
162.62
<0.0001***
X1X2
5.41
0.0384*
0.16
0.7006NS
5.34
0.0395*
X1X3
10.71
0.0067**
5.97
0.0310*
9.41
0.0098**
X1X4
33.91
<0.0001***
8.68
0.0122*
7.52
0.0178**
X2X3
8.44
0.0132*
4.95
0.0460*
34.61
<0.0001***
X2X4
6.60
0.0246*
0.32
0.5799NS
12.77
0.0038**
NS
31.29
0.0001***
X3X4
8.23
0.0141*
0.60
X12
0.4544
139.07
<0.0001***
59.16
<0.0001***
99.34
<0.0001***
X2
2
60.85
<0.0001***
46.80
<0.0001***
88.44
<0.0001***
X32
46.34
<0.0001***
69.91
<0.0001***
210.52
<0.0001***
X4
2
18.85
0.0010**
16.80
0.0015**
93.21
<0.0001***
Lack of Fit
0.21
0.9648NS
2.14
0.3603NS
0.40
0.8670NS
R2
0.9784
0.9546
0.9863
*p < 0.05; **p < 0.01; ***p < 0.001; NS: non-significant.
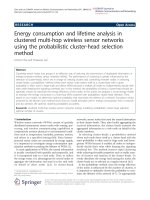
3.2.2. Response surface analysis of total flavonoid content
The mean experimental data has showed the total flavonoid content from Alpinia
blepharocalyx seeds at various extraction conditions in the total range of 6.12÷12.87 mg CE/g of
extract. The highest content of total flavonoid was observed at experimental run number 13
meanwhile the lowest yield of total flavonoid was seen in experimental run number 1. The
ANOVA analysis showed the model F value of 18.02 with probability (p < 0.0001) which
implies that the model is significant and there are only 0.01 % chances that this large F value
could occur due to noise. Total flavonoid content was significantly influenced (p < 0.05) by all
four linear (X1, X2, X3, X4), interaction parameters (X1X3, X1X4, X2X3, and quadratic parameters
(X12, X22, X32, X42) (Table 4). The effect of their variables on the responses can be seen in Fig. 2.
The 3D in Fig. 2a shows the response surface plot of temperature (X1) and time (X2) at
fixed extraction ethanol concentration (50 %) and solvent/material ratio (35/1 ml/g). The 3D
showed extraction temperature observed a weaker effect while extraction time showed a
relatively significant effect on the total flavonoids content. At any level of extraction
temperature, an increase in the yield of flavonoid could be significantly achieved with the
111
Nguyen Tan Thanh, Mai Thi Thanh Huyen, Nguyen Ngoc Tuan, Tran Dinh Thang
increase of extraction time. Thus, the optimum amount of total flavonoid was achieved in this
study at 55÷65 °C and 120÷130 min of extraction time. The results of the present research for
time and temperature were similar compared with Choi et al. [16] studies.
Figure 2c shows the interaction between extraction temperature (X1) and ethanol
concentration (X4) at the fixed extraction ethanol concentration (120 min) and solvent/material
ratio (35/1 ml/g).The 3D plots indicated that extraction temperature and ethanol concentration
exerted significant effect on the total flavonoid content. Statistical analysis reveals that the most
significant factor with p < 0.0001 in total flavonoid was ethanol concentration. Flavonoids and
their glycosides are thought to be efficiently extracted from plant materials by ethanol solvent
[17]. It was observed that the value of total flavonoid content increased when ethanol
concentration was increased from 30 to 70% at fixed 30 °C extraction temperature. Similarly,
increasing the extraction temperature and ethanol concentrations resulted in increased TFC
values.
The 3D Fig. 2b, 2d, 2e showed the effect of solvent/material ratio to the total flavonoid
content. The yields of total flavonoid content increased when the solvent/material ratio
decreased from 40/1 to 30/1 (ml/g). The results of this research are in line with that of Yingngam
et al. [18].
a)
b)
c)
d)
e)
f)
Figure 2. The response surface plot of TFC.
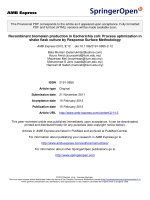
3.2.2. Response surface analysis of yield
Figure 3a–f showed three-dimension surface plots describing the relationship between
independent and dependent variables for yield from Alpinia blepharocalyx seeds extract. Ethanol
concentration, extraction temperature, time and solvent/material ratio showed negative quadratic
112
Optimization of extraction of total phenolic and total flavonoid from seeds of Alpinia …
effects on the yield from Alpinia blepharocalyx seeds extract (Table 4, p < 0.05). The presence
of an appropriate water content in the extraction solvent also enhanced swelling of plant
material, followed by increased extraction yield. Thus, factor of ethanol concentration
contributes significant effects on extraction yield. The solvent/material ratio exhibited a weaker
effect on the extraction yield. In this study, when increasing the solvent/material ratio, extraction
yield was improved. However, excessive addition of solvent could result in larger cost due to
increased energy consumption for solvent removal.
a)
b)
c)
d)
e)
f)
Figure 3. Response surface plot of yield.
3.3. Optimization and model verification
The optimal values of the independent variables were obtained by solving second - order
regression equations using a numerical optimization method. Experimental data suggested that
the highest total phenolic content, total flavonoid content and yield occurred with
solvent/material ratio 34.48 ml/g, 52.66 % v/v ethanol for 125.42 min at 62.34 °C. Table 5
shows the predicted and experimental values for the extraction of target compounds from
Alpinia blepharocalyx seeds. The actual values obtained from the experimental gave the
extraction yields of total phenolic, total flavonoid and yield as 39.31 ± 0.05 mgGAE/g, 12.75 ±
0.07 mgCE/g and 6.79 ± 0.05 %. These experimental values were close to the predicted values
(TPC = 39.4 mgGAE/g, TFC = 12.87 mgCE/g and Yield = 6.8875 %) derived from the
respective regression models with the CV ranging from 0.23 % to 1.13 %.
113
Nguyen Tan Thanh, Mai Thi Thanh Huyen, Nguyen Ngoc Tuan, Tran Dinh Thang
Table 5. Optimum conditions, predicted and experimental values of responses on extraction of
Alpinia blepharocalyx seeds extracta.
Independent variables
X1
62.34
X2
125.42
X3
34.48/1
X4
52.66
Dependent
variables
(Response)
Experimentalb
Predicted
% Difference
(CV)
Y1
39.31 ± 0.05
39.4042
0.23
Y2
12.75 ± 0.07
12.8701
0.93
Y3
6.79 ± 0.05
6.8875
1.13
a
X1, extraction temperature (°C); X2, extraction time (min); X3, solvent/material ratio (ml/g);X4, ethanol
concentration (%); Y1, TPC (mgGAE/g); Y2, TFC (mgCE/g); Y3, Yield (%). bMean ± standard deviation
(SD) of four determinations (n= 4) from two crude extract replications.
4. CONCLUSION
Response surface methodology was successfully used to optimized the process of
extracting Alpinia blepharocalyx seeds extract with the optimal parameters: solvent/material
ratio 34.48 ml/g, ethanol concentration 52.66 % v/v, extraction temperature 62.34 °C and
extraction time 125.42 min. Under the optimum conditions, the experimental values of TPC,
TFC and yield were 39.31 ± 0.05 mg GAE/g, 12.75 ± 0.07 mg CE/g and 6.79 ± 0.05 %. This
study can be useful in the development of industrial extraction process.
Acknowledgments. The authors gratefully acknowledge grant from the Ministry of Education and
Training (MOET), Vietnam (No. B2018-TDV-09).
REFERENCES
1.
Lin D., Xiao M, Zhao J., Li Z., Xing B., Li X., Kong M., Li L., Zhang Q., Liu Y., Chen
H., Qin W., Wu H. and Chen S. - An overview of plant phenolic compounds and their
importance in human nutrition and management of type 2 diabetes, Molecules 21 (2016)
1374-1392.
2.
Wu Z. Y., Raven P. H. - Flora of China (Flagellariaceae through Marantaceae), Science
Press, Beijing 24 (2000) 333.
3.
Itokawa H., Morita H. and Watanabe K. - Novel Eudesmane-Type Sesquiterpenes from
Alpinia japonica (Thunb.) MIQ, Chem. Pharm. Bull. 35 (1987) 1460-1463.
4.
Roy B. and Swargiary A. - Anthelmintic efficacy of ethanolic shoot extract of
Alpinianigra on tegumental enzymes of Fasciolopsis buskin, a giant intestinal parasite, J.
Parasite. Dis. 33 (2009) 48-53.
5.
Wang C., Xu C., Tian A., Fu S. and Wang C. - Extraction of natural dyes from
Alpiniablepharocalyx K. Schum. for dyeing of silkfabric, Color. Technol. 129 (2013) 32-38.
6.
Ma X. N., Xie C. L., Miao Z., Yang Q. and Yang X. W. - An overview of chemical
constituents from Alpinia species in the last six decades, RSC Adv. 7 (2017) 14114–
14144.
114
Optimization of extraction of total phenolic and total flavonoid from seeds of Alpinia …
7.
Bas D. and Boyaci I. H. - Modeling and optimization I: usability of response surface
methodology, J Food Eng. 78 (2007) 836–845.
8.
Silva E. M., Rogez H. and Larondelle Y. - Optimization of extraction of phenolics from
Inga edulis leaves using response surface methodology, Separ. Purif. Technol. 55 (2007)
381–387
9.
Singleton V. L., Orthofer R. and Lamuela-Raventos R. M. - Analysis of total phenols and
other oxidation substrates and antioxidants by means of Folin-Ciocalteu reagent, Meth.
Enzymol. 299 (1999) 152-178.
10. Marinova D., Ribarova F. and Atanassova M. - Total phenolics and total flavonoid in
Bulgarian fruits and vegetables, J. Univ. Chem. Tech. Metallurg. 40 (3) (2005) 255-260.
11. Tian Y., Zeng H., Xu Z., Zheng B., Lin Y. and Gan C. - Ultrasonic-assisted extraction
and antioxidant activity of polysaccharides recovered from white button mushroom
(Agaricusbosporus), Carbohyd. Polym. 88 (2012) 522-529.
12. Cacace J. E. andMazza G. - Mass transfer process during extraction of phenolic
compounds from mixed berries, J. Food Eng. 59 (2003) 379–389.
13. Yang B., Liu X. and Gao Y. - Extraction optimization of bioactive compounds (crocin,
geniposide and total phenolic compounds) from Gardenia (Gardenia jasminoides Ellis)
fruits with response surface methodology, Innov. Food Sci. Emerg. Technol. 10 (2009)
610–615.
14. Gong Y., Hou Z., Gao Y., Xue Y., Liu X. and Liu G. - Optimization of extraction
parameters of bioactive components from defatted marigold (Tageteserecta L.) residue
using response surface methodology, Food Bioprod. Process. 90 (2012) 9–16.
15. Şahin S. and Şamlı R. - Optimization of olive leaf extract obtained by ultrasound-assisted
extraction with response surface methodology, Ultrason. Sonochem. 20 (2013) 595–602.
16. Choi W. Y., Jeong M. H. and Lee H. Y. - Optimization of extraction process for
enhancement of antioxidant activity of Acer mono bark, J. Appl Bot. Food Qual. 87
(2013) 46-55.
17. Bazykina N. I., Nikolaevskii A. N., Filippenko T. A. and Kolerva V. G. - Optimization of
conditions for the extraction of natural antioxidants from raw plant materials, Pharm
Chem J. 36 (2002) 46–49.
18. Yingngam B., Supaka N. and Rungseevijitprapa W.- Optimization of process parameters
for phenolics extractionof Cratoxylumformosum ssp. formosum leaves by response surface
methodology, J. Food Sci. Technol. 52 (1) (2013) 129-140.
115