Evaluation of proteins in sheep colostrum via laser-induced breakdown spectroscopy and multivariate analysis
Bạn đang xem bản rút gọn của tài liệu. Xem và tải ngay bản đầy đủ của tài liệu tại đây (1.55 MB, 7 trang )
����������������������������������������������������������������������������������������������������������������������������������������������������������������������������������������������������������������������������������������������������������������������������������������������������������������������������������������������������������������������������������������������������������������������������������������������������������������������������������������������������������������������������������������������������������������������������������������������������������������������������������������������������������������������������������������������������������������������������������������������������������������������������������������������������������������������������������������������������������������������������������������������������������������������������������������������������������������������������������������������������������������������������������������������������������������������������������������������������������������������������������������������������������������������������������������������������������������������������������������������������������������������������������������������������������������������������������������������������������������������������������������������������������������������������������������������������������������������������������������������������������������������������������������������������������������������������������������������������������������������������������������������������������������������������������������������������������������������������������������������������������������������������������������������������������������������������������������������������������������������������������������������������������������������������������������������������������������������������������������������������������������������������������������������������������������������������������������������������������������������������������������������������������������������������������������������������������������������������������������������������������������������������������������������������������������������������������������������������������������������������������������������������������������������������������������������������������������������������������������������������������������������������������������������������������������������������������������������������������������������������������������������������������������������������������������������������������������������������������������������������������������������������������������������������������������������������������������������������������������������������������������������������������������������������������������������������������������������������������������������������������������������������������������������������������������������������������������������������������������������������������������������������������������������������������������������������������������������������������������������������������������������������������������������������������������������������������������������������������������������������������������������������������������������������������������������������������������������������������������������������������������������������������������������������������������������������������������������������������������������������������������������������������������������������������������������������������������������������������������������������������������������������������������������������������������������������������������������������������������������������������������������������������������������������������������������������������������������������������������������������������������������������������������������������������������������������������������������������������������������������������������������������������������������������������������������������������������������������������������������������������������������������������������������������������������������������������������������������������������������������������������������������������������������������������������������������������������������������������������������������������������������������������������������������������������������������������������������������������������������������������������������������������������������������������������������������������������������������������������������������������������������������������������������������������������������������������������������������������������������������������������������������������������������������������������������������������������������������������������������������������������������������������������������������������������������������������������������������������������������������������������������������������������������������������������������������������������������������������������������������������������������������������������������������������������������������������������������������������������������������������������������������������������������������������������������������������������������������������������������������������������������������������������������������������������������������������������������������������������������������������������������������������������������������������������������������������������������������������������������������������������������������������������������������������������������������������������������������������������������������������������������������������������������������������������������������������������������������������������������������������������������������������������������������������������������������������������������������������������������������������������������������������������������������������������������������������������������������������������������������������������������������������������������������������������������������������������������������������������������������������������������������������������������������������������������������������������������������������������������������������������������������������������������������������������������������������������������������������������������������������������������������������������������������������������������������������������������������������������������������������������������������������������������������������������������������������������������������������������������������������������������������������������������������������������������������������������������������������������������������������������������������������������������������������������������������������������������������������������������������������������������������������������������������������������������������������������������������������������������������������������������������������������������������������������������������������������������������������������������������������������������������������������������������������������������������������������������������������������������������������������������������������������������������������������������������������������������������������������������������������������������������������������������������������������������������������������������������������������������������������������������������������������������������������������������������������������������������������������������������������������������������������������������������������������������������������������������������������������������������������������������������������������������������������������������������������������������������������������������������������������������������������������������������������������������������������������������������������������������������������������������������������������������������������������������������������������������������������������������������������������������������������������������������������������������������������������������������������������������������������������������������������������������������������������������������������������������������������������������������������������������������������������������������������������������������������������������������������������������������������������������������������������������������������������������������������������������������������������������������������������������������������������������������������������������������������������������������������������������������������������������������������������������������������������������������������������������������������������������������������������������������������������������������������������������������������������������������������������������������������������������������������������������������������������������������������������������������������������������������������������������������������������������������������������������������������������������������������������������������������������������������������������������������������������������������������������������������������������������������������������������������������������������������������������������������������������������������������������������������������������������������������������������������������������������������������������������������������������������������������������������������������������������������������������������������������������������������������������������������������������������������������������������������������������������������������������������������������������������������������������������������������������������������������������������������������������������������������������������������������������������������������������������������������������������������������������������������������������������������������������������������������������������������������������������������������������������������������������������������������������������������������������������������������������������������������������������������������������������������������������������������������������������������������������������������������������������������������������������������������������������������������������������������������������������������������������������������������������������������������������������������������������������������������������������������������������������������������������������������������������������������������������������������������������������������������������������������������������������������������������������������������������������������������������������������������������������������������������������������������������������������������������������������������������������������������������������������������������������������������������������������������������������������������������������������������������������������������������������������������������������������������������������������������������������������������������������������������������������������������������������������������������������������������������������������������������������������������������������������������������������������������������������������������������������������������������������������������������������������������������������������������������������������������������������������������������������������������������������������������������������������������������������������������������������������������������������������������������������������������������������������������������������������������������������������������������������������������������������������������������������������������������������������������������������������������������������������������������������������������������������������������������������������������������������������������������������������������������������������������������������������������������������������������������������������������������������������������������������������������������������������������������������������������������������������������������������������������������������������������������������������������������������������������������������������������������������������������������������������������������������������������������������������������������������������������������������������������������������������������������������������������������������������������������������������������������������������������������������������������������������������������������������������������������������������������������������������������������������������������������������������������������������������������������������������������������������������������������������������������������������������������������������������������������������������������������������������������������������������������������������������������������������������������������������������������������������������������������������������������������������������������������������������������������������������������������������������������������������������������������������������������������������������������������������������������������������������������������������������������������������������������������������������������������������������������������������������������������������������������������������������������������������������������������������������������������������������������������������������������������������������������������������������������������������������������������������������������������������������������������������������������������������������������������������������������������������������������������������������������������������������������������������������������������������������������������������������������������������������������������������������������������������������������������������������������������������������������������������������������������������������������������������������������������������������������������������������������������������������������������������������������������������������������������������������������������������������������������������������������������������������������������������������������������������������������������������������������������������������������������������������������������������������������������������������������������������������������������������������������������������������������������������������������������������������������������������������������������������������������������������������������������������������������������������������������������������������������������������������������������������������������������������������������������������������������������������������������������������������������������������������������������������������������������������������������������������������������������������������������������������������������������������������������������������������������������������������������������������������������������������������������������������������������������������������������������������������������������������������������������������������������������������������������������������������������������������������������������������������������������������������������������������������������������������������������������������������������������������������������������������������������������������������������������������������������������������������������������������������������������������������������������������������������������������������������������������������������������������������������������������������������������������������������������������������������������������������������������������������������������������������������������������������������������������������������������������������������������������������������������������������������������������������������������������������������������������������������������������������������������������������������������������������������������������������������������������������������������������������������������������������������������������������������������������������������������������������������������������������������������������������������������������������������������us different milking times of the same samples under investigation.
Application of PCA on the obtained LIBS spectral data
As mentioned above, the obtained LIBS spectra were statistically processed with the PCA chemometric method. To reduce
the number of variables, and consequently improve the discrimination procedure of the used multivariate analysis technique, the
analyzed LIBS spectral data was restricted to three ranges of the
wavelength. The first wavelength range was from 200 nm to 250
nm, covering the carbon 247.86 nm atomic line, the second is from
385 nm to 390 nm, which includes the CN bands (386.15, 387.12
and 388.31 nm), while the third range was from 392 nm up to
431 nm, covering many major calcium lines (393.37, 396.85,
422.67, 428.3, 429.89, 430.77 nm, . . . etc.). To improve the discrimination of the PCA technique, the three spectral ranges have been
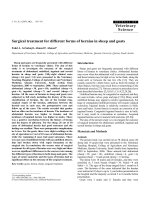
merged. Fig. 7 (upper) depicts the PCA score plot results which
demonstrate the distinction between colostrum and mature milk
adopting the whole spectral range. While Fig. 7 (lower) shows
the PCA plot for the merged three spectral ranges.
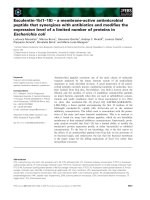
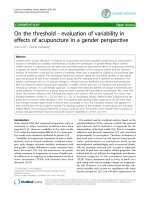
Fig. 4. Trends of normalized intensity values for CN, C2 emission bands and Ca line for sheep colostrum and milk at different milking times versus total protein (%).
Z.A. Abdel-Salam et al. / Journal of Advanced Research 15 (2019) 19–25
23
Discussion
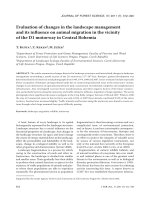
Fig. 6. Correlation curve for CN normalized intensity values versus the total protein
(%). The solid line is the linear fitting of the experimental points [C (%) = 0.1152 I +
0.1198]. The error bars are the standard deviation of the data.
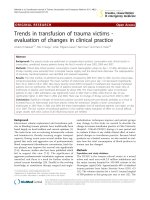
Fig. 7. PCA analysis for colostrum and milk of sheep for the whole spectral range
200 nm to 750 nm (upper), and merging the three spectral ranges 200–250 nm,
385–390 nm, and 392–431 nm (lower).
CN and C2 molecular bands, as well as one carbon spectral line,
which are relevant to the organic contents in the samples, have
been chosen to be followed up in LIBS spectra in view of the previously published works [6,13,15,19]. It is well known that CN
and C2 molecular bands in LIBS spectra can be used in many kinds
of research to detect and monitor some molecules containing carbon and nitrogen such as proteins [6,13,17]. Therefore, it is possible to evaluate proteins in milk through the presence of CN, and
C2 bands as well as the carbon line in the LIBS spectra of both
colostrum and milk samples. The present results indicated that
CN and C2 emission bands have a higher intensity in colostrum
than in mature milk samples as shown in Fig. 1. In fact, LIBS
results cannot differentiate between different types of protein,
but it can be useful in evaluating the total protein in colostrum
and mature milk samples considering CN and C2 relative intensities in relevant spectra [1,2]. Similarly, the relative intensity of
carbon atomic lines in the LIBS spectra can be used in combination with CN and C2 bands, as indicators of the proteins in the
investigated colostrum and milk samples (see the inset in
the lower Fig. 1). Within the first hours after parturition, the
colostrum contains high concentrations of protein substances,
especially, immunoglobulins. In fact, it has been found that the
content of free peptides and amino acids are high in the
colostrum of all mammals [24]. In the current study, the intensity
values of CN and C2 as indicators of protein content within the
first three days (first, second and third milking) after postpartum
and the mature milk (in the 7th day) are shown in Fig. 3. Significantly high values of the protein concentrations show up in
colostrum (1st milking) followed by lower values for the second,
third milking and finally mature milk.
To validate the LIBS results, total proteins have been measured
conventionally for all samples. Fig. 4 shows the proportionality
between the CN and C2 intensities in the LIBS spectra and the total
protein content. This supports the use of such molecular bands as
indicators of the protein in the investigated samples. On the other
hand, casein which is a major protein component in milk is accompanied by a high concentration of calcium [25]. In the same Fig. 4,
this correlation between total protein (including casein) and calcium content in the colostrum and milk samples has been clearly
demonstrated.
According to Roig et al. [25] and Thapa [26] immunoglobulins
(IgG) are essentially required for newborns to ensure the specific
antimicrobial activity (mainly to prevent probable infections). It
is clear that transfer of immunoglobulins to lambs through colostrum takes place directly after parturition. In the present study,
it has been shown (Fig. 5) that, the higher is the CN intensity the
lower is the total bacterial count in colostrum and sheep milk
samples and vice versa. It should be mentioned that colostrum
and milk contain high levels of lactoferrin which has inhibition
effects on bacteria, viruses, and parasites [27–29]. The very high
affinity of lactoferrin for iron is relevant to its function against such
microorganisms. In fact, lactoferrin can be considered as part of the
immune system because of its effects on pathogens growth [30].
This antibacterial mechanism justifies clearly the results depicted
in Fig. 5. It is, in principle, possible to determine the concentration
of the proteins in any colostrum or milk sample by measuring the
normalized intensity of the CN band in its LIBS spectrum. This can
be done by making use of the linear relation depicted in Fig. 6
between the CN normalized intensity and the corresponding proteins concentration measured conventionally. Using a portable
LIBS system it is, of course, possible to evaluate the protein in
colostrum or milk samples in situ, i.e. in dairy or animal production
farms for example.
24
Z.A. Abdel-Salam et al. / Journal of Advanced Research 15 (2019) 19–25
Principal component analysis (PCA) can be exploited for the
identification of similarities and dissimilarities in measured data.
Consequently, it is possible to utilize the factor score plots for
the elucidation of similar or different experimental data. The
results shown in Fig. 7 demonstrate that the spectral data collected
from LIBS measurements combined with PCA as a chemometric
method could become an interesting tool to evaluate sheep colostrum. Fig. 7 confirms the spectroscopic results and indicates that
the changes in the composition, either in the protein (including
casein, lactoferrin . . . etc.) or in the calcium content, can be
exploited by the PCA multivariate statistical approach to distinguish between colostrum and mature milk. PCA led to a good discrimination, in Fig. 7 (upper), PC1 and PC2 represent 80.8% of the
total variance for the whole spectral wavelength range (200–750 nm)
with PC1 = 62.1% & PC2 = 18.7%. However, merging three spectral
ranges, 200 nm to 250 nm including the carbon line, 385–390 nm
covering the CN band, and 392 nm up to 431 nm which contains
many calcium spectral lines, led to a pronounced improvement
in the discrimination between colostrum and milk where the
principal components represent 95.8% of the total data variance
with PC1 and PC2 equal 76.2% and 19.6% respectively (Fig. 7 lower).
It is clear that exploiting the merged three wavelength ranges in
PCA is superior in the discrimination between colostrum and milk
than PCA using the whole spectral wavelength range,
However, in view of the obtained results, LIBS as spectrochemical analytical technique, combined with multivariate analysis
using PCA can be considered as a promising, fast, reliable and accurate approach for real-time and in situ evaluation of colostrum and
milk. It should be also mentioned here, that laser-induced fluorescence (LIF) has been used successfully in a previous work to evaluate colostrum [31]. This demonstrates that both LIBS and LIF are
privileged available spectrochemical analytical techniques for the
evaluation of colostrum and milk.
Conclusions
In conclusion, this study demonstrated that spectrochemical
and multivariate analysis can be used successfully for evaluating
proteins in sheep colostrum. Compared to the conventional techniques used in similar studies, LIBS is fast, safe, simple and can
be used in situ. Proteins have been evaluated using the molecular
bands of CN and C2 as well as the carbon line at 247.86 nm in
the LIBS spectra of colostrum and milk. The resemblance of calcium
and proteins trends in sheep milking samples has been also
demonstrated using LIBS. In addition, it has been shown that
higher proteins concentration means higher lactoferrin and consequently lower bacterial count. The proportionality between the
normalized intensity of the CN band and the concentration of the
proteins can be used for the quantification of proteins in any
unknown colostrum/milk sample. The multivariate analysis of
the obtained analytical data using PCA provided satisfactory discrimination between colostrum and mature milk. This result has
been reached in cases of using the spectral ranges including the
carbon line and CN bands or that encompassing the calcium spectral emission lines. The experimental approach using typical LIBS
setup is simple, fast and needs no or very little sample preparation.
Besides, the PCA multivariate technique is also trustworthy, simple
and does not need complicated statistical calculations. It is, in general, possible to make use of portable LIBS system and proper software for PCA in dairy farms to evaluate sheep colostrum in order to
plan the nutritional strategies for the lambs.
Conflict of interest
The authors have declared no conflict of interest.
Compliance with Ethics Requirements
This article does not contain any studies with human or animal
subjects.
References
[1] Csapo JJ, Keszthelyil T, Csapo-Kiss Z, Lengyel A, Andrassy- Baka B, Varga-Visi E.
Composition of colostrum and milk of different breeds of ewes. Acta Agraria
Kaposvariensis 1998;2:1–21.
[2] El-Hommosi FF, Abd El-Ati MN, Mousa MT, Hamdon HAM, Shelab MM, ElTahlawy R, et al. Quantitative studies in some colostrum and blood
components of Chios and Egyptian Oasis (Farafra) sheep. Eighth Sci Congr
1998:558–73.
[3] Abd-El-Gawad IA, El-Sayed EM, Mahfouz MB, Abd-El-Salam AM. Changes of
lactoferrin concentration in colostrum and milk from different species Egypt. J
Dairy Sci 1996;24:297–308.
[4] Hadjipanayiotou M. Composition of ewe, goat and cow milk and of colostrum
of ewes and goats. Small Ruminant Res 1995;1995(18):255–62.
[5] Campana WM, Baumrucker CR. Hormones and growth factors in bovine milk.
In: Jensen RG (Eds.), Handbook of Milk Composition. San Diego, Academic
Press; 1995. P. 467–494.
[6] Abdel-Salam Z, Abdelghany S, Harith MA. Characterization of milk
from mastitis-infected cows using laser-induced breakdown spectrometry as
a molecular. Analytical technique. Food Anal Methods 2017;10:2422–8.
[7] Rauprich ABE, Hammon HM, Blum JW. Influence of feeding different amounts
of first colostrum on metabolic, endocrine and health status and on growth
performance in neonatal calves. Anim Sci J 2000;78:896–908.
[8] Pattinson SE, Davies DAR, Winter AC. Changes in the secretion rate and
production of colostrum by ewes over the first 24 h postpartum. Animal Sci
1995;61:63–8.
[9] Hashemi M, Zamiri MJ, Safdarian M. Effects of nutritional level
during
late
pregnancy
on
colostral
production
and
blood
immunoglobulin levels of Karakul ewes and their lambs. Small Ruminant Res
2008;75:204–9.
[10] Ahmad R, Khan A, Javed MT, Hussain I. The level of immunoglobulins in
relation to neonatal lamb mortality in Pak-Karakul sheep. Vet Arhiv
2000;3:129–39.
[11] Tabatabaei S, Nikbakht G, Vatankhah M, Sharifi H, Alidadi N. Variation in
colostral immunoglobulin G concentration in fat tailed sheep and evaluation of
methods for estimation of colostral immunoglobulin content. Acta Veterinaria
Brno 2013;82:271–5.
[12] Miziolek M, Palleschi V, Schechter I. Laser-induced breakdown spectroscopy
(LIBS) fundamentals and applications. Cambridge; 2006.
[13] Abdel-Salam Z, Abdel-Salam SAM, Harith MA. Application of laser
spectrochemical analytical techniques to follow up spoilage of white meat in
chicken. Food Anal Methods 2017;10:2365–72.
[14] Abdel-Salam Z, Harith MA. Laser spectrochemical characterization of semen.
Talanta 2012;15:140–5.
[15] Kasem MA, Russo RE, Harith MA. Influence of biological degradation and
environmental effects on the interpretation of archaeological bone samples
with laser-induced breakdown spectroscopy. J Anal Atom Spectrom
2011;26:1733–9.
[16] Bilge G, Sezer B, Efe Eseller K, Berberoglu H, Topcu A, Hakki Boyaci I.
Determination of whey adulteration in milk powder by using laser-induced
breakdown spectroscopy. Food Chem 2016;212:183–8.
[17] Moncayo S, Manzoor S, Rosales JD, Anzano J, Caceres JO. Qualitative and
quantitative analysis of milk for the detection of adulteration by Laser-Induced
Breakdown Spectroscopy (LIBS). Food Chem 2017;232:322–8.
[18] Elnasharty YI, Kassem AK, Sabsabi M, Harith MA. Diagnosis of lubricating oil by
evaluating cyanide and carbon molecular emission lines in laser-induced
breakdown spectra. Spectrochim Acta B 2011;66:588–93.
[19] Abdel-Salam Z, Al Sharnoubi J, Harith MA. Qualitative evaluation of
maternal milk and commercial infant formulas via LIBS. Talanta
2013;115:422–6.
[20] Khalil OM, Mingareev I, Bonhoff T, Richardson MC, Harith MA. Studying the
effect of zeolite inclusion in aluminum alloy on measurement of its surface
hardness using laser-induced breakdown spectroscopy technique. Opt Eng
2014;53:014106.
[21] Tegegne B, Tesfaye S. Bacteriological milk quality: possible hygienic factors
and the role of Staphylococcus aureus in raw bovine milk in and around
Gondar. Ethiopia Int J Food Contam 2017;4:1–9.
[22] Welearegay H, Yilma Z, Tekle-Giorgis Y. Hygienic practices and microbiological
quality of raw milk produced under different farm size in Hawassa, southern
Ethiopia. Agric Res Rev 2012;4:132–42.
[23] Armonk NY. IBM Corp. Released. IBM SPSS Statistics for Windows, Version
21.0.: IBM 484 Corp; 2012.
[24] Saito T, Yoshida T, Itoh T. Composition of free form glycopeptides isolated from
bovine colostrum. Int Dairy J 1993;3:129–39.
[25] Roig MJ, Alegría A, Barbera R, Farré R, Lagarda MJ. Calcium dialysability as an
estimation of bioavailability in human milk, cow milk and infant formulas.
Food Chem 1999;64:403–9.
[26] Thapa BR. Health factors in colostrum. Indian J Pediatr 2005;72:579–81.
Z.A. Abdel-Salam et al. / Journal of Advanced Research 15 (2019) 19–25
[27] Baker EN, Baker HM. A structural framework for understanding the
multifunctional character of lactoferrin. Biochimie 2009;91:3–10.
[28] Anderson BF, Baker HM, Norris GE, Rice DW, Baker EN. Structure of human
lactoferrin: crystallographic structure analysis and refinement at 2.8 A
resolution. J Mol Biol 1989;209:711–34.
[29] Baker EN, Lindley PF. New perspectives on the structure and function of
transferrins. J Inorg Biochem 1992;47:147–60.
25
ˇ oz-Robles V, Cuesta R, Gálvez N, Capdevila M, Maréchal J, et al.
[30] Carmona F, Mun
Monitoring lactoferrin iron levels by fluorescence resonance energy transfer: a
combined chemical and computational study. JBIC 2014;19:439–47.
[31] Abdel-Salam Z, Abdel-Salam SAM, Abdel-Mageed II, Harith MA. Assessment of
sheep colostrum via laser induced fluorescence and chemometrics. Small
Ruminant Res 2017;155:51–6.