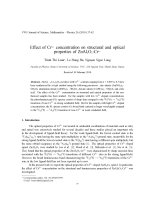
Characteristics and optical properties of Fe3 doped Sio2 Tio2 thin films prepared by the sol-gel dip-coating method
Bạn đang xem bản rút gọn của tài liệu. Xem và tải ngay bản đầy đủ của tài liệu tại đây (683.13 KB, 9 trang )
Science & Technology Development, Vol 16, No.K1- 2013
CHARACTERISTICS AND OPTICAL PROPERTIES OF Fe3+ DOPED SiO2/TiO2
THIN FILMS PREPARED BY THE SOL-GEL DIP-COATING METHOD
Dang Mau Chien, Le Duy Dam, Nguyen Thi Thanh Tam and Dang Thi My Dung
Laboratory for Nanotechnology, Vietnam National University, Ho Chi Minh City
(Manuscript Received on April 5th, 2012, Manuscript Revised May 15th, 2013)
ABSTRACT: In this study, we have successfully synthesized Fe3+ doped SiO2/TiO2 thin films on
glass substrates using the sol-gel dip-coating method. After synthesizing, the samples were annealed at
5000C in the air for 1 hour. The characteristics and optical properties of Fe3+ doped SiO2/TiO2 films
were then investigated by X-ray diffraction (XRD), ultraviolet-visible spectroscopy (UV-vis) and
Fourier transform infrared spectroscopy (FT-IR). An antifogging ability of the glass substrates coated
with the fabricated film is investigated and explained by a water contact angle under visible-light. The
analyzed results also show that the crystalline phase of TiO2 thin films comprised only the anatase TiO2 ,
but the crystalline size decreased from 8.8 to 5.9 nm. We also observed that the absorption edge of Fe3+doped SiO2/TiO2 thin films shifted towards longer wavelengths (i.e. red shifted) from 371.7nm to 409.2
nm when the Fe3+-doped concentration increased from 0 to 1 % mol.
could be explained by the addition of SiO2 into
1. INTRODUCTION
TiO2 retarding or inhibiting the crystallization
Titanium dioxide (TiO2) is a nontoxic
material and has been applied in environmental
treatments such as water and air purification,
water disinfection and sterilization because of
of anatase phase. A contact angle of SiO2/TiO2
thin films with 15 mol % SiO2 concentrations is
less than 20 and these films can maintain a
super-hydrophilic property for a long time in
Its unique properties such as strong
dark conditions, thus exhibiting excellent
photocatalytic activity and chemical stability
antifogging capabilities [3]. In this paper we
[1]. However, the major limitations of TiO2 are
focused
the absorption region in the UV light (about
activity of SiO2/TiO2 films in the visible light
4%
fast
region. Transition metal ions and noble metals
recombination of hole–electron pairs within
have been employed to dope into TiO2 in order
nanoseconds. To propose using TiO2 to the
to induce a red shift in the absorption band [4,
coating on the ceramic tiles and glass to make
5]. Among these metals, iron has been
intelligent materials was being able self-
considered to be an appropriate candidate
cleaning and antibacterial. In our previous
owing to its radius of Fe3+ (0.64 Å) is similar to
papers [2, 3] we have reported the influence of
that of Ti4+ (0.68 Å), therefore, it can be
doping
inferred that Fe3+ ions might easily incorporate
-
5%
of
SiO2
solar
was
energy)
exhibited
and
higher
photocatalytic activity than pure TiO2. This
Trang 92
on
improving the photocatalytic
TAẽP CH PHAT TRIEN KH&CN, TAP 16, SO K1- 2013
into the crystal lattice of TiO2. Furthermore,
3+
Fe
-
isopropyl Ortho-titanate Ti (OC3H7)4 (TIPOT-
3+
Merk), Tetra-ethoxyortho-silicate Si(OC2H5)4
ions can play a role as e /h pair traps
2+
because the energy level of Fe /Fe lies close
3+
4+
to that of Ti /Ti , favoring the separation of
the
-
photo-generated
e /h
-
+
The following chemicals were used: Tetra-
+
pair,
and
+
(TEOS-Merck), Ethanol C2H5-OH (Merck),
HCl-Hydrochloric
acid
(China),
consequently reducing e /h pair recombination
Iron(III)Nitrate
Fe(NO3)3.9H2O (Merck), DI
rate [6,10].
water. The synthesis process of the Fe-doped
SiO2/TiO2 solution is shown in Figure 1.
2. EXPERIMENTAL
Figure 1. The synthesis process of the Fe3+-doped SiO2/TiO2 solution prepared soil-gel method
The volume of H2O containing 1 wt% HCl
can be determined by the formula:
acetone and absolute ethanol for 30 min,
respectively. Finally, they were thoroughly
rinsed with DI water.
(1)
The substrates were immersed into as-
In this report, we synthesized the Fe3+-
prepared Fe-doped SiO2/TiO2 sol for 30
doped SiO2/TiO2 coating solution with various
seconds. The substrates were then withdrawn
Fe/(SiO2+TiO 2) molar ratios: from 0 to 1%.
from the sol with velocity 5 mm/s. If coating
The Fe3+-doped SiO2/TiO2 thin lms were
two times or more, each layer would be dried
deposited on glass substrates by a dip coating
between two successive coatings at 2300C for 5
process at room temperature. Glass slides with
min before the next coating was implemented.
dimensions of (26x76) mm2 were used as
Afterward, the substrates were annealed at
substrates. Before the deposition, the substrates
5000C for 1 h. X-ray diffraction (XRD)
were ultrasonically cleaned in dilute HCl,
patterns
of these powder samples were
Trang 93
Science & Technology Development, Vol 16, No.K1- 2013
measured with a diffractometer (D8 Advance).
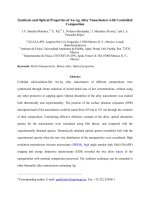
and reach almost near zero at about 300 nm.
An atomic force microscope (AFM-Electronica
The transmittance quickly decreases when
S.L) was used to investigate the crystallization
below 350 nm due to the absorption of light
and surface structure. Synthesized samples
caused by the excitation of electrons from the
were also studied using UV–VIS absorption
valence band to the conduction band of TiO2.
spectra with UV-VIS equipment (Cary 100
The absorption edge shifted towards longer
Conc)-spectrophotometer
wavelengths (i.e. red shifted) from 350 to 410
in
a
wavelength
nm
transform
(FTIR)
increasing from 0 to 1% mol. Red shift
TensorTM 37 (Bruker) in the range 400-4000
associated with the presence of dopants can be
−1
cm
infrared
spectroscopy
by the KBr pellet technique.
with
the
Fe3+-doped
range from 200 to 800 nm, and Fourier
concentration
attributed to a charge transfer transition
between the iron d electrons and the TiO2
3. RESULTS AND DISCUSSION
conduction or valence band [7], [11]. With this
result, this material system can be applied to
3.1. UV-vis results
manufacturing
photo-catalyst
Fe3+-doped
SiO2/TiO2 nano materials in the visible light
range.
Wavelength (NM)
Figure 2. The UV–vis spectra of SiO2/TiO2 thin
films with different Fe-doped concentrations in the
wavelength range of 300-800 nm.
The ultraviolet–visible (UV–Vis) spectra
of SiO2/TiO2 thin films with different Fe3+doped concentrations in the wavelength range
of 300–800 nm are illustrated in Figure 2. It
reveals that the transmittance of SiO2/TiO2 thin
film without Fe
3+
doping has an abrupt
decrease when wavelengths are below 350 nm.
This indicates the absorption edge near 350 nm
Trang 94
Figure 3. (a) The plot of (αdhυ)1/2 vs. hυ, (b) The
relationship between band-gap energyand Fe3+doped concentration.
TAẽP CH PHAT TRIEN KH&CN, TAP 16, SO K1- 2013
Figure 3 (a) illustrates the plot of (dh) 1/2
vs. h for the TiO2 thin lms with various Fe
Table 2. From the value of Eg (eV) and ht
3+
Samples
Eg (eV)
ht (m)
A0
3.336
371.7
A2
3.335
371.8
A4
3.331
372.2
A6
3.28
378.0
and the Fe3+ content, for all SiO2/TiO2 thin
A8
3.17
391.2
lms, are shown in Figure 3(b). It reveals that
A10
3.03
409.2
contents.
From
the
intersection
of
the
extrapolation of each curve in Figure 3(a) and
h axis gives the band-gap energy of TiO2 thin
lms with different Fe3+ doping concentrations.
The relationship between the band-gap energy
the band-gap energy decreases when the Fe3+
content increases. The band-gap energy of
3.2. X-ray diffraction Measurements
SiO2/TiO2 thin lm without Fe3+ doping is 3.33
eV and the band-gap energy of SiO2/TiO2 thin
lm doping with 1 mol% Fe3+ has been
identied to be 3.03 eV. Since localized 3d
orbitals of Ti constitute the conduction band of
TiO2, doping Fe3+ to the TiO2 lattice inuence,
the conduction band by admixing Fe3+ 3d
orbitals [8]. Thus, the conduction band is
shifted towards the lower energy and a
systematic decrease in the valence bandconduction band occurs with an increasing
concentration of Fe3+ in TiO2 lattice or matrix.
XRD patterns for undoped and various
3+
Fe -doped SiO2/TiO2 powders calcined at
5000C for 1h are shown in Figure 4. It is
identied that all the diffraction peaks are
ascribed to the anatase TiO2 for undoped Fe3+
powders as illustrated in Figure 4 (A0). The
XRD patterns of the SiO2/TiO2 powders with
an Fe3+-doping amount increasing from 0 to
1mol % are demonstrated in Figure 4(A2
A10), respectively. It has been registered that
all the diffraction peaks in Figure 4(A2-A10)
also belong to the anatase TiO2, and no other
phase can be detected. Moreover, the result of
Figure 4 also reveals that the intensity of
diffraction peaks decreases with an increasing
Fe3+-doped concentration. This phenomenon
caused by the Fe3+-doped can inhibit the
crystallization of anatase TiO2 [11].
Trang 95
Science & Technology Development, Vol 16, No.K1- 2013
Figure 4. XRD patterns for undoped and various Fe3+-doped TiO2 thin films after calcining at 5000C for 1h.
Moreover, in this study, although the Fe3+doped concentration attained 1 mol %, the iron
oxides or Fex TiOy are not identified in the XRD
patterns. The average crystallite size of the
TiO2
powders
with
various
Fe3+-doped
concentrations calcined at 5000C for 1h are
determined, by the Scherrer’s equation, as
Figure 5. Effect of Fe3+ -doped concentrated on the
follows:
crystalline size of TiO2 thin films.
It reveals that the size of TiO2 powder
decreases from 8.8 to 5.59 nm when the Fe3+(2)
doped concentration increases from 0 to 0.8
Where Dhkl denotes the average crystallite
mol%. The Fe3+-doped has an effect on the
3+
size of the TiO2 powders with various Fe -
crystallization of TiO2 [9]. The larger the
doped concentrations, λ= 0.15405 nm is the X-
amount of Fe3+-doping, the wider the width of
ray wavelength of Cu Kα, β is the full width of
the
the peak measured at half maximum intensity
crystallization, and the smaller the grain size of
and θ is the Bragg’s angle of the peak. The
TiO2 powders.
effects of the Fe3+-doped concentration on the
crystallite size of TiO2 powders calcined at
5000C for 1h are demonstrated in Figure 5.
Trang 96
diffraction
peaks,
the
worse
the
TAẽP CH PHAT TRIEN KH&CN, TAP 16, SO K1- 2013
Figure 6 shows the Raman spectra of
3.3. Raman Measurement
different samples. Raman peak at about 144
cm1 is observed for all the samples, which is
attributed to the main Eg anatase vibration
mode. Moreover, vibration peaks at 395 cm1,
518 cm1 and 639 cm1 are presented in the
spectra for all samples, which indicate that
anatase TiO2 crystalline are the predominant
species.
Furthermore,
there
is
no
peak
attributed to the iron oxide observed, which is
consistent with the results of XRD patterns.
Figure 6. Raman spectrum of powder samples A0,
A2, A4, A6, A8, A10.
3.4. AFM result images
Figure 7. AFM images of film:a. A0 with RMS = 0.7565 nm; b. A2 with RMS = 0. 6772 nm; c. A4 with RMS=
0.5812nm; d. A6 with RMS=0.6526nm; e. A8 with RMS=1.5891nm; f. A10 with RMS = 1.2298nm.
The atomic force microscopy images were
taken in order to study the morphology of the
3+
respectively. The surface roughness increases
this
mean
that,
it
is
favorable
to
a
Fe -doped SiO2/TiO2 thin films. The AFM
photocatalytic reaction by enhancing the
images in Figure 7 indicate that the particle
contact surface
size and lm roughness increased with the
SiO2/TiO2 lms and organic pollutants. The
3+
area between Fe3+-doped
increase of Fe . The surface roughness (RMS)
AFM images of samples showing RMS A8 is
increased from 0.7565 nm to 1.5891 nm with
the largest, therefore the roughness of film A8
3+
the addition of Fe
from 0 mol% to 0.8 mol%
are the highest.
Trang 97
Science & Technology Development, Vol 16, No.K1- 2013
3.5. Visible photocatalytic activity
Figure 8. The contact angle of water on the normal glass substrate (a), on A8 film (b) and on A8 film stored 1 day
in a dark environment (c).
Figure 8 shows that the dependence of
Moreover, Figure 8(b) shows that, the
photo-induced changesin the water contact
contact angle of water on the Fe3+-doped
angle of Fe3+-doped SiO2/TiO2 thin film with
SiO2/TiO2 film coated sample was very low
3+
0.8 mol % coated on glass, which were
(<20), while higher values of water contact
irradiated under visible-light after 2 hours and
angle resulted when water was deposited on
then kept 1 day in a dark environment. The
normal glass substrates. In addition, after
hydrophilic ability of the sample may be
storing 1 day in a dark environment, the contact
explained by the contact angle of water on the
angle of water on Fe3+-doped SiO2/TiO2 film
surface. The super-hydrophilic property of the
coated glass slowly increased to about 50
surface allows water to spread completely
(Figure 8 (c)). This result means that the coated
across the surface rather than remaining as
sample could maintain the super-hydrophilic
Fe
3+
droplets. The observed result means that Fe -
capability for a
doped SiO2/TiO2 film coated glass is a good
environment.
long time
in a
material for antifogging and self-cleaning
purposes.
Figure 9. Photocatalysis decoloration of MB with A8 film/glass (a), and normalglass substrate (b)
Trang 98
dark
TAẽP CH PHAT TRIEN KH&CN, TAP 16, SO K1- 2013
Finally, we qualitatively analyze the
photocatalysis
on
of
glass
Fe -doped
substrates
stability and may be utilized for mass
production. The absorption edge of thin films
by
shifted towards longer wavelengths form 371.7
decoloration of MB. Figure 9 shows the
to 409.2 nm with increasing concentrations of
photocatalysis decoloration of MB with A8-
Fe3+. The result shows that, the optimum
coated glass substrate. It can be seen that the
concentration of Fe3+ is 0.8 % mol at 5000C
concentration of MB on the experimental
temperature of substrates. It was found that
substrate decreased about 50% over a period of
doped Fe3+ increases the photosensitivity of
about 15 min and almost no MB was detected
nano TiO2 with rather high retention time in
after a period of 30 min.
characteristics. The as-prepared material can be
SiO2/TiO2
lm
property
3+
used to manufacture TiO2 operating in the
4. CONCLUSIONS
region of visible light.
The SiO2/TiO2 films doped with different
3+
Fe
concentration have been prepared by a
simple sol-gel method. The solutions have high
C IM V TNH CHT QUANG CA MNG SiO2/TiO2 PHA TP Fe3+ CH
TO BNG PHNG PHP PH NHNG SOL GEL
ng Mu Chin, Lờ Duy m, Nguyn Th Thanh Tõm, ng Th M Dung
Phũng thớ nghim Cụng ngh Nano, HQG-HCM
TểM TT: Trong bi bỏo ny, chỳng tụi ó tng hp thnh cụng mng SiO2/TiO2 pha tp
3+
Fe trờn thy tinh s dng phng phỏp ph nhỳng Sol-Gel. Mng sau khi ch to c nung
5000C trong khụng khớ trong 1 gi. c im v tớnh cht quang ca mng SiO2/TiO2 pha tp Fe3+ ó
c kho sỏt bng nhiu x tia X, quang ph UV-Vis v quang ph hng ngoi (FT-IR). Kh nng
chng ng sng m trờn kớnh cú ph mng SiO2/TiO2 pha tp Fe3+ ó c kho sỏt v chng minh
bng gúc tip xỳc ca nc di ỏnh sỏng kh kin. Kt qu phõn tớch cng ch ra rng tinh th TiO2
to l pha anatase v kớch thc tinh th gim dn t 8.8 n 5.9 nm. Kt qu thu c cng cho thy
b hp th ca mng SiO2 /TiO2 pha tp Fe3+ dch chuyn ti bc súng di hn (dch chuyn ti ỏnh
sỏng ) t 371nm ti 409.2 nm khi nng tp Fe3+ tng lờn t 0 n 1% mol.
Trang 99
Science & Technology Development, Vol 16, No.K1- 2013
photocatalytic
REFERENCES
reactivity
for
photodegradation of XRG dye diluted in
[1]. Michael R. Hoffmann, Scot T. Martin,
Wonyong. Choi, Detlef W. Bahnemann,
Environmental
(2004).
of
[7]. D.H. Kim, H.S. Homg, S.J. Kim, J.S.
Semiconductor Photocatalysis, Chemical
Song, K.S. Lee, Photocatalytic behaviors
Reviews, 95, 69-96 (1995)
and
[2]. Dang
Mau
Applications
water, J. Mol. Catal. A: Chem., 216, 35
Chien,
Nguyen
Ngoc
structural
characterization
nanocrystalline
Fe-doped
of
TiO2
Viet, Nguyen Thi Kieu Van, Nguyen Thi
synthesized by mechanical alloying, J.
Phuong
Alloys Compounds, 375, 259 (2004).
Phong,
Characteristics
modification of TiO2 thin films by doping
[8]. M. Radecka, P. Pasierb, K. Zakrzewska,
with silica and alumina for self-cleaning
M.
application,
(Sn,Ti)O2 polycrystalline ceramics and
Journal
of Experimental
Nanoscience, 4, 221-232 (2009).
Rekas,
Transport
properties
of
thin films, Solid State Ionics 119, 43
[3]. Dang Mau Chien, Nguyen Ngoc Viet,
(1999).
Nguyen Thi Kieu Van, Nguyen Thi
[9]. M. Zhou, J. Yu, B. Cheng, H. Yu,
Phuong Phong, SiO2-TiO2 thin film and
Preparation and photocatalytic activity of
its photocatalyst properties, Advances in
Fe-doped mesoporous titanium dioxide
Natural Sciences, 10, 31 (2009).
nanocrystalline
[4]. Thi My Dung Dang, Duy Dam Le, Vinh
Thang Chau, Mau Chien Dang, Visible-
photocatalysts,
Mater.
Chem. Phys., 93, 159 (2005)
[10]. Kais Elghniji, Atef Atyaoui, Stefano
light photocatalytic activity of N/SiO2-
Livraghi,
TiO2 thin films on glass, Adv. Nat. Sci:
Giamello, Mohamed Ksibi, Synthesis and
Nanosci. Nanotechnol. 1 015004 (2010).
characterization of Fe3+ doped TiO2
[5]. Duy Dam Le, Thi My Dung Dang, Vinh
Latifa
nanoparticles
and
Bousselmi,
films
and
Elio
their
Thang Chau, Mau Chien Dang,The
performance for photocurrent response
fabrication of visible light responsive Ag-
under UV illumination, Journal of Alloys
SiO2 co-doped TiO2 thin films by the sol-
and Compounds, 541, 421 (2012).
gel method, Adv. Nat. Sci: Nanosci.
Nanotechnol. 1 015007 (2010).
J.
Huang,
Characterization
of
TiO2photocatalysts
hydrothermal
Trang 100
L.
synthesized
method
and
Ben
Naceura,
R.Mechiakha,F.
Bousbih, R. Chtourou, Influences of the
[6]. J. Zhu, W. Zhang, B. He, J. Zhang, M.
Anpo,
[11]. J.
iron ion (Fe3+)-doping on structural
Zhang,
and optical properties of nanocrystalline
Fe–
TiO 2 thin films prepared by sol–gel
by
spin coating, Applied Surface Science
their
257 10699 (2011).