Comparative analysis of volatile organic compounds in class II and metro cities in Maharashtra, India
Bạn đang xem bản rút gọn của tài liệu. Xem và tải ngay bản đầy đủ của tài liệu tại đây (564 KB, 15 trang )
Int.J.Curr.Microbiol.App.Sci (2019) 8(5): 1900-1914
International Journal of Current Microbiology and Applied Sciences
ISSN: 2319-7706 Volume 8 Number 05 (2019)
Journal homepage:
Original Research Article
/>
Comparative Analysis of Volatile Organic Compounds in Class II and
Metro Cities in Maharashtra, India
E. Ravendiran1*, S.C. Kollur1, V.M. Motghare1, Ajay R. Ojha2*,
Prasad R. Pawar2 and Swanandi Sathaye2
1
Maharashtra Pollution Control Board, Kalpataru Point, Sion, Mumbai 400 022, India
2
Technogreen Environmental Solutions, Wakadewadi, Pune 411 003, India
*Corresponding author
ABSTRACT
Keywords
VOC, BTX, Diurnal
variability, Seasonal
variability, Metro
cities, Solar
radiation, Benzene,
Toluene, m, pxyelene, Online
monitoring
Article Info
Accepted:
15 April 2019
Available Online:
10 May 2019
Increasing concentrations of volatile organic compounds (VOCs) is a matter of
significant concern with respect to the long term impacts on human health and
environment. While transport is the greatest contributor of VOCs in ambient air, other
sources such as industries and petrol pumps also contribute significantly. The study
and analysis of VOCs is important to identify emission sources and impacts. Samples
of ambient air were collected and analyzed at three locations in the cities of Mumbai,
Nagpur and Pune using an online VOC72M Analyzer. A study was carried out to
analyze concentrations of benzene, toluene and m, p- xylene in these cities in order to
create a comparative account of diurnal and seasonal variability of these compounds.
The results show 1.Annual concentration ranges: 0.35 µg/m3 (minimum) to 24.73
µg/m3 (maximum); 2. Correlation between cities – the minimum concentration was
found in Pune while the maximum concentration was found in Nagpur. 3. In general,
levels of BTX were higher during summer and winter and were inversely proportional
to sunlight.
Introduction
Volatile organic compounds (VOCs) are
released into the environment through both
nonmoving and mobile sources (Somet a.,
2007). In urban outdoor environments,
Combustion of fuel for energy production and
vehicular transport are major contributors of
VOCs (Hinwood, 2007; Kampa and Castanas,
2008; Srivastava, 2005). In the urban
atmosphere, VOCs have toxic effects on
humans and can potentially carcinogenicity
and mutagenicity in exposed individuals
(Srivastava, 2005). Humans also get exposed
to VOCs through indoor air pollution. The
health effects of VOCs include irritation and
allergies of the eyes, nose, throat and skin,
loss of coordination, headaches, nausea,
fatigue, and conjunctival irritation, while also
causing damage to the kidneys, liver and
central nervous system (Srivastava, Joseph
and Devotta, 2006; Rumchev, Broan and
Spickett, 2007). However, probably the most
significant health risk of exposure to outdoor
1900
Int.J.Curr.Microbiol.App.Sci (2019) 8(5): 1900-1914
VOC pollution is asthma and chronic
bronchitis in adults as well as children
(Mølhave, 1991). Information on temporal
and seasonal variability inurban areas of
Indian cities is not abundant and therefore a
need for research in this area is felt.
Among the wide spectrum of VOCs, benzene,
toluene, ethyl benzene and meta (m) and para
(p) xylene (BTEX) are the most widely
studied compounds (Som et al., 2007; Maisey
et al., 2013; Miri et a., 2016). Benzene is
classified as a Group I human carcinogen by
the International Agency for Research on
Cancer, while toluene and m-p- xylenes affect
the respiratory and nervous systems (Gaur,
Singh and Shukla, 2016). It is due to the
multitude of sources for these compounds and
the spectrum of health effects that VOCs are
required to be monitored in urban
atmospheres. This report gives a comparative
account of concentrations of BTX in ambient
air in three metropolitan cities in India, in the
State of Maharashtra, namely, Mumbai,
Nagpur and Pune. Diurnal and seasonal
variability of these compounds has been
analyzed.
average annual temperature of 27°C and
average annual rainfall of 2422 mm.
Nagpur is the winter capital of Maharashtra
and the third largest city in the State. It is
predicted to be the 5th fastest growing city in
the world from 2019 to 2035 with an average
growth of 8.41%. It also marks the
geographical center of India. The average
annual temperature of Nagpur is 26°C and the
average annual rainfall that the city receives is
1092 mm. The climate of Nagpur is tropical.
The third location where VOCs were
monitored was Pune. Pune is located on the
western part of the Deccan Plateau at an
altitude of 560m above sea level. The city is
widely known for its educational research
institutes as well as institutes for information
technology, management and training which
attract students and professionals from all
over India and overseas. The climate of Pune
can be described as hot and semi-arid
bordering on tropical wet and dry. The
average annual temperatures are in the range
of 20°C to 28°C. The average annual rainfall
is 722 mm.
Study area
Sampling locations
Analysis of concentrations of BTX recorded
at sampling locations situated in three
metropolitan cities in Maharashtra, viz.
Mumbai, Nagpur and Pune was carried out.
Mumbai is a cosmopolitan metropolis and the
capital of Maharashtra and is located on the
west coast of the Indian subcontinent. Being a
rapidly developing metropolis, Mumbai is a
hub for technological, industrial, commercial,
and port activity.
India has 573 locations for air monitoring
under the National Air Monitoring Program
(NAMP) (ENVIS, 2019), of which 73 are
installed in the State of Maharashtra.
However most of these monitoring stations
are manually operated as per NAAQS
(CPCB).
Recently,
Maharashtra
has
incorporated 9 online monitoring stations
which include VOCs analysis in ambient air
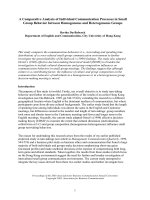
(CPCB). There is currently one sampling
location in each of the three cities as shown in
Figure 1. These sampling and monitoring
stations have been established and are
operated by the Maharashtra Pollution
Control Board (MPCB) under Continuous
Ambient Air Quality Monitoring Stations.
The most recent census of 2011 records the
population of Mumbai at 1.84 billion while
the vehicle population as of January, 2017
was about 3 million. The climate of Mumbai
can be described as tropical wet and dry with
1901
Int.J.Curr.Microbiol.App.Sci (2019) 8(5): 1900-1914
The sampling station at Mumbai is located
adjacent to the Western Express Highway in
Bandra East. The sampling station at Nagpur
is located in a residential area between
Rajrani Chowk and Civil Lines. In Pune, the
sampling station is located at Cummins
College of Engineering near Karve Road. The
coordinates of these locations are provided in
Table 1. Locations for monitoring ambient air
quality stations are selected in keeping with
the Guidelines for Planning the Sampling of
Atmosphere determined by Bureau of Indian
Standards (2000) as well as the Guidelines for
Ambient Air Quality Monitoring by Central
Pollution Control Board and Ministry of
Environment and Forests (2003). The location
of the monitoring stations is representative of
the area selected and the ambient conditions.
Materials and Methods
Sampling of ambient air for analysis of BTX
was carried out using an online VOC72M
Analyzer at all three locations. The operation
of this analyzer is based on separation of
measured compounds by gas chromatography
and detection using photo-ionization. The
analyzer measures up to 40 VOCs including
benzene, toluene, ethyl benzene, m, p- xylene,
o-xylene and 1-3 butadiene. The low
detection limit of the analyzer is ≤ 0.05 µg/m3
benzene and the sample flow is 50ml per
minute. Trap sampling, cold purge, injection,
hot purge and trap cooling are the five steps
of the analysis cycle.
Results and Discussion
Ambient concentrations
The sampling locations in the cities of
Mumbai, Nagpur and Thane are situated not
more than 2km from major highways. In
Mumbai the sampling location is situated
about 50m from the Western Express
Highway, while at Nagpur the sampling
location is about 550m from the NagpurAurangabad Highway. In Pune, the sampling
location is situated 1.9km from the Asian
Highway 47. However, it is located only
about 350m from Karve Road, a busy major
road in the city. Standards for VOCs in India,
except benzene in ambient air, are absent and
hence information regarding ambient
concentrations, environmental impacts and
effects on human health is still restricted. The
annual standard for benzene in ambient air as
defined by the Central Pollution Control
Board in its notification dated 18th November,
2009 is 5µg/m3.The concentrations of BTX
recorded during summer are the averages of
concentrations recorded in the months of
January, February, March and April. The
concentrations recorded for monsoon are the
averages of concentrations recorded during
the months of May, June, July and August.
The averages of concentrations recorded
during September, October, November and
December are the concentrations reported
during winter. Table 2 presents the seasonal
and annual averages of total BTX recorded at
Mumbai, Nagpur and Pune.
In general, only the average annual
concentration of benzene recorded at Nagpur
exceeds the annual standard for benzene in
ambient set by the CPCB. Benzene
concentrations at Mumbai and Pune are
observed to be within the standard limit. As
standards for toluene and xylene are not
provided for India, seasonal and annual
concentrations of these two compounds
cannot be studied at present in terms of their
exceedance and apparent environmental and
health effects.
Diurnal variation of benzene, toluene and
xylene in Mumbai, Nagpur and Pune
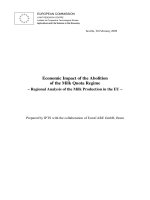
The trend in mean benzene concentrations in
Mumbai, Nagpur and Pune show a general
increasing trend during summer months after
1902
Int.J.Curr.Microbiol.App.Sci (2019) 8(5): 1900-1914
which the concentrations decrease gradually
till monsoon. The concentrations increase
during winter months. This trend is depicted
in Figures 2, 3 and 4. In all the three cities the
benzene concentrations show a slight increase
during the month of July. The concentrations
of benzene in the cities of Mumbai, Nagpur
and Pune have been analyzed with respect to
the monthly mean of solar radiation to study
diurnal variation. From the figures, it is
evident that benzene concentrations are
inversely proportional to solar radiation. In
winter months, when the average sunlight is
recorded to be lower, benzene concentrations
are seen to be on a rise, while during summer
when the solar radiation is high, the BTX
concentrations show a declining trend. During
monsoon, while solar radiation shows a drop,
the BTX concentrations can be found to have
slightly increased. Table 3 shows details of
the monthly means of benzene concentrations
and solar radiation recorded per hour per day
during the year 2018.
In Mumbai, the concentration of benzene was
found to be highest during the month of
November and lowest during August, while in
Nagpur, the month of January had the highest
mean benzene concentration and the lowest
concentration was found during August. In
Pune, the highest benzene concentration can
be observed during January and the lowest
concentration was found between June and
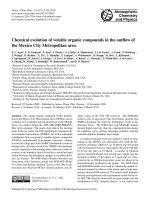
September. Table 4 shows the shows details
of the monthly means of toluene
concentrations and solar radiation recorded
per hour per day during the year 2018.
It is evident from Table 4 that the highest
concentration of toluene at Mumbai, Nagpur
and Pune was observed during January and
the lowest concentration at Mumbai was
found during May and August. The lowest
toluene concentration at Nagpur was found
during August. In Pune the lowest
concentration of toluene was recorded during
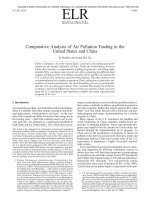
June and August. Table 5 shows the shows
details of the monthly mean of toluene
concentrations and solar radiation recorded
per hour per day during the year 2018.
Table 5 shows that the highest concentration
of xylene at Mumbai and Pune was recorded
during
January
2018.
The
lowest
concentration of xylene at Mumbai was
recorded in the month of July. The lowest
xylene levels at Pune were recorded between
the months of June and September. At
Nagpur, the highest concentration of xylene
was recorded in December while the lowest
concentration was recorded during August.
City-wise variation of trends of BTX
The trends of BTX for the year 2018 show a
‘W’ shaped trend where the concentrations of
BTX were high during the beginning of the
year, lowest during the middle of the year and
high during the end of the year followed by a
marked decrease again after November. The
annual trends of BTX in respective cities
during the year 2018 are represented
graphically in Figure 5, 6 and 7.
Mumbai
At Mumbai, the concentrations of BTX were
high during January and decreases over the
months of February to May. During May, the
concentrations were low while a slight
increase was seen during June and July. The
BTX levels decreased again during August,
followed by a steep rise over the months of
September to November. During December
the levels were found to have decreased.
Table 6 shows the average monthly
concentrations of BTX recorded at Mumbai
for the year 2018.
From the table it can be observed that the
highest concentration of BTX was recorded
during
November
and
the
lowest
1903
Int.J.Curr.Microbiol.App.Sci (2019) 8(5): 1900-1914
concentration was recorded during August.
The highest level of toluene was observed
during the month of January while the lowest
concentration was recorded during the months
of May and August. The highest
concentration of xylene was recorded during
the month of January and lowest level was
observed during the month of July.
Nagpur
In the city of Nagpur the BTX concentrations
show a trend similar to that in Mumbai. The
concentrations are highest during the summer
and winter months and lowest during
monsoon. The annual trends of BTX in the
city of Nagpur during the year 2018 are
represented graphically in Figure 6.
In the city of Nagpur the BTX concentration
was high during January and steadily declined
till July when there was a slight increase or
plateau in the trend. This was followed by a
fall in concentrations in the month of August
after which the levels increased till
November. During December, only the
concentration of toluene decreased. Benzene
concentration was steady during November
and December while xylene concentrations
increased in December. Table 7 shows the
average monthly concentrations of BTX
recorded at Nagpur for the year 2018.
Table 7 shows that the highest levels of
benzene and toluene were found during
January and the lowest concentrations were
found during July. The highest concentrations
of xylene were found during the month of
December while the lowest levels were found
during August.
Pune
Concentrations of BTX in Pune show an
extended period of decrease during the
summer and monsoon months thereby
showing a slight deviation from the trends of
BTX concentrations observed in the cities of
Mumbai and Nagpur. However, the general
trend of increased concentrations toward the
beginning and end of the year is similar to the
trends seen in Mumbai and Nagpur. The
annual trends of BTX in the city of Pune
during the year 2018 are represented
graphically in Figure 7.
BTX concentrations were high during January
and decreased till April. A sudden increase in
BTX levels was observed during May,
although not has high as concentrations
recorded in January. The months of June,
July, August and September saw very low
levels of BTX followed by increased
concentrations till December. Table 8 shows
the average monthly concentrations of BTX
recorded at Pune for the year 2018.
It is evident from Table 8 that the highest
concentrations of benzene, toluene and xylene
in Pune were found in the month of January.
The lowest concentrations of benzene and
xylene were recorded between June and
September. The lowest toluene concentration
was recorded during the months of June and
August.
Table.1 Locations of online VOC monitoring stations
Location
Bandra, Mumbai
Nagpur CAAQMS
Latitude
19° 03' 41.8"N
21° 09'03.61"N
Longitude
72° 50'46.0"E
79° 04' 06.00"E
Karve Road CAAQMS, Pune
18 °30' 40.21"N
73° 50' 28.56"E
1904
Int.J.Curr.Microbiol.App.Sci (2019) 8(5): 1900-1914
Table.2 Seasonal variation of BTX observed at Mumbai, Nagpur and Pune
BTX
Benzene
(µg/m3)
Mumbai
Nagpur
Pune
Summer
1.279
7.970
0.112
Monsoon
0.466
2.988
0.035
Winter
1.683
5.624
0.090
Annual
1.142
5.527
0.079
Toluene (µg/m3)
Mumbai
Nagpur
Pune
5.246
28.341
1.031
0.796
18.000
0.356
4.664
27.860
0.926
3.568
24.734
0.771
Xylene (µg/m3)
Mumbai
Nagpur
Pune
1.696
17.387
0.517
0.307
7.352
0.112
1.568
22.034
0.421
1.190
15.591
0.350
Table.3 Monthly means of benzene concentrations and mean solar radiation during 2018
Month
January
February
March
April
May
June
July
August
September
October
November
December
Mumbai
2.08
1.69
0.95
0.40
0.40
0.53
0.56
0.37
0.88
1.53
2.60
1.72
Mean Benzene (µg/m3)
Nagpur
10.27
8.42
7.16
6.03
3.88
2.85
3.16
2.06
3.43
7.20
9.80
9.89
Pune
0.20
0.14
0.07
0.04
0.09
0.02
0.02
0.02
0.02
0.06
0.11
0.16
Mean Solar
Radiation (W/m2)
73.01
109.41
130.52
166.05
168.99
160.37
95.94
95.94
139.26
131.26
98.10
106.99
Table.4 Monthly means of toluene concentrations and mean solar radiation during 2018
Month
January
February
March
April
May
June
July
August
September
October
November
December
Mumbai
9.07
7.01
3.45
1.46
0.60
1.15
0.83
0.60
2.40
4.29
6.80
5.17
Mean Toluene (µg/m3)
Nagpur
34.04
29.20
25.26
24.87
17.63
14.41
15.09
9.70
19.81
28.51
34.02
29.10
1905
Pune
1.75
1.33
0.66
0.38
0.79
0.20
0.24
0.20
0.24
0.68
1.20
1.59
Mean Solar
Radiation (W/m2)
73.01
109.41
130.52
166.05
168.99
160.37
95.94
95.94
139.26
131.26
98.10
106.99
Int.J.Curr.Microbiol.App.Sci (2019) 8(5): 1900-1914
Table.5 Monthly means of xylene concentrations and mean solar radiation during 2018
Month
January
February
March
April
May
June
July
August
September
October
November
December
Mumbai
2.87
2.01
1.01
0.90
0.28
0.40
0.27
0.28
0.73
1.53
2.17
1.84
Mean Xylene (µg/m3)
Nagpur
22.84
17.99
14.91
13.80
9.31
8.09
6.92
5.09
10.93
20.83
27.26
29.11
Pune
0.98
0.69
0.29
0.11
0.21
0.08
0.08
0.08
0.08
0.27
0.56
0.78
Mean Solar
Radiation (W/m2)
73.01
109.41
130.52
166.05
168.99
160.37
95.94
95.94
139.26
131.26
98.10
106.99
Table.6 Average monthly concentrations of BTX in Mumbai
Month
January
February
March
April
May
June
July
August
September
October
November
December
Benzene (µg/m3)
2.08
1.69
0.95
0.40
0.40
0.53
0.56
0.37
0.88
1.53
2.60
1.72
Toluene (µg/m3)
9.07
7.01
3.45
1.46
0.60
1.15
0.83
0.60
2.40
4.29
6.80
5.17
Xylene (µg/m3)
2.87
2.01
1.01
0.90
0.28
0.40
0.27
0.28
0.73
1.53
2.17
1.84
Table.7 Average monthly concentrations of BTX in Nagpur
Month
January
February
March
April
May
June
July
August
September
October
November
December
Benzene (µg/m3)
10.27
8.42
7.16
6.03
3.88
2.85
3.16
2.06
3.43
7.20
9.80
9.89
Toluene (µg/m3)
34.04
29.20
25.26
24.87
17.63
14.41
15.09
9.70
19.81
28.51
34.02
29.10
1906
Xylene (µg/m3)
22.84
17.99
14.91
13.80
9.31
8.09
6.92
5.09
10.93
20.83
27.26
29.11
Int.J.Curr.Microbiol.App.Sci (2019) 8(5): 1900-1914
Table.8 Average monthly concentrations of BTX in Pune
Month
January
February
March
April
May
June
July
August
September
October
November
December
Benzene (µg/m3)
0.20
0.14
0.07
0.04
0.09
0.02
0.02
0.02
0.02
0.06
0.11
0.16
Toluene (µg/m3)
1.75
1.33
0.66
0.38
0.79
0.20
0.24
0.20
0.24
0.68
1.20
1.59
Xylene (µg/m3)
0.98
0.69
0.29
0.11
0.21
0.08
0.08
0.08
0.08
0.27
0.56
0.78
Table.9 Seasonal variation in inter-species ratios of BTX in Mumbai, Nagpur and Pune
Mumbai
T/B
Xy/B
Summer
4.102
1.326
T/B
Xy/B
3.556
2.181
T/B
Xy/B
9.203
4.618
Monsoon
1.708
0.659
Winter
2.772
0.932
6.024
2.460
4.954
3.918
10.115
3.194
10.328
4.698
Nagpur
Pune
Fig.1 Google maps image of Maharashtra showing three locations of VOC monitoring.
1907
Int.J.Curr.Microbiol.App.Sci (2019) 8(5): 1900-1914
Fig.2 Annual trend in mean benzene concentrations in the cities of Mumbai, Nagpur and Pune during
the year 2018
Fig.3 Annual trend in mean Toluene concentrations in the cities of Mumbai, Nagpur and Pune during
the year 2018
1908
Int.J.Curr.Microbiol.App.Sci (2019) 8(5): 1900-1914
Fig.4 Annual trend in mean Xylene concentrations in the cities of Mumbai, Nagpur and Pune during the
year 2018
Fig.5 Annual trend of BTX in Mumbai
1909
Int.J.Curr.Microbiol.App.Sci (2019) 8(5): 1900-1914
Fig.6 Annual trend of BTX in Nagpur
Fig.7 Annual trend of BTX in Pune
Urban areas which are densely populated are
sites of generation of BTEX from
anthropogenic activities Cerón-Bretón et al.,
2015). The compounds included in the BTEX
class of VOCs are highly carcinogenic,
mutagenic and genotoxic (Alghamdi et al.,
2014). These compounds play a critical role
in atmospheric chemistry on account of their
1910
Int.J.Curr.Microbiol.App.Sci (2019) 8(5): 1900-1914
active participation
in
photochemical
reactions (Alghamdi et al., 2014; CerónBretón et al., 2015; Miri et al., 2016). The
typical lifetimes of BTEX compounds in the
atmosphere are relatively short with respect to
the atmospheric removal of BTEX facilitated
by the reaction where the OH radical is
removed. Considering this reaction, the
lifetime of benzene is 225 hours, that of
toluene is 50 hours and that of xylenes is 12
to 19 hours (12 hours for m-xylene; 15 hours
for p-xylene) (Alghamdi et al., 2014).
The present study includes only benzene,
toluene and xylenes for analysis. Results of
the study show the inverse relation between
BTX and solar radiation in three cities namely
Mumbai, Nagpur and Pune. In all three cities,
toluene was found to be most abundant with
an average concentration of 3.57µg/m3 in
Mumbai, 24.73µg/m3 in Nagpur and
0.77µg/m3 in Pune. This was followed by
xylenes with an average concentration of
1.19µg/m3 in Mumbai, 15.59µg/m3 in Nagpur
and 0.35 µg/m3 in Pune. Toluene has been
found to be the most abundant compound in
several studies carried out in urban
environments in countries such as Mexico,
Spain and Iran (Parra et al., 2009; Rad et al.,
2014; Cerón-Bretón, et al., 2015).
BTX ratios
Ratios of toluene to benzene and m,p-xylene
to benzene are important to ascertain sources
of BTX as well as the variations in distances
to the emission sources. Table 9 shows the
summary of seasonal variation of ratios of
toluene to benzene (T/B) and xylenes to
benzene (Xy/B) observed in Mumbai, Nagpur
and Pune during the year 2018. These ratios
also provide an insight on the sampling
locations and are greatly influenced by the
climate of the study area, types of sources and
lifetime or age of the compounds and air
parcels (Alghamdi et al., 2014; Gaur, Singh
and Shukla, 2016).
Toluene: Benzene
Mumbai
The highest ratio of the annual concentration
of toluene to benzene was observed during
summer (4.102) followed by winter (2.772).
The lowest ration was recorded during
monsoon (1.708). A toluene to benzene ratio
within the range of 1.5 and 4.3 indicates
traffic and transportation as the source of
emissions (Alghamdi et al., 2014). Other
sources may also include industrial emissions
and petrol pumps (Gaur, Singh and Shukla,
2016).
Nagpur
In Nagpur, the highest ratio of the annual
concentration of toluene to benzene was
observed during monsoon (6.024) followed
by winter (4.954). The lowest ratio was
recorded during summer (3.556). An increase
of this ratio beyond the typical values may
indicate low rainfall which allows for more
evaporation of BTX from local industrial
areas, petrol pumps, transportation and
service stations. The high ratio may also
indicate emissions from decomposition of
solid waste on dumping lands. Ratios
observed during summer and winter are also
to the higher limit of the typical range, which
may be explained by the increased
contribution of photochemical reactions
occurring during daytime.
Pune
The highest toluene to benzene ratio was
observed during winter (10.328), followed by
monsoon (10.115), followed by summer
(9.203). The ratios during all seasons are
outside the typical toluene to benzene ratio
range. This may indicate higher average
temperatures as well as higher incident solar
radiations throughout the year and other
sources along with traffic emissions to have
1911
Int.J.Curr.Microbiol.App.Sci (2019) 8(5): 1900-1914
contributed to concentrations of BTX. These
sources may include construction activities,
increased vehicular count and petrol pumps.
Xylenes: Benzene
Mumbai
The highest xylenes to benzene ratio was
observed during summer (1.326) followed by
winter (0.932) and monsoon (0.659). Xylenes
to benzene ratios greater than 1.61 indicate
higher degradation through photochemical
reactions thereby suggesting that the location
of the source is at some distance from the
sampling point (Miller et al., 2011). The high
ratio seen during summer followed by winter
indicates degradation of xylenes by
photochemical reactions occurring on account
of higher annual incident solar radiation.
Nagpur
The highest ratio was observed during winter
(3.918) followed by monsoon (2.460) and
summer (2.181). These ratios are greater than
the typical value of 1.61. These high ratios
therefore indicate higher photochemical
degradation throughout the year as well as
lesser proximity of sources from the sampling
location.
Pune
The highest xylenes to benzene was observed
during winter (4.698) followed by summer
(4.618) and monsoon (3.194). These ratios too
are significantly greater than the typical value
of 1.61 as described by (Miller et a., 2011).
These ratios indicate higher photochemical
degradation in the presence of higher average
solar radiation throughout the year, although
slightly greater during winter and summer.
The ratios also suggest that the sources of
emissions are located at some distance from
the sampling point.
It is concluded in the present study,
characterization of concentrations of benzene,
toluene and xylenes recorded at the cities of
Mumbai, Nagpur and Pune was undertaken.
Toluene was found to be present in abundance
followed by benzene and xylenes in all the
three cities. The results of this study showed a
definite seasonal and diurnal variability in the
concentrations of BTX in ambient air. The
results also showed a distinct inverse relation
between concentrations of BTX and solar
radiation.
T/B ratios were generally higher in summer
and winter in Mumbai and Pune. A greater
T/B ratio was observed during monsoon in
Nagpur which may suggest availability of
higher sunshine for photochemical reactions
and degradation due to the arid environment.
Generally high Xy/B ratios also indicate a
greater
occurrence
of
photochemical
degradation. These results suggest probable
sources of BTX as well as the distance of
sources from sampling locations. For a
comprehensive analysis and comparison of
BTX and VOCs in general across sources,
more sampling stations are required to be
installed at known and possible sources of
VOCs which include petrol pumps, industrial
clusters and traffic congestion junctions. It
will also be an interesting study to estimate
the contribution of the Chandrapur Super
Thermal Power Station to the current levels of
VOCs in Nagpur.
Also, the absence of standards for VOCs
other than benzene in ambient air for India is
of great concern as it is difficult to determine
the extent of impacts of VOC concentrations
on the environment as well as on humans.
Establishment of these standards will be
instrumental in improving quality of fuels as
well has vehicle technology and will also
facilitate the improvement of emission
regulations.
1912
Int.J.Curr.Microbiol.App.Sci (2019) 8(5): 1900-1914
Acknowledgment
Technogreen
Environmental
Solutions
expresses its gratitude to the Hon’ble Member
Secretary of the MPCB for agreeing to
collaborate with the project and for his
valuable support, and Mr. S. C. Kollur
(Scientific Officer, MPCB) for providing
valuable timely inputs and extensive data.
References
Alghamdi, M.A., Khoder, M., Abdelmaksoud,
A.S., Harrison, R.M., Hussein, T.,
Lihavainen, H., Al-Jeelani, H., Goknil,
M.H., Shabbaj, I.I., Almehmadi, F.M.
and Hyvärinen, A.P. (2014). Seasonal
and diurnal variations of BTEX and
their potential for ozone formation in
the urban background atmosphere of the
coastal city Jeddah, Saudi Arabia. Air
Quality, Atmosphere & Health, 7(4):
467-480.
Bureau of Indian Standards (2000). Methods
for measurement of air pollution. Part
14 Guidelines for planning the sampling
of atmosphere.
Central Pollution Control Board and Ministry
of Environment & Forests (2003).
Guidelines for ambient air quality
monitoring.
Cerón-Bretón, J.G., Cerón-Bretón, R.M.,
Kahl, J.D.W., Ramírez-Lara, E.,
Guarnaccia, C., Aguilar-Ucán, C.A.,
Montalvo-Romero,
C.,
AnguebesFranseschi, F. and López-Chuken, U.
(2015). Diurnal and seasonal variation
of BTEX in the air of Monterrey,
Mexico: preliminary study of sources
and photochemical ozone pollution. Air
Quality, Atmosphere & Health, 8(5):
469-482.
ENVIS, CPCB, Delhi, India (2019). Air
Pollution:
National
Air
Quality
Monitoring
Programme
(NAMP)
[ONLINE]
Available
at:
/>etoring.htm. [Accessed 18 April 2019].
Gaur, M., Singh, R. and Shukla, A. (2016).
Variability in the levels of BTEX at a
pollution hotspot in New Delhi, India.
Journal of Environmental Protection,
7(10): 1245-1258.
Hinwood, A.L., Rodriguez, C., Runnion, T.,
Farrar, D., Murray, F., Horton, A.,
Glass, D., Sheppeard, V., Edwards,
J.W., Denison, L. and Whitworth, T.
(2007). Risk factors for increased
BTEX exposure in four Australian
cities. Chemosphere, 66(3): 533-541.
Kampa, M. and Castanas, E. (2008). Human
health effects of air pollution.
Environmental pollution, 151(2): 362367.
Maisey, S.J., Saunders, S.M., West, N. and
Franklin, P.J. (2013). An extended
baseline examination of indoor VOCs in
a city of low ambient pollution: Perth,
Western
Australia.
Atmospheric
environment, 81: 546-553.
Miller, L., Xu, X., Wheeler, A., Atari, D.O.,
Grgicak-Mannion, A. and Luginaah, I.
(2011).
Spatial
variability
and
application of ratios between BTEX in
two Canadian cities. The Scientific
World Journal, 11: 2536-2549.
Miri, M., Shendi, M.R.A., Ghaffari, H.R.,
Aval, H.E., Ahmadi, E., Taban, E.,
Gholizadeh,
A.,
Aval,
M.Y.,
Mohammadi, A. and Azari, A. (2016).
Investigation of outdoor BTEX:
concentration,
variations,
sources,
spatial distribution, and risk assessment.
Chemosphere, 163: 601-609.
Mølhave, L. (1991). Volatile organic
compounds, indoor air quality and
health. Indoor Air, 1(4): 357-376.
Parra, M.A., Elustondo, D., Bermejo, R. and
Santamaria, J.M. (2009). Ambient air
levels of volatile organic compounds
(VOC) and nitrogen dioxide (NO2) in a
medium size city in Northern Spain.
1913
Int.J.Curr.Microbiol.App.Sci (2019) 8(5): 1900-1914
Science of the Total Environment,
407(3): 999-1009.
Rad, H.D., Babaei, A.A., Goudarzi, G.,
Angali, K.A., Ramezani, Z. and
Mohammadi, M.M. (2014). Levels and
sources of BTEX in ambient air of
Ahvaz metropolitan city. Air Quality,
Atmosphere & Health, 7(4): 515-524.
Rumchev, K., Brown, H. and Spickett, J.
(2007). Volatile organic compounds: do
they present a risk to our health?
Reviews on environmental health,
22(1): 39-56.
Srivastava, A., 2005. Variability in VOC
concentrations in an urban area of
Delhi. Environmental monitoring and
assessment, 107(1-3): 363-373.
Srivastava, A., Joseph, A.E. and Devotta, S.,
2006. Volatile organic compounds in
ambient air of Mumbai—India.
Atmospheric Environment, 40(5): 892903.
Som, D., Dutta, C., Chatterjee, A., Mallick,
D., Jana, T.K. and Sen, S. (2007).
Studies on commuters' exposure to
BTEX in passenger cars in Kolkata,
India.
Science
of
the
Total
Environment, 372(2-3): 426-432.
How to cite this article:
Ravendiran, E., S.C. Kollur, V.M. Motghare, Ajay R. Ojha, Prasad R. Pawar and Swanandi
Sathaye. 2019. Comparative Analysis of Volatile Organic Compounds in Class II and Metro
Cities in Maharashtra, India. Int.J.Curr.Microbiol.App.Sci. 8(05): 1900-1914.
doi: />
1914