Adsorption of Methylene Blue, Bromophenol Blue, and Coomassie Brilliant Blue by a-chitin nanoparticles
Bạn đang xem bản rút gọn của tài liệu. Xem và tải ngay bản đầy đủ của tài liệu tại đây (1.98 MB, 12 trang )
Journal of Advanced Research (2016) 7, 113–124
Cairo University
Journal of Advanced Research
ORIGINAL ARTICLE
Adsorption of Methylene Blue, Bromophenol Blue,
and Coomassie Brilliant Blue by a-chitin
nanoparticles
Solairaj Dhananasekaran a, Rameshthangam Palanivel
a
b
a,*
, Srinivasan Pappu
b
Department of Biotechnology, DDE, Science Campus, Alagappa University, Karaikudi, Tamil Nadu 630 004, India
Department of Bioinformatics, Science Campus, Alagappa University, Karaikudi, Tamil Nadu 630 004, India
A R T I C L E
I N F O
Article history:
Received 4 January 2015
Received in revised form 10 March
2015
Accepted 25 March 2015
Available online 16 May 2015
Keywords:
Chitin nanoparticles
Methylene Blue
Bromophenol Blue
Coomassie Brilliant Blue
Penaeus monodon (Fabricius, 1798)
A B S T R A C T
Expelling of dyestuff into water resource system causes major thread to the environment.
Adsorption is the cost effective and potential method to remove the dyes from the effluents.
Therefore, an attempt was made to study the adsorption of dyestuff (Methylene Blue (MB),
Bromophenol Blue (BPB) and Coomassie Brilliant Blue (CBB)) by a-chitin nanoparticles
(CNP) prepared from Penaeus monodon (Fabricius, 1798) shell waste. On contrary to the most
recognizable adsorption studies using chitin, this is the first study using unique nanoparticles of
650 nm used for the dye adsorption process. The results showed that the adsorption process
increased with increase in the concentration of CNP, contact time and temperature with the dyestuff, whereas the adsorption process decreased with increase in the initial dye concentration
and strong acidic pH. The results from Fourier transform infrared (FTIR) spectroscopy confirmed that the interaction between dyestuff and CNP involved physical adsorption. The
adsorption process obeys Langmuir isotherm (R2 values were 0.992, 0.999 and 0.992 for MB,
BPB and CBB, and RL value lies between 0 and 1 for all the three dyes) and pseudo second order
kinetics (R2 values were 0.996, 0.999 and 0.996 for MB, BPB and CBB) more effectively. The
isotherm and kinetic models confirmed that CNP can be used as a suitable adsorbent material
for the removal of dyestuff from effluents.
ª 2015 Production and hosting by Elsevier B.V. on behalf of Cairo University.
Introduction
* Corresponding author. Tel.: +91 9444834424; fax: +91
4565225216.
E-mail addresses: , (R. Palanivel).
Peer review under responsibility of Cairo University.
Production and hosting by Elsevier
Effluents from various industries contain harmful coloring
agents, which have to be removed to maintain the quality of
the environment. Paper, fabric, leather and dyestuff production
are some of the industries that release harmful effluents [1].
Dyes used in various industries have harmful effects on living
organisms within short exposure periods. The disposal of dyes
in wastewater is an environmental problem that causes ill effects
/>2090-1232 ª 2015 Production and hosting by Elsevier B.V. on behalf of Cairo University.
114
to the ecosystem [2]. Conventional wastewater treatments such
as chemical coagulation, activated sludge, trickling filter, carbon adsorption and photo-degradation were used for the
removal of dyes [3]. Recently adsorption processes have been
demonstrated as a potential technique for the removal of dyes
from wastewater. Dye adsorption is a process of transfer of
dye molecules from bulk solution phase to the surface of the
adsorbent. Screening of biological adsorbents is an eventual
task for environmental scientists and engineers, with its due
merits. The most common biological adsorbents, or material
from which they are produced, used in the process of adsorption
include activated carbon (coconut shell), tree bark, lignin, shellfish shells, cotton, zeolites, fern, and compounds contained in a
number of minerals and microorganisms (bacteria, fungi and
yeast) [4]. Ease of access, cheap rate, reliability and ability to
compete favorably with the conventional adsorbents make the
biological adsorbents on demand than the synthetic ones [5].
Chitin is a biopolymer of 2-deoxy-b-D-glucose
(N-acetylglucosamine), which is linked by b(1–4) glycosidic
bonds found in nature [6]. Chitin is a rigid scaffold found in
arthropod cuticle. Arthropods, include the crustaceans (e.g.
crabs, lobsters, and other isopods), insects (e.g. wasps, bees,
ants, beetles), arachnids (e.g. spiders, scorpions, ticks, mites),
centipedes, millipedes and several lesser groups, account for
approximately 80% of all known animal species [7].
Distribution of chitin is a widespread trait among both unicellular organisms (yeast, protists and diatoms) and invertebrates,
from the first Metazoans (sponges) through the invertebrate
(chordates) and up to fish [8]. In fungi chitin is the characteristic component of the taxonomical groups Zygo-, Asco-,
Basidio- and Deuteromycetes [9]. Chitin can be directly drawn
out in large quantities from crab, prawn shells and seafood
wastes. Penaeus monodon (Fabricius, 1798) is a crustacean
found in all coastal areas worldwide. The waste produced from
shrimps is an emerging problem in countries such as India,
where the food industry is based mainly on seafood [10]. In
India, more than 1,00,000 tons of shrimp bio-waste is generated annually and only an insignificant amount of that biowaste is utilized for the extraction of chitin while the rest is discarded or underutilized [11–14]. Therefore, extraction of economically important chitin from the shells of P. monodon
(Fabricius, 1798) and its utilization in wastewater treatment
are an additional source of income, which also reduces the
problems created by shrimp waste. The application potential
of chitin is multidimensional, such as in food and nutrition,
material science, biotechnology, pharmaceuticals, agriculture
and environmental protection [15]. The stability of chitin
opens the way for the use of chitin as a template molecule
for hydrothermal reactions and ultimately leads to the synthesis of advanced materials [16]. Synthesizing nanoparticles from
chitin and chitosan enhances its application due to its larger
surface area [17]. The aim of the present study was to investigate the CNP adsorption capability on three major industrial
dyes, namely Methylene Blue (MB), Bromophenol Blue
(BPB) and Coomassie Brilliant Blue (CBB). Efficacy of CNP
over dye retention has been investigated at varied operating
conditions such as pH, CNP dosage, contact time and initial
dye concentration. The adsorption capability of CNP toward
these dyes has been evaluated using Langmuir and
Freundlich isotherms and their adsorption kinetics has been
S. Dhananasekaran et al.
analyzed using pseudo first order and pseudo second order
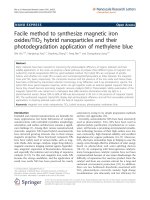
kinetic models. The chemical structure experimental dyes are
presented in Fig. 1(a)–(c).
Material and methods
Materials
P. monodon (Fabricius, 1798) shells were collected from the
Estuary of Southeast coast of Mandapam, Tamil Nadu,
India. Sodium hydroxide, Acetone, Ethanol and
Hydrochloric acid used were purchased from Sisco Research
Laboratories Pvt. Ltd., Mumbai, India, and Dialysis membrane was purchased from HiMedia Laboratories, Mumbai,
India. Methylene Blue, Bromophenol Blue and Coomassie
Brilliant Blue were purchased from Sigma–Aldrich, USA.
Chitin nanoparticles isolation and characterization
Shells of P. monodon (Fabricius, 1798) were collected from the
east coastal regions of (Mandapam) southern Tamil Nadu,
India. The shells were washed in running tap water to remove
the soluble organics, adherent proteins and other impurities.
Washed shells were air dried at 25 ± 1 °C for 2 weeks. Dried
shells were soaked in 0.5 M NaOH at 25 ± 1 °C for 24 h for
the removal of proteins and lipids existing with shells. The
NaOH was drained and the shells were washed with distilled
water until the pH reaches neutral. The shells were again dried
at 50 °C in a hot air oven for 48 h. Dried shells were ground as
fine powder using a domestic blender and subjected to acid
hydrolysis. The shells were soaked in 0.25 M HCl for 45 min
and rinsed with distilled water until the pH reaches neutral.
Again the sample was soaked in 2.5 M NaOH for 6 h at
80 °C and washed with distilled water until the pH reaches
neutral. The alkali treatment was repeated twice and the
remaining organic soluble compounds from the sample were
removed by washing with acetone and ethanol thrice. The sample was dried for 10–15 days in hot air oven at 40 °C and white
colored chitin was obtained.
CNP were isolated from the purified chitin by repeated acid
hydrolysis [17]. Chitin powder was soaked in 3 M HCl for
1.5 h at 90 °C in a water bath. The sample was centrifuged
at 6000 rpm for 10 min and the pellets were collected. The acid
hydrolysis step was repeated thrice and the pellets were suspended in distilled water to dilute the acid concentration.
The suspension was dialyzed against distilled water until it
reaches pH 6 and was homogenized using a tissue homogenizer. The homogenized sample was collected and lyophilized
at À60 °C to get the powder form of CNP. Mechanical disruption and ultrasonication were carried out to cut down the size
of nanoparticles.
UV–Visible spectrophotometer was used to study the
covalent and noncovalent interactions of a compound [18].
UV–Visible spectra of chitin were recorded in aqueous acid
solution (0.1 M HCl) in a 1.0 cm Quartz cell at 25 ± 1 °C.
The absorbance was measured using Shimadzu UV-2401
PC double beam spectrophotometer at the range between
190 and 500 nm range and 0.1 M HCl solution was used
as control.
Adsorption of dyestuffs by a-chitin nanoparticles
Fig. 1
115
Chemical structure of (a) MB, (b) BPB, (c) CBB and (d) Schematic diagram of CNP formation by acid hydrolysis.
Fourier transform infrared (FTIR) spectra of chitin and
CNP were recorded with Nicolet 380 FTIR spectrometer.
The sample was prepared at 0.25 mm thickness as KBr pellets
(1 mg in 100 mg KBr) and stabilized under reactive humidity
before acquiring the spectrum. The spectrum was measured
between 400 and 4000 nm for 32 scans.
Solid state 13C NMR spectrometer was used to analyze the
magic angle spinning (MAS) of the sample (BRUKER DSX300; BrukerBioSpin GmbH, Germany). Crosspolymerization
MAS 13C NMR spectrum of the sample was analyzed at
75 MHz, and the spinning rate was 9 kHz with a contact time
of 0.0001 s and 5 s delay in between 2048 scans. CP-MAS
NMR spectra were used to confirm the allomorphic nature
and to estimate the degree of acetylation (DA) of the chitin
and CNP. DA was calculated by dividing the resonance intensity of methyl group carbon by the average of glycosyl group
carbons using the following equation [19]:
DA% ¼ CH3 I=½C1 I þ C2 I þ C3 I þ C4 I þ C5 I þ C6 I
 100
ð1Þ
X-ray diffraction measurement on the powder sample was
carried out (2 theta = 10–80° at 25 °C) using a diffractometer
system (XPERT-PRO, PANalytical) equipped with Ni-filtered
Cu K-Alpha1 radiation (k = 1.5406 A˚). The diffractometer
was operated with 0.47° divergent and receiving slits at
40 kV and 30 mA. A continuous scan was carried out with a
step size of 0.05° two theta angle and a step time of 10.1 s.
The crystalline index (ICR) was calculated using the diffraction
pattern with methods employed for diffraction studies of the
polymers. Crystalline index was calculated using the intensities
of the peaks at [1 1 0] lattice (maximum intensified peak) and at
amorphous diffraction peak (am) by the following equation
[20]:
ICR % ¼ ðI110 À Iam Þ=I110 Â 100
ð2Þ
Thermo-gravimetric analysis of the chitin and CNP was
done using Shimadzu TGA-Q500 instrument. About 4–6 mg
of the sample was heated at 10 °C/min under nitrogen atmosphere (50 mL/min) in an interval of 20–900 °C.
Morphological examination of CNP was performed by
High Resolution SEM. The sample was coated on copper grid
and the microscopic analysis was conducted using a Quanta
FEI 250, SEM operated at 10 kV.
Transmission Electron Microscopic (TEM) analysis was
performed by dispersing the sample in milli-Q water, where
one drop of the suspension was deposited in a carbon coated
copper grid and allowed to air-dry. TEM imaging was performed using TECHNITE10 (Philips) under 80 kV power supply. Image analysis software ImageJ (National Institutes of
Health, USA) was used to determine the size of the CNP.
Detection of particle size measurements of CNP was conducted using a Zetasizer Nano ZS DLS instrument (Malvern
Instruments, Worcestershire, UK). The instrument used
refractive index RI = 0.197, absorption = 3.090 and water
as dispersant: temperature T = 25 °C, viscosity = 0.8872 cP,
RI = 1.330 for measurements. The derived count rate, in kilo
116
S. Dhananasekaran et al.
counts per second (kcps) was recorded during particle size
measurements.
Adsorption studies
Adsorption experiments were carried out as batch modes.
Stock solution of the dyes was prepared and diluted with double distilled water. The pH of the dye solutions was adjusted
using 0.1 N NaOH or 0.1 N HCl and obtained the desired
pH (2–11). For each experiment, 15 mL of known dye solution
was taken and 15 mg of CNP was added. The mixture was kept
at 25 ± 1 °C and agitated at a constant speed (150 rpm/min).
The samples were then collected and centrifuged at 7000 rpm
for 10 min. The dye concentration in the supernatant was analyzed using a UV–Visible spectrometer. The absorbance at
668 nm (MB), 590 nm (BPB) and 580 nm (CBB) was used to
calculate the equilibrium adsorption of the dyes. The percentage removal of dye was calculated using the following equation
[21]:
Percentage of removal ¼ ððC0 À Ct Þ=C0 Þ Â 100
ð3Þ
where C0 and Ct are the initial and final concentrations of dye
before and after the adsorption in aqueous solution.
Quantity of adsorbed dyes at equilibrium was calculated
using the following equation [22]:
qe ¼ ðC0 À Ct Þv=w
ð4Þ
where C0 is the initial concentration (mg/L), Ct is the dye
concentration at various time intervals (mg/L), v is the volume of experimental solution (mL) and w is the weight (g)
of CNP.
Each experiment was performed in triplicate in identical
conditions and the mean values were calculated.
Adsorption isotherms
Isotherms were used to express the relationship between the
mass of dye adsorbed per unit mass of the adsorbent and the
liquid phase dye concentration [23]. In the present investigation, two isotherm models, namely Langmuir and Freundlich
isotherms have been adopted. The experimental data obtained
from the effect of time interval in adsorption process were used
to calculate the adsorption isotherms (Table 1).
Adsorption kinetics
The experimental data were investigated to study the adsorption process controlling system [24]. The pseudo first order
and second order kinetic models were used and the experimental data obtained from the effect of time interval in adsorption
process were used to calculate the kinetics (Table 1).
Table 1
studies.
Dye
Experimental conditions of isotherm and kinetic
Dye concentration (mg/L) pH
MB 10
BPB 15
CBB 25
6
6
10
Temperature
CNP (mg)
25 ± 1 °C
25 ± 1 °C
25 ± 1 °C
15
15
15
FTIR spectroscopy
Fourier transform infrared (FTIR) spectra of dyes, CNP,
before and after adsorption were recorded with Nicolet 380
FTIR spectrometer. The samples are prepared as described
previously
(Chitin
nanoparticles
isolation
and
characterization).
Results and discussion
Chitin nanoparticle isolation and characterization
White color chitin power was obtained after deproteinization
by NaOH, demineralization by HCl and removal of organic
pigments using acetone and ethanol treatment of the shells.
Further hydrolysis of chitin powder using HCl gives chitin
nanoparticles. The sample was lyophilized in freeze-dryer
and obtained the nanoparticles in powder form. In the present
study, we used dried chitin powder as a precursor material for
the preparation of chitin nanoparticles. Drying of chitin generates strong hydrogen bonds between fibers. Hence when treated with acid it forms nanoparticles instead of nanofibers.
Series of chemical treatments and mechanical disintegration
of shell wastes in wet condition give chitin nanofibers [25–
27]. The mechanism of hydrolysis of chitin into CNP is shown
in Fig. 1(d). The acid hydrolysis of chitin involves two main
reactions namely depolymerization (hydrolysis of glycosidic
bond) and deacetylation (breakdown of N-acetyl linkage),
which was controlled by the concentration of acid used [28].
In the present study, 3 M HCl was used for the hydrolysis of
chitin.
The UV–Visible spectrum of CNP exhibits the maximum
absorption at 201 nm in 0.1 M HCl (Fig. 2(a)). According to
Liu et al. [18] kmax value for N-acetyl glucosamine (GlcNc)
and glucosamine (GlcN) in 0.1 M HCl was 201 nm, which indicates that the monomer units present in the chitin were responsible for the observed kmax value. In the present study, the
absorbance was obtained at 201 nm indicating the presence
of compounds namely N-acetyl glucosamine and glucosamine.
Chitin and chitosan are having two chromophoric groups
including GlcNc and GlcN. The extinction coefficient for
wavelengths shorter than 225 nm was nonzero for these chromophoric groups. The monomer units GlcNc and GlcN contribute to the total absorbance of these polymers at a
particular wavelength which indicates the absence of interaction existing within the chain [18].
FTIR spectrum of chitin and CNP is shown in Fig. 2(b).
The spectra are typical polysaccharides and display a series
of very sharp absorption peaks due to the crystallinity of the
samples. The C‚O stretching region of the amide, lies
between 1600 and 1500 cmÀ1 [27]. The peak corresponds to
amide I and yields different signatures for a-chitin and bchitin. In this study, chitin shows a split amide peak at 1657
and 1630 cmÀ1, likewise CNP show split amide I peak at
1659 and 1625 cmÀ1 and confirms the a allomorph. By contrast, b-chitin produces a single band for amide I [17]. The
absence of peak at 1540 cmÀ1 confirmed that the chitin and
CNP are free from proteins. The peaks for NH stretching present at 3267 cmÀ1 for chitin and 3264 cmÀ1 for CNP, also confirming the purity of the samples. The intra and inter-chain
hydrogen bonds of chitin give peaks at 3445, 3267,
Adsorption of dyestuffs by a-chitin nanoparticles
117
Fig. 2 (a) UV–Visible spectrum of CNP, (b) FTIR spectra of chitin and CNP, (c) 13C Solid state CP-MAS spectra of chitin and CNP, (d)
X-ray diffraction pattern of chitin and CNP and (e) thermo gravimetric analysis of chitin and CNP.
1657 cmÀ1 and CNP give peaks at 3444, 3264, 1659 cmÀ1. Both
chitin and CNP showed similar C-H bending at 1378 cmÀ1.
The strong peaks present in the carbonyl region (1760–
1665 cmÀ1) are characteristic peaks of a-chitin due to the
stretching vibrations of C‚O [29]. Hence the FTIR results
confirmed that chitin and CNP are having same functional
groups but showing shift in the peak value due to variation
in DA and crystalline index.
CP-MAS 13C NMR spectrum of the chitin and CNP is
shown in Fig. 2(c). Eight signals were obtained for eight carbons of the GlcNc, which is a monomer unit of a-chitin. The
spectrum of chitin gives a signal peak at 23.60 ppm for methyl
group and C1–C6 carbons give signals at 104.87, 55.90, 76.50,
84.02, 74.19 and 61.54 ppm respectively. Chitin showed a signal for carbonyl group carbon at 174.43 ppm. Likewise the
methyl group of CNP gives a signal at 22.80 ppm and
C1ÀC6 carbons give signals respectively at 104.14, 55.07,
75.72, 83.08, 73.30 and 60.84 ppm. The carbonyl group of
CNP produced a signal at 173.92 ppm. The C3 and C5 carbons
produced separated signals at 6.50 and 74.19 for pure chitin,
and at 75.72 and 73.30 ppm for CNP respectively. This separation indicates that the isolated chitin was in a-allomorph.
Sajomsang and Gonil [30] have reported that the C3 and C5
signals have been clearly separated into two signals at
75.8 ppm and 73.5 ppm for a-chitin, while the C3 and C5 carbon signals have merged into a single resonance peak at
75 ppm for b-chitin. Cortizo et al. [31] also reported that the
differences between the two polymorphs can be attributed to
differences in the C3 and C5 configurations resulting from
the hydrogen bonds. Very close spectra were also reported
for a-chitin isolated from other sources such as bumble bee
[32], shrimp [7], black coral [33] and cicada sloughs [30].
Signal assignments were made based on Tanner et al. [34].
The degree of acetylation was calculated using Eq. (1). The
calculated DA for the isolated chitin and CNP were 95.61%
and 96.8% respectively. Though during hydrolysis deacetylation occurred, the DA was higher than the starter chitin due
to the reduction in the number of monomer units and removal
of deacetylated monomers while washing with water. Degree
of acetylation has varied based on the source organism, allomorphic nature and mode of isolation [35]. DA values of the
chitin from cicada sloughs and the chitin from rice-field crab
shells were 96.8 ± 0.1% and 97.5 ± 0.1%, respectively [36].
a-chitin has more DA value than that of b-chitin, as it has
not been affected much during demineralization treatment.
The high DA value of the CNP made it insoluble to most of
118
the common solvents when the DA was lower than 50% and
becomes soluble in water under aqueous acidic conditions [37].
The diffraction pattern of the chitin and CNP has shown
that five crystalline reflections in the 2h range 4–40°
(Fig. 2(d)). Highly intensified peak of the a-chitin has 2h value
19.34 and d-spacing 4.58; also CNP have 2h value 19.00° and
d-spacing 4.62 nm. Similarly Joint Committee on Powder
Diffraction Standards (JCPDS card no 351974) has also shown
2h value 19.28° and d-spacing 4.60 nm for a-chitin. Diffraction
pattern of chitin and CNP has shown similar crystalline reflections with the JCPDS.
Crystalline indices of chitin and CNP were calculated using
Eq. (2), and were 79.04% and 83.73% respectively. In the present study, the DA decreases the crystalline index of chitin.
Deacetylation of a polymer is known to decrease the crystalline
index [38]. According to these results, size and DA influence
the crystallinity of chitin. Stawski et al. [39] also reported that
the crystallite size influences in the crystallization, crystalline
perfection of chitin. Hence, chitin has low crystalline index
than that of the CNP.
The TGA curve of chitin and CNP is shown in Fig. 2(e). In
both curves the first stage of weight loss for chitin and CNP
was 6.14% and 10.01% respectively at 60 °C. The second stage
of weight loss for chitin occurs between 200 °C and 350 °C
(42.86%); for CNP weight loss occurs between 240 °C and
450 °C (62.31%). The first stage is assigned to the loss of water
because chitin has strong affinity toward water and therefore
may be easily hydrated. The second stage corresponds to the
thermal decomposition, vaporization and elimination of volatile compounds of chitin. In this study, third step corresponds
to the remaining char and nonvolatile compounds. Al Sagheer
et al. [35] observed similar decomposition TGA curve for
chitin isolated from the marine sources. In the present study
S. Dhananasekaran et al.
CNP have more thermal stability than starter chitin. The property was due to high DA and crystalline index of the CNP.
The morphology of CNP under scanning electron microscope is shown in Fig. 3(a). The micrograph of has showed
dispersed particles with 650 nm in size with agglomerated
morphology. The corresponding morphology of the particles
may be due to the removal of some inorganic materials and
proteins [30].
Transmission electron micrograph of the CNP is shown in
Fig. 3(b). TEM microgram clearly indicates that the nanoparticles are approximately spherical in morphology and have
agglomeration property. Nakorn [40] observed agglomeration
with the particle size of 300 nm in nanowhiskers. In the present
study, CNP formed after consecutive implementation of acidic
hydrolysis and mechanical ultrasonication/disruption have the
average particle size of 49 nm.
Dynamic light scattering of CNP and particle size distribution is depicted in Fig. 3(c). The particle size exhibited a distinct curve with average size of 115 nm. Contrastingly the
TEM analysis shows average particle size of 49 nm. The
increase in the particle size was due to the swelling and
agglomeration property of chitin in aqueous solution. DA,
hydrophobicity and the presence of amino group interacted
with water are the limiting factors of swelling in chitin
[41,42]. Kumar et al. [43] also reported that porosity and presence of ions in the aqueous solution may increase the swelling
property and agglomeration of chitin.
Effect of pH on dye adsorption of CNP
pH plays an important role in aqueous chemistry and surface
binding sites of the adsorbents. The effect of pH on the
Fig. 3 (a) SEM micrograph of CNP at 40,000· magnification, (b) TEM micrograph of CNP at 93,000· magnification and (c) particle
size distribution of CNP by dynamic light scattering.
Adsorption of dyestuffs by a-chitin nanoparticles
adsorption of dyes in the range from 2 to 11 at 25 ± 1 °C with
15 mg CNP in 15 mL of aqueous dye solutions (MB –
10 mg/L, BPB – 15 mg/L and CBB – 25 mg/L) at a contact
time of 30 min was investigated and the respective results are
shown in Fig. 4(a). The percentage removal of dyes was calculated using Eq. (3) for all the operating parameters. The optimum pH of the dyes (MB, BPB and CBB) was 6, 5–6 and 10
respectively. The adsorption process achieved maximum at
acidic pH for MB and BPB, whereas process achieved maximum at strong alkaline pH for CBB. MB is a cationic dye
which is having strong positive charge. Chitin also has positive
charge and point zero pH was 5.3. When there is a decrease in
the pH below point zero pH the surface of the chitin becomes
more positively charged, concentration of H+ was high and
they compete with MB cations for vacant adsorption sites
causing a decrease in dye uptake. In this study the optimum
pH for MB adsorption was 6, which is higher than the point
zero pH. At this pH surface of chitin was negatively charged
and the adsorption of MB was higher. Kushwaha et al. [44]
119
also reported that the pH of the solution to be above the point
zero, and the adsorbent surface was negatively charged and
favors uptake of cationic dyes due to increased electrostatic
force of attraction. In the case of BPB, pH influences the
adsorption process very less. Percentage of adsorption at pH
2 was observed to be about 80.7%, whereas at pH 11 it is
about 82.55% (Fig. 4(a)). For BPB, the maximum adsorption
of 98.6% was observed at pH 6. Physical interactions such as
formation of a hydrogen bond, van der Waals interactions, ion
exchange and pore diffusion also influence the adsorption process [45]. By contrast, CBB shows maximum adsorption at pH
10. It appears that a change in pH of the solution results in the
formation of different ionic species, and different CNP surface
charges. The adsorption was low at lower pH even though the
surface charge of the CNP was positive. This might have happened because of the zwitter ionic property of the dye as it gets
aggregated themselves [46]. In addition, with increase in the
pH the adsorption of CBB gets steadily increased and at pH
10 CBB shows maximum adsorption percentage.
Fig. 4 Percentage removal of MB, BPB and CBB at (a) various pH, (b) various CNP concentration, (c) various initial dye concentration,
(d) different contact time and (e) various temperature by CNP.
120
S. Dhananasekaran et al.
Effect of CNP concentration on dye adsorption
Effect of temperature on the dye adsorption of CNP
Fig. 4(b) shows the effect of CNP concentration in the adsorption process. By varying the CNP concentration between 2 and
20 mg at a constant initial dye concentration (MB – 10 mg/L,
BPB – 15 mg/L and CBB – 25 mg/L) in 15 mL solution at a
contact time of 30 min was studied. All these three dyes have
shown similar results that the increase in concentration of
CNP increases adsorption process. Percentage of adsorption
increased from 15–95%, 27–96% and 51–99% for MB, BPB
and CBB respectively. While there is an increase in the number
of available adsorption sites the overall removal efficiency also
gets increased [47]. Similarly in this study, increase in the concentration of CNP efficiently increases the adsorption process
and 20 mg of CNP has adsorbed more than 95% of dyestuff in
all the experimental dyes.
The effect of temperature on the adsorption at constant dye
concentration (MB – 10 mg/L, BPB – 15 mg/L and CBB –
25 mg/L), pH (6 for MB and BPB, 10 for CBB) and 15 mg
for 30 min time interval and the results are shown in
Fig. 4(e). The result generally showed that the adsorption
increased slightly with increase in temperature for all three
dyes. This is characteristic of endothermic process and indicates that adsorption of dyes onto the chitin was enhanced
at higher temperature. Similar results were reported in the
adsorption of reactive red 141 [56], indigo carmine and trypan
blue [57].
Adsorption isotherms
Langmuir adsorption isotherm
Effect of initial concentration of dyes on adsorption
The effect of various initial dye concentrations (2–20 mg/L for
MB and 5–50 mg/L for BPB and CBB) on adsorption process
at a fixed CNP dosage (15 mg/15 mL) and pH (6 for MB and
BPB, 10 for CBB) for 30 min time interval was studied. An
increase in the initial dye concentration leads to decrease in
the adsorption process of the dyes (Fig. 4(c)). Due to increase
in the concentration gradient between adsorbent and dyestuff,
the percentage of removal was high until the system reaches its
equilibrium. After equilibrium and saturation point, the dye
stuff remains in the solution and the percentage of adsorption
was decreased [48]. In this study, maximum adsorption was
observed at 6 mg/L, 10 mg/L and 5 mg/L for MB, BPB and
CBB respectively. While there is an increase in the dye concentration after equilibrium, a concentration gradient between the
dyestuff and CNP was developed and the adsorption process
was decreased.
Effect of contact time on dye adsorption of CNP
Langmuir isotherm model is the best known adsorption isotherm model for monolayer adsorption. The model can be represented as follows [58]:
Ce =qe ¼ ð1=KL qm Þ þ Ce =qm
where qe is the amount of dye adsorbed at equilibrium (mg/g);
Ce is the concentration of dye at equilibrium (mg/L); qm is the
maximum adsorption capacity of dye per gram of adsorbent
(mg/g); and KL is the Langmuir constant (L/mg). qe value of
dyes was calculated using Eq. (4). The experimental data
Ce/qe were plotted against Ce (Fig. 5(a)). Langmuir constant
KL, and maximum adsorption per unit of the adsorbent (qm)
were calculated from the intercept and slope value of the plot.
Correlation coefficient (R2) was also calculated and the
Langmuir parameters are listed in Table 1 for MB, BPB and
CBB. Calculated R2 value for MB, BPB and CBB were
0.992, 0.999 and 0.992 respectively. Further analysis of
Langmuir equation was carried out, and dimensionless equilibrium parameter (RL) was calculated. RL is used as an indicator
of adsorption experiment [47].
RL ¼ 1=ð1 þ KL Ce Þ
The effect of contact time on the adsorption at constant dye
concentration (MB – 10 mg/L, BPB – 15 mg/L and CBB –
25 mg/L), pH (6 for MB and BPB, 10 for CBB) and 15 mg
CNP at different time intervals (5–50 min) was studied and
the results are shown in Fig. 4(d). The percentage removal
of dyes increased dramatically in the initial stages, whereas,
with increase of contact time the removal of dyes gradually
gets increased until equilibrium. The optimum time taken to
attain equilibrium was 30 min, 15 min and 25 min for MBB,
BPB and CBB respectively. Moreover, within 5 min the percentage removal was obtained at 91% of CBB, 65% of MB
and 79% of BPB by CNP. The adsorption rate was drastic
in the initial contact time due to availability of the reactive site
on the surface of the CNP [49]. Moreover, no significant
changes were observed in the percentage of removal of the dyes
after equilibrium. Similarly the percentage removal was constant after equilibrium due to the slow pore diffusion or saturation of adsorbent and the adsorption percentage was stable
at higher time [49]. Contrary to other low cost adsorbent materials such as chitin hydrogels [23], sugarcane dust [50], neem
sawdust [51], chaff [52], silica nano-sheets [53], Caulerpa racemosa var. cylindracea [54], silkworm exuviae [55], CNP show
faster adsorption rate.
ð5Þ
ð6Þ
where KL is the Langmuir constant and Ce is the initial dye
concentration. The value of RL indicates the adsorption nature
of the dye with the adsorbent. If the RL value is >1, the
adsorption process is unfavorable. Whether the RL value is
equal to 1 or the value lies in between 0 and 1 indicates that
the adsorption is linear and favorable. RL = 0 indicates irreversible adsorption process [47]. In the present investigation,
RL value for all the three dyes falls in between 0 and 1 and
has confirmed that CNP are favorable for MB, BPB and
CBB under the experimental conditions. The adsorption data
were derived from the Langmuir equation and are listed in
Table 2.
The maximum adsorption capacity (qm) of CNP was compared with the reported by-products from the agricultural
and industrial wastes assumed to be low-cost adsorbents and
different dyes used are shown in Table 3. The hydrolyzation
of polymer into nanoparticle form will change the physical
properties of the material such as surface area and particle size
[59]. This could be the reason for increase in the adsorption
process. CNP show the better adsorption among these different biosorbents. Variation in adsorption capacity mainly
attributed to the differences in experimental condition
Adsorption of dyestuffs by a-chitin nanoparticles
121
Fig. 5 (a) Langmuir isotherm, (b) Freundlich isotherm, (c) Pseudo first order kinetics and (d) Pseudo second order kinetic models for
adsorption of MB, BPB and CBB onto CNP.
Table 2 Langmuir, Freundlich, pseudo first order and pseudo second order kinetics parameters for dye (MB, BPB, CBB) adsorption
onto CNP.
Dye
MB
BPB
CBB
Langmuir isotherm model
qm (mg/g)
KL (L/mg) R
6.900
22.720
8.550
0.027
0.003
0.093
Freundlich isotherm model
2
RL
KF (L/mg)
0.992 0.599 0.940
0.999 0.930 1.380
0.992 0.395 1.212
1/n
R
0.137
0.052
0.290
0.875
0.981
0.964
conducted and properties of adsorbent such as the specific surface area, pore size and functional groups in biosorbents [48].
Pseudo first order kinetics
À1
2
k1 (min ) qe (mg/g) R
0.010
0.000
0.018
0.040
1.360
0.435
2
Pseudo second order kinetics
k2 (g/mg.minÀ1) qe (mg/g) R2
0.119 0.086
0.124 0.001
0.722 0.113
9.434
24.390
13.158
0.996
0.999
0.996
Freundlich isotherm describes the heterogeneous system,
reversible adsorption and not monolayer formation.
Thereafter it has been assumed that once a dye molecule occupies a site, no further adsorption could take place at that site
[23]. Freundlich isotherm equation is represented as follows:
wonderful. If the value is between 0.5 and 1 the process is easy
to adsorb and if the value is greater than 1 it is difficult to
adsorb [23]. In the present study 1/n value was closer to zero.
Hence the adsorption process is more heterogeneous for all the
three dyes. Correlation coefficient (R2) was also calculated
from the plot and the Freundlich parameters are listed in
Table 2. When compared to Langmuir isotherm the R2 values
are low for Freundlich isotherm. The present study has shown
that the CNP obey Langmuir isotherm for MB, BPB and CBB.
log qe ¼ log KF þ ðlog Ce Þ=n
Adsorption kinetics
Freundlich absorption isotherm
ð7Þ
where KF and n are Freundlich constants.
The experimental data log qe were plotted against log Ce to
analyze the Freundlich isotherm (Fig. 5(b)). KF (mg/g) is the
Freundlich isotherm constant related to adsorption capacity
and n is the Freundlich isotherm constant related to adsorption intensity which were calculated from the intercept and
the slope value of the plot. When the 1/n value is between
0.1 and less than equal to 0.5 the adsorption process is
Pseudo first order kinetics
The pseudo first order kinetics are represented as follows [24]:
logðqe À qt Þ ¼ log qe À ðk1 t=2:303Þ
ð8Þ
where qe and qt indicate the amount of dye adsorbed at equilibrium and at a specific time (mg/g) and k1 (minÀ1) is the first
order rate constant. First order rate constant k1 was calculated
122
Table 3
S. Dhananasekaran et al.
Comparison of the maximum adsorption of CNP and various adsorbents with different dyestuff.
Adsorbent
Dye
qm (mg/g)
Sources
Sugarcane dust
Neem sawdust
Chaff
Silica nano-sheets
Caulerpa racemosa var. cylindracea
Silkworm exuviae
Chitin hydrogels
CNP
CNP
CNP
Crystal violet
Crystal violet
MB
MB
MB
MB
Malachite green
MB
BPB
CBB
3.80
3.80
30.70
12.66
5.23
29.54
0.10
6.90
22.72
8.55
[50]
[51]
[52]
[53]
[54]
[55]
[23]
Present study
Present study
Present study
from the slope value of the linear plot of log (qe À qt) versus t.
Correlation coefficient (R2) was also calculated from the plot
(Fig. 5(c)). Pseudo first order parameters are listed in Table 2.
Pseudo second order kinetics
The pseudo second order kinetics equation is as follows [24]:
t=qt ¼ 1=ðk2 q2e Þ þ t=qe
ð9Þ
k2 (g/mg min) is the second order rate constant.
Experimental data t/qt were plotted against t (Fig. 5(d))
and calculated the pseudo second order constant K2 and equilibrium adsorption capacity of CNP qe from the intercept and
slope value. Second order kinetic parameters are listed in
Table 2. Correlation coefficient (R2) was also calculated from
the plot. The shape of the line determines which kinetic model
fit for the adsorption process [48]. The R2 values for MB, BPB
and CBB were 0.996, 0.999 and 0.996 respectively. R2 value
indicates that the adsorption process fits better with second
order kinetics rather than first order kinetics.
FTIR analysis of dye adsorption onto CNP
Fig. 6 FTIR spectrum of CNP (a) before and after (b) MB (c)
BPB (d) CBB adsorption.
FTIR spectrum (Fig. 6) was used to analyze the changes in
functional groups of CNP after the adsorption of dyestuff.
The shifting of peaks after adsorption of dyestuff with CNP
is listed in Table 4. Significant changes were observed in the
peak values, which indicate the existence of physical interaction between CNP and the dyestuff. Dolphen and
Thiravetyan [59] have reported similar shifting phenomenon
with the adsorption of melanoidins by chitin fibers and have
also stated that the shifting was due to electrostatic and chemical adsorption. When malachite green was adsorbed using
chitin hydrogels, similar shifting was recorded by Tang et al.
[23].
Conclusions
Table 4 Peaks of CNP and shifting of peak values (nm) after
adsorption of CBB, BPB and CBB.
Vibration modes
CNP CNP–MB CNP–BPB CNP–CBB
OAH stretching vibration 3445 3447
Amide 1
1657 1655
Amide 1
1630 1628
Amide 2
1561 1559
CAH stretching
2925 2891
CAH bending
1378 1378
3442
1660
1634
1556
2922
1379
3445
1651
1635
1556
2923
1380
a-Chitin nanoparticles from the shells of P. monodon
(Fabricius, 1798) were found to be a promising material for
the purification of water dyestuff contamination. The prepared
CNP have 49 nm average particle size with 96.8% DA and
83.73% crystallinity. The experiments done at various physical
parameters have showed that CNP adsorb dyes in a very short
period of exposure in normal environmental conditions and do
not need any specific conditions for the adsorption process.
The experimental data were analyzed using Langmuir,
Adsorption of dyestuffs by a-chitin nanoparticles
Freundlich isotherms, pseudo first and second order kinetics.
By comparing the correlation coefficient determined for each
linear transformation of isotherm analysis, the Langmuir isotherm was found to be the best prediction for the adsorption
of MB, BPB and CBB from aqueous solutions. The results
showed that adsorption of MB, BPB and CBB on CNP fitted
better to the pseudo second order kinetics rather than the
pseudo first order kinetics. The reaction mechanism of adsorption was due to physical adsorption occurring between the dyestuff and the CNP. The shells of P. monodon (Fabricius, 1798)
provide a renewable material and could be acquired from
shrimp farms to ensure a sustainable use of the waste material.
CNP are a simple, fast reacting, low cost biodegradable materials that can be as used for effective environmental protection.
Conflict of interest
123
[10]
[11]
[12]
[13]
The authors have declared no conflict of interest.
Compliance with Ethics Requirements
[14]
This article does not contain any studies with human or animal
subjects.
[15]
Acknowledgments
[16]
The financial support from University Grants Commission,
Govt. of India (40-389/2011(SR)) is gratefully acknowledged.
The authors also thank Indian Institute of Science
Bangalore, Indian Institute of Technology Madras and
Veterinary University, Chennai, for providing instrumental
support.
[17]
[18]
References
[19]
[1] Lin S, Lin C. Treatment of textile waste effluents by ozonation
and chemical coagulation. Water Res 1993;27(12):1743–8.
[2] Ganesh R, Boardman G, Michelsen D. Fate of azo dyes in
sludges. Water Res 1994;28(6):1367–76.
[3] McKay G. Analytical solution using a pore diffusion model for
a pseudo irreversible isotherm for the adsorption of basic dye on
silica. AIChE J 1984;30:692–7.
[4] Kavitha D, Namasivayam C. Experimental and kinetic studies
on methylene blue adsorption by coir pith carbon. Bioresour
Technol 2007;98(1):14–21.
[5] Ciesielczyk F, Bartczak P, Wieszczycka K, Siwin´ska-Stefan´ska
K, Nowacka M, Jesionowski T. Adsorption of Ni(II) from
model solutions using co-precipitated inorganic oxides.
Adsorption 2013;19(2–4):423–34.
[6] Dutta PK, Ravikumar MNV, Dutta J. Chitin and chitosan for
versatile applications. J Macromol Sci Part C Polym Rev
2002;42(3):307–54.
[7] Ehrlich H. Chitin and collagen as universal and alternative
templates in biomineralization. Int Geol Rev 2010;52(7–
8):661–99.
[8] Wysokowski M, Bazhenov VV, Tsurkan MV, Galli R, Stelling
AL, Sto¨cker H, et al. Isolation and identification of chitin in
three-dimensional skeleton of Aplysina fistularis marine sponge.
Int J Biol Macromol 2013;62:94–100.
[9] Muzzarelli RA, Boudrant J, Meyer D, Manno N, DeMarchis M,
Paoletti MG. Current views on fungal chitin/chitosan, human
[20]
[21]
[22]
[23]
[24]
[25]
[26]
[27]
chitinases, food preservation, glucans, pectins and inulin: a
tribute to Henri Braconnot, precursor of the carbohydrate
polymers science, on the chitin bicentennial. Carbohydr Polym
2012;87(2):995–1012.
Wysokowski M, Klapiszewski , Moszyn´ski D, Bartczak P,
Szatkowski T, Majchrzak I, et al. Modification of chitin with
kraft lignin and development of new biosorbents for removal of
cadmium(II)
and
nickel(II)
ions.
Mar
Drugs
2014;12(4):2245–68.
Mathew P, Nair KGR. Ensilation of shrimp waste by
Lactobacillus fermentum. Fish Technol 2006;43:59–62.
Suresh PV, Anil Kumar PK, Sachindra NM. Thermoactive b-Nacetylhexosaminidase production by a soil isolate of Penicillium
monoverticillium CFR 2 under solid state fermentation:
parameter optimization and application for N-acetyl
chitooligosaccharides preparation from chitin. World J
Microbiol Biotechnol 2011;27:1435–47.
Suresh PV, Sachindra NM, Bhaskar N. Solid state fermentation
production of chitin deacetylase by Colletotrichum
lindemuthianum ATCC 56676. J Food Sci Technol
2011;48(3):349–56.
Suresh PV, Anil Kumar PK. Enhanced degradation of a-chitin
materials prepared from shrimp processing byproduct and
production of N-acetyl-D-glucosamine by thermoactive
chitinases from soil mesophilic fungi. Biodegradation 2012;23,
597-7.
Anitha A, Sowmya S, Kumar PS, Deepthi S, Chennazhi KP,
Ehrlich H, et al. Chitin and chitosan in selected biomedical
applications. Prog Polym Sci 2014;39(9):1644–67.
Wysokowski M, Motylenko M, Sto¨cker H, Bazhenov VV,
Langer E, Dobrowolska A, et al. An extreme biomimetic
approach:
hydrothermal
synthesis
of
b-chitin/ZnO
nanostructured composites. J Mater Chem B Mater Biol Med
2013;1(46):6469–76.
Goodrich JD, Winter WT. a-Chitin nanocrystals prepared from
shrimp shells and their specific surface area measurement.
Biomacromolecules 2007;8:252–7.
Liu D, Wei Y, Yao P, Jiang L. Determination of the degree of
acetylation of chitosan by UV spectrophotometry using dual
standards. Carbohydr Res 2006;341:782–5.
Ottey MH, Varum KH, Smidsrod O. Compositional
heterogeneity of heterogeneously deacetylated chitosans.
Carbohydr Polym 1996;29(1):17–24.
Focher B, Beltrame PL, Naggi A, Torri G. Alkaline Ndeacetylation of chitin enhanced by flash treatments, reaction
kinetics and structure modifications. Carbohydr Polym
1996;12(4):405–18.
Mundhe KS, Gaikwad AB, Torane RC, Deshpande NR,
Kashalkar RV. Adsorption of methylene blue from aqueous
solution using Polyalthia longifolia (Ashoka) seed powder. J
Chem Pharm Res 2012;4(1):423–36.
Sun L, Wana S, Luo W. Biochars prepared from anaerobic
digestion residue, palm bark, and eucalyptus for adsorption of
cationic methylene blue dye: characterization, equilibrium, and
kinetic studies. Bioresour Technol 2013;140:406–13.
Tang H, Zhou W, Zhang L. Adsorption isotherms and kinetics
studies of malachite green on chitin hydrogels. J Hazard Mater
2012;209–210:218–25.
Gurusamy A, Lai YL, Jiunn-F L. Adsorption of reactive dye
from an aqueous solution by chitosan: isotherm, kinetic and
thermodynamic analysis. J Hazard Mater 2008;152:337–46.
Ifuku S. Chitin and chitosan nanofibers: preparation and
chemical modifications. Molecules 2014;19(11):18367–80.
Nata IF, Wang SSS, Wu TM, Lee CK. b-Chitin nanofibrils for
self-sustaining hydrogels preparation via hydrothermal
treatment. Carbohydr Polym 2012;90(4):1509–14.
Lu Y, Sun Q, She X, Xia Y, Liu Y, Li J, Yang D. Fabrication
and characterisation of a-chitin nanofibers and highly
124
[28]
[29]
[30]
[31]
[32]
[33]
[34]
[35]
[36]
[37]
[38]
[39]
[40]
[41]
[42]
[43]
S. Dhananasekaran et al.
transparent chitin films by pulsed ultrasonication. Carbohydr
Polym 2013;98(2), 1497–104.
Einbu A, Va˚rum KM. Depolymerization and de-N-acetylation
of chitin oligomers in hydrochloric acid. Biomacromolecules
2007;8(1):309–14.
Gopalan Nair K, Dufresne A. Crab shell chitin whisker
reinforced natural rubber nanocomposites. 1. Processing and
swelling behavior. Biomacromolecules 2003;4(3):657–65.
Sajomsang W, Gonil P. Preparation and characterization of achitin from Cicada Sloughs. Mater Sci Eng C 2010;30:357–63.
Cortizo MS, Berghoff CF, Alessandrin JL. Characterization of
chitin from Illex argentinus squid pen. Carbohydr Polym
2008;74:10–5.
Majtan J, Bılikova K, Markovic O, Grof J, Kogan G, Simuth J.
Isolation and characterization of chitin from bumblebee
Bombusterrestris. Int J Biol Macromol 2007;40:237–41.
Bo M, Bavestrello G, Kurek D. Isolation and identification of
chitin in the black coral Parantipatheslarix Anthozoa: Cnidaria.
Int J Biol Macromol 2012;51:129–37.
Tanner SF, Chanzy H, Vincendon M, Roux JC, Gaill F. Highresolution solid-state carbon-13 nuclear magnetic resonance
study of chitin. Macromolecules 1990;23:3576–83.
Al Sagheer FA, Al-Sughayer MA, Muslim S, Elsabee MZ.
Extraction and characterization of chitin and chitosan from
marine sources in Arabian Gulf. Carbohydr Polym
2009;77:410–9.
Gonil P, Sajomsang W. Applications of magnetic resonance
spectroscopy to chitin from insect cuticles. Int J Biol Macromol
2012;51(4):514–22.
Kasaai MR. Determination of the degree of N-acetylation for
chitin and chitosan by various NMR spectroscopy techniques: a
review. Carbohydr Polym 2010;79:801–10.
Pacheco N, Garnica-Gonzalez M, Gimeno M, Ba´rzana E,
Trombotto S, David L, Shirai K. Structural characterization of
chitin and chitosan obtained by biological and chemical
methods. Biomacromolecules 2011;12(9):3285–90.
Stawski D, Rabiej S, Herczyn´ska L, Draczyn´ski Z.
Thermogravimetric analysis of chitins of different origin. J
Therm Anal Calorim 2008;93(2):489–94.
Nakorn PNA. Chitin nanowhisker and chitosan nanoparticles in
protein immobilization for biosensor applications. J Met Mater
Miner 2008;18(2):73–7.
Shelma R, Paul W, Sharma CP. Chitin nanofibre reinforced thin
chitosan films for wound healing application. Trends Biomater
Artif Org 2008;22:111–5.
Baskar D, Kumar TS. Effect of deacetylation time on the
preparation, properties and swelling behavior of chitosan films.
Carbohydr Polym 2009;78(4):767–72.
Kumar PS, Abhilash S, Manzoor K, Nair SV, Tamura H,
Jayakumar R. Preparation and characterization of novel bchitin/nanosilver composite scaffolds for wound dressing
applications. Carbohydr Polym 2010;80(3):761–7.
[44] Kushwaha AK, Gupta N, Chattopadhyaya MC. Removal of
cationic methylene blue and malachite green dyes from aqueous
solution by waste materials of Daucus carota. J Saudi Chem Soc
2014;18(3):200–7.
[45] Iqbal J, Wattoo FH, Wattoo MHS, Malik R, Tirmizi SA, Imran
M, Ghangro AB. Adsorption of acid yellow dye on flakes of
chitosan prepared from fishery wastes. Arab J Chem
2011;4(4):389–95.
[46] Guo Y, Zhao J, Zhang H, Yang S, Qi J, Wang Z, Xu H. Use of
rice husk-based porous carbon for adsorption of Rhodamine B
from aqueous solutions. Dyes Pigm 2005;66(2):123–8.
[47] Kumar M, Bijay PT, Vinod KS. Crosslinked chitosan/polyvinyl
alcohol blend beads for removal and recovery of Cd(II) from
wastewater. J Hazard Mater 2009;172:1041–8.
[48] El-Sayed GO. Removal of methylene blue and crystal violet
from aqueous solutions by Palm Kernel Fiber. Desalination
2011;272:225–32.
[49] Rodrı´ guez AJM, Mazzoco RR. Adsorption studies of methylene
blue and phenol onto black stone cherries prepared by chemical
activation. J Hazard Mater 2010;180(1–3):656–61.
[50] Khattri SD, Singh MK. Colour removal from dye wastewater
using sugar cane dust as an adsorbent. Adsorpt Sci Technol
1999;17, 269–2.
[51] Khattri SD, Singh MK. Colour removal from synthetic dye
wastewater using a bioadsorbent. Water Air Soil Pollut
2000;120(3–4):283–94.
[52] Han R, Wang Y, Han P, Shi J, Yang J, Lu Y. Removal of
methylene blue from aqueous solution by chaff in batch mode. J
Hazard Mater 2006;137(1):550–7.
[53] Zhao M, Tang Z, Liu P. Removal of methylene blue from
aqueous solution with silica nano-sheets derived from
vermiculite. J Hazard Mater 2008;158(1):43–51.
[54] Cengiz S, Cavas L. Removal of methylene blue by invasive
marine seaweed: Caulerparacemosa var. cylindracea. Bioresour
Technol 2008;99(7):2357–63.
[55] Chen H, Zhao J, Dai G. Silkworm exuviae – a new nonconventional and low-cost adsorbent for removal of methylene
blue from aqueous solutions. J Hazard Mater 2011;186(2–
3):1320–7.
[56] Dolphen R, Sakkayawong N, Thiravetyan P, Nakbanpote W.
Adsorption of Reactive Red 141 from wastewater onto modified
chitin. J Hazard Mater 2007;145(1):250–5.
_ Gu¨zel F. Adsorption of some highly toxic
[57] Akkaya G, Uzun I,
dyestuffs from aqueous solution by chitin and its synthesized
derivatives. Desalination 2009;249(3):1115–23.
[58] Huanga XY, Bub HT, Jianga GB, Zeng MH. Cross-linked
succinyl chitosan as an adsorbent for the removal of Methylene
Blue from aqueous solution. Int J Biol Macromol
2011;49:643–51.
[59] Dolphen R, Thiravetyan T. Adsorption of melanoidins by chitin
nanofibers. Chem Eng J 2011;166:890–5.