Optimisation of heat-moisture treatment conditions for producing high amounts of resistant starches from purple sweet potato and yam starches using response surface methodology
Bạn đang xem bản rút gọn của tài liệu. Xem và tải ngay bản đầy đủ của tài liệu tại đây (592 KB, 0 trang )
Physical Sciences | Chemistry
Doi: 10.31276/VJSTE.60(4).08-14
Optimisation of heat-moisture treatment conditions for producing
high amounts of resistant starches from purple sweet potato and
yam starches using response surface methodology
Van Hung Pham1*, Kim Khanh Nguyen2, Thi Lan Phi Nguyen2
School of Biotechnology, International University,
Vietnam National University Ho Chi Minh city
2
Faculty of Chemical Engineering, Ho Chi Minh city University of Technology
1
Received 9 September 2018; accepted 22 November 2018
Abstract:
Introduction
Heat-moisture treatment, a physical modification
method of starch, causes changes in the internal
structure of starch and thereby produces resistant
starch (RS). In this study, the heat-moisture treatment
conditions (moisture content, heating temperature, and
incubation time) was optimized to maximise the RS
contents of the treated sweet potato and yam starches,
using the Box-Behnken design and response surface
analysis. The predicted maximised RS content of the
treated sweet potato starch (43.9%) was obtained
under optimal conditions of 34.76% moisture content,
heating temperature of 100.11oC, and incubation
time of 6.01h; the predicted maximised RS content of
the treated yam starch (36.8%) was obtained under
optimal conditions of 30.06% moisture content, heating
temperature of 109.68oC, and incubation time of 6.59h
using a quadratic model within the range of various
process variables. The experimental RS contents of
the treated sweet potato and yam starches obtained
under optimal treatment conditions were 42.4% and
35.4%, respectively; this confirms that the models
were valid and adequate because the predicted data
and experiment data did not differ significantly. The
results also indicate that the RS contents of the treated
sweet potato starch were significantly higher than
that of the treated yam starch. As a result, both starch
structure and treatment conditions were determined
to significantly affect the formation of RS in the heatmoisture treated starches.
In modern times, the number of patients who are
overweight or suffer from diabetes is rapidly increasing
both among children and adults because of their high intake
of saturated fatty acids, high total fat intake, and inadequate
consumption of dietary fibre [1-4]. Many studies have
reported that diabetes-related diseases such as obesity,
cardiovascular disease, and type 2 diabetes have been
prevented or controlled by increasing amounts and varieties
of fibre-containing foods [5]. However, the increase in
dietary fibre content in food products significantly affects
sensory and textural properties of these foods, such as
negative effects on the final bread quality, which results in
reduced volume and altered texture and consistency of the
bakery product [6]. Recently, the RS from various starch
sources has been widely used as a ‘low-carbohydrate’
ingredient in food formulations [7] because its health
benefits resemble those of dietary fiber [8-9]. Englyst, et
al. [10] used the term ‘RS’ to describe a small fraction of
starch that resisted to hydrolysis by exhaustive α-amylase
and pullulanase treatment in vitro. Currently, RS is defined
as the fraction of dietary starch which escapes digestion
in the small intestine and does not contribute to the blood
glucose levels of healthy individuals [11]. Therefore, WHO
recommends consuming 27-40 g of RS per day to prevent
colon diseases [9].
Keywords: heat-moisture treatment, resistant starch,
response surface methodology, sweet potato starch,
yam starch.
Classification number: 2.2
Recently, physical, chemical, and enzymatic
modifications have been developed to produce RS from
various starch sources. Among these methods, the heatmoisture treatment (MHT) is a well-known hydrothermal
method of increasing levels of SDS and RS in starches
without destroying their granular structures [12]. The
starch is treated at low moisture levels (<35% moisture,
w/w) and at high temperatures (84-120oC) for 15 min to
16h [13]. Hung, et al. [14] reported that the RS contents
*Corresponding author: Email:
8
Vietnam Journal of Science,
Technology and Engineering
December 2018 • Vol.60 Number 4
Physical sciences | Chemistry
of sweet potato and yam starches increased from 14.7%
and 21.6% in native form to 27.2% and 31.0% in treated
starches, respectively, after heat-moisture treatment at a
moisture content of 30% and at a heating temperature of
110oC for 8h. Conversely, Huang, et al. [15] report that the
RS content of the heat-moisture-treated sweet potato starch
at a moisture content of 30% and at a heating temperature of
100oC for 2h (one cycle) decreased from 25.94% to 13.73%
during the first cycle and then increased to the maximum
amount of 20.99% after five treating cycles. The increase
in RS content was also observed for corn, pea, and lentil
starches after heat-moisture treatment under conditions
of 30% moisture content, a heating temperature of 100oC,
and treatment time of 2h [16]. In addition, Chung, et al.
[16] also demonstrated that the amounts of RS of corn,
pea, and lentil starches treated at 120oC were higher than
those treated at 100oC. Therefore, the differing treatment
conditions of the hydrothermal method resulted in different
degrees of RS formation. Although many heat-moisture
treatment conditions have been applied to investigate
changes in physicochemical properties and digestibility
of starches [17], the results of RS production after heatmoisture treatment of sweet potato starch remained variable
because of the differing treatment conditions used in these
studies [14, 15, 18]. In addition, the amylose content and
starch characteristics, such as crystallinity and chain-length
distribution, also affect the RS formation of starch after
heat-moisture treatment [17]. Therefore, the objective of
this study is to optimise heat-moisture treatment conditions
(moisture content, heating temperature, and incubation time)
to obtain the highest RS contents of sweet potato and yam
starches using Box-Behnken designs and response surface
analysis. Sweet potato and yam starches were selected in
this study because these tuber starches possess different
starch characteristics such as amylose content, chain-length
distribution, and crystallinity [14]. In addition, limited
information concerning RS formation of sweet potato and
yam starches has been previously discovered.
Materials and methods
Alpha-amylase from A. oryzae (~30 U/mg, product #
10065) and amyloglucosidase from A. niger (≥300 U/ml,
product # A7095), which were purchased from SigmaAldrich Co. (St. Louis, MO, US), were used in this
study. Other chemicals were purchased from Merck Co.
(Darmstadt, Germany).
Starch characteristics
Thermal characteristics of starches were determined
using a differential scanning calorimeter (DSC-60,
Shimadzu Co., Kyoto, Japan) [19]. An aluminum vessel
which contained 3.0±0.1 mg of starch and 10 µl of distilled
water was sealed and remained at room temperature for
over 30 min for equilibration. The vessel was then heated
from 30 to 120oC at a rate of 10oC/min by a DSC-60 heater.
An empty vessel was used as a reference. The initial,
peak, and recovery temperatures and transition enthalpy
were automatically calculated using a TA-60WS program
(Shimadzu Co.).
Crystalline characteristics of starches were determined
using an X-ray diffractometer (Rigaku Co., Ltd, Rint-2000
type, Tokyo, Japan). The XRD system was operated at 40
kV and 80 mA, and diffractograms of the starches were
recorded from 2o 2θ to 35o 2θ, with a scanning speed of
8o/min and a scanning step of 0.02o [19].
Box-Behnken designs for heat-moisture treatments of
starches
The heat-moisture treatment of starches was performed
based on the method of Hung, et al. [14]. The starches (100
g) were directly weighed and mixed with water at a desired
moisture content level. The sample was well-dispersed
and equilibrated at room temperature for 24h before being
heated in a forced air oven at a specific temperature for a
controlled duration. After heat-moisture treatment, the
starch samples were cooled and then dried at 45ºC for 24h
to a moisture content of approximately 10%.
Table 1. Coded levels of variables selected for the experiments.
Variable
Materials
Starches used in this study were directly isolated from
fresh purple sweet potatos (Ipomoea batatas) and yams
(Dioscoreaceae atatas) in the laboratory, as previously
reported by Hung, et al. [14]. The isolated sweet potato
contained 1.1% protein, 0.9% lipid, 0.1% ash, and 97.9%
total carbohydrate, while the yam starch contained 0.8%
protein, 1.3% lipid, 0.1% ash, and 97.8% total carbohydrate
[14]. Amylose contents of sweet potato and yam starches
were 18.7 and 22.3%, respectively [14].
Coded
Range and level
-1
0
+1
X1
25
30
35
Heating temperature ( C)
X2
100
110
120
Incubation time (h)
X3
6
7
8
Moisture content (%)
o
A three-factor Box–Behnken design and optimisation
[20] was used to optimise the heat-moisture treatment
conditions for all variable factors to obtain the highest RS
content. Three important factors, including moisture content
(X1), heating temperature (X2), and incubation time (X3)
December 2018 • Vol.60 Number 4
Vietnam Journal of Science,
Technology and Engineering
9
Physical Sciences | Chemistry
were selected as the independent variables, and RS content
(Y) was selected as the dependent response variable. Three
different levels of each independent variable, including
moisture contents (25, 30, and 35%), heating temperatures
(100, 110 and 120oC), and incubation times (6, 7 and 8h)
were used and coded as -1, 0, and +1 for low, middle, and
high levels, respectively, as presented in Table 1. A total
of 15 experiments were conducted for three independent
variables based on the Box-Behnken design.
The mathematical relationship between response (Y)
and independent variables (X) was demonstrated by the
following regression equation.
Where Y is the quadratic response, β0, βi, βj and βij are
the regression coefficients for intercept, linear, quadratic,
and interaction terms, respectively. Xi and Xj are the coded
values of the ith and jth independent variables. The variables
XiXj represent the first order interaction between Xi and Xj
for (i
calculated by solving the regression equation and also
by analysng the response surface contour plots using a
design expert software (version 7.0.0, STAT-EASE Inc.,
Minneapolis, MN, USA). The validity and adequacy of the
predictive models were determined through experimental
analysis at optimal conditions suggested by the design
expert [20].
Determination of starch fractions (RDS, SDS, RS)
After heat-moisture treatment, the native and treated
starches were then measured for rapid digestible starch
(%RDS), slowly digestible starch (%SDS), and RS (%RS)
based on the methods of Englyst, et al. [21], as previously
described by Hung, et al. [14]. Starch (0.3 g, db) was mixed
with 20 ml of sodium acetate buffer (pH 6.0) and boiled for
30 min in a water bath. The sample was then equilibrated
at 37oC for 15 min prior to adding an enzyme solution (5
ml) of α-amylase (1,400 U/ml) and amyloglucosidase (13
AGU/ml). The starch solution was incubated with shaking
at 37oC for 120 min, and the total glucose concentrations
of the 20 min-digested and 120 min-digested hydrolysates
(G20 and G120, respectively) were determined using the
phenol-sulfuric acid method. The remaining residue
was intensively hydrolysed with amyloglucosidase
(50 AGU/ml) after hydrolysing by 7M KOH. The final
hydrolysate was then determined for total glucose
concentration (TG). The total glucose levels at different
digestive times (G20, G120 and TG) were used to calculate for
RDS, SDS, and RS as follows [21]:
Statistical analysis
The statistical analysis was performed through an
analysis of variance (one-way ANOVA) with Duncan’s
multiple-range test to compare treatment means at p<0.05,
using SPSS software version 16 (SPSS Inc., USA).
The regression and graphical analysis of the data was
conducted using a design Expert software (version 7.0.0,
STAT-EASE Inc., Minneapolis, MN, USA).
Results and discussion
Starch characteristics
Table 2. Amylose content and thermal characteristics of sweet
potato and yam starches*.
Amylose
content
(%)
Thermal characteristic
Starch
Onset
(oC)
Peak
(oC)
Completion
(oC)
Enthalpy
(J/g)
Sweet potato
18.7a
71.2a
75.3a
80.2a
17.8a
Yam
22.3b
75.5b
79.3b
86.0b
35.8b
Data followed by the same letter in the same column are not
significantly different (p≤0.05).
*
Thermal characteristics of starches isolated from
sweet potato and yam tubers are indicated in Table 2. The
gelatinisation temperature of the sweet potato starch was
between 71.2 and 80.2oC, which was significantly lower than
that of the yam starch (75.5 to 86.0oC). Transition enthalpy
of the sweet potato starch was also significantly low relative
to the yam starch. The higher transition enthalpy of yam
starch relative to that of the sweet potato starch was due to
the higher amylose content of yam starch relative to sweet
potato starch (Table 2). This result aligns with the previous
reports which stated that the root starches containing higher
amylose contents had a larger transition enthalpy relative to
those containing lower amylose contents [19, 22, 23].
RDS = G20 × 0.9
SDS = (G120 - G20) × 0.9
RS = (TG - G120) × 0.9
10
Vietnam Journal of Science,
Technology and Engineering
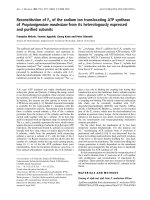
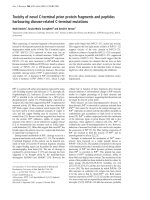
Fig. 1. X-ray diffraction patterns of sweet potato and yam starches.
December 2018 • Vol.60 Number 4
Physical sciences | Chemistry
The X-ray diffraction patterns demonstrated that native
sweet potato and yam starches had different crystalline
structures (Fig. 1). The native sweet potato starch had major
peaks around d-spacings 5.8 Å (line 3b), 5.2, and 4.8 Å (line
4a, 4b) and 3.8 Å (line 6a), while yam starch peaks at 15.8
Å (line 1), about 5.9 Å (line 3a, 3b), 5.2 Å (line 4a), and 4.0
and 3.7 Å (lines 6a, 6b). As a result, the native sweet potato
starch exhibited the A-type crystal, whereas the native yam
starch displayed the B-type crystal, as classified by Zobel
[24]. These results are consistent with those previously
reported by Hoover [25].
which predicted the RS contents of the treated sweet potato
and yam starches were 0.9763 and 0.9565, respectively; this
suggests a high dependence and correlation between the
measured and predicted values of the responses.
Table 3. Full factorial Box-Behnken design matrix with three
independent variables in coded units and experimental
responses.
Experimental response
Coded variable
(RS content, %)
Trial run
Moisture
content (%)
Incubation
Heating
temperature (oC) time (h)
Sweet potato
Yam
Therefore, the differences in amylose contents, thermal
characteristics, and crystalline structures of the native sweet
potato and yam starch may affect RS formation under heatmoisture treatment.
X1
X2
X3
Y1
Y2
1
+1
0
+1
31.96
15.57
2
0
-1
+1
37.65
19.64
Optimisation of RS content through response surface
methodology
3
+1
-1
0
35.15
20.08
4
0
-1
-1
41.64
32.40
5
-1
0
-1
34.08
32.28
6
0
+1
-1
32.44
34.12
7
+1
0
-1
38.34
31.45
8
-1
-1
0
32.93
32.20
9
0
+1
+1
27.48
25.19
10
0
0
0
26.90
30.67
11
0
0
0
27.24
31.35
12
-1
+1
0
24.96
34.46
13
+1
+1
0
29.66
34.57
14
0
0
0
27.10
32.79
15
0
-1
+1
33.95
19.62
Significant factors used in heat-moisture treatment,
including moisture content, heating temperature, and
incubation time, were optimised using Box-Behnken design
to maximise RS contents of sweet potato and yam starches.
Table 3 illustrates the design matrix with three independent
variables (coded values) and experimental responses (RS
contents (% w/w, db) of treated sweet potato and yam
starches). Based on the treatment conditions formulated
by the Box-Behnken design, the highest RS content of the
treated sweet potato starch was 41.64% after treating the
native starch under the conditions of 30% moisture content
at a heating temperature of 100oC for 6h, while the lowest
RS content of this type of starch was 24.96%; this was
obtained under the conditions of 25% moisture content
and a heating temperature of 120oC for 7h. The highest
RS content of the treated yam starch was 34.57%, which
was obtained under treatment conditions of 35% moisture
content and a heating temperature of 120oC for 7h, while
the lowest RS content of this type of starch was 15.57%
under the conditions of 35% moisture content and a heating
temperature of 110oC for 8h. The data were then analysed
through multiple regression analysis, and the regression
coefficients for the equation concerning the relationship
between three variables and a response were determined and
presented in Table 4. Moreover, the results of the analysis
of variance (ANOVA) with the Fisher’s statistical test using
Design Expert software (Design Expert 7.0.0) are indicated
in Table 5. The coefficient of determination (R2), which can
be defined as the ratio of the explained variation to the total
variation, was used to evaluate the fitness and adequacy of
the model. The empirical model fits the actual values if the
R2 value is near unity. The R2 values of the regressed models
Table 4. Coefficients of the response function to predict resistant
starch content of sweet potato and yam starches through
regression analysis.
Factor
Coefficient estimate
Sweet potato
Yam
Intercept
27.08
31.63
X1
1.15
- 2.11
X2
- 4.10
3.00
X3
- 1.93
- 6.28
X1X2
0.62
3.06
X1X3
- 1.56
-0.80
X2X3
- 0.24
0.96
X12
1.69
- 2.19
X2
1.91
0.92
X3
5.81
- 4.68
2
2
X1: moisture content (%); X2: heating temperature (oC); X3:
incubation time.
December 2018 • Vol.60 Number 4
Vietnam Journal of Science,
Technology and Engineering
11
Physical Sciences | Chemistry
Table 5. Analysis of variance for the response surface quadratic
model.
Source
df
Sweet potato
Yam
Table 6. Optimal conditions for producing high amounts of
resistant starches.
Variable
F-value
p-value
F-value
p-value
Yam
Sweet potato
Calculation
Confirmation
Calculation
Moisture content (%)
34.76
35
30.06
Confirmation
30
Heating temperature (oC)
100.11
100
119.68
120
Model
9
22.89
0.0015*
12.22
0.0066*
X1
1
6.71
0.0489*
6.91
0.0466*
Incubation time (h)
6.01
6
6.59
6.5
RS (%)
43.9
42.4
36.8
35.4
X2
1
85.58
0.0002*
13.98
0.0134*
X3
1
18.98
0.0073*
61.13
0.0005*
X1X2
1
0.98
0.3684
7.25
0.0432*
X1X3
1
6.20
0.0551
0.50
0.5101
X2X3
1
0.15
0.7150
0.71
0.4376
X12
1
6.68
0.0492*
3.44
0.1229
X2
1
8.53
0.0330*
0.60
0.4735
X3
1
79.31
0.0003*
15.69
0.0107*
Residual
5
Lack of fit
3
89.19
0.0111
6.67
0.1331
2
2
R
2
0.9763
0.9565
Significant (p-value <0.05); X1: moisture content (%); X2: heating
temperature (oC); X3: incubation time.
*
The F-test and p-value obtained through the analysis of
variance (ANOVA) were used to determine the significance
of each coefficient. The p-value denotes the probability
value. The p-values of the adjusted models were 0.0015 and
0.0066 for both sweet potato and yam starches, respectively;
these were lower than 0.05, which indicates that both models
were significant. For the model of sweet potato starch, the
X1, X2, X3, X12, X22, and X32 factors were the most significant
among the factors which influenced the response because
the p-values of these variables were all lower than 0.05.
For the model of yam starch, X1, X2, X3, and X32 were also
the significant factors which influenced the response, while
the p-value of X1X2 was 0.0432 (lower than 0.05) which
indicates that the interaction between moisture content and
heating temperature affected the response. As a result, the
equations which illustrated the relationship between three
variables including moisture content, heating temperature,
and incubation time, and the responses are formed in a
reduction form as follows:
Y1 = 27.08 + 1.15X1 – 4.10X2 – 1.93X3 +1.69X12 +
1.91X22 + 5.81X32
Y2 = 31.63 – 2.11X1 + 3.00X2 – 6.28X3 + 3.06X1X2 –
4.68X32
where: Y1 and Y2 are the predicted responses of the RS
contents of the sweet potato and yam starches, respectively,
X1, X2, and X3 are coded variables for moisture content,
heating temperature, and incubation time, respectively.
12
Vietnam Journal of Science,
Technology and Engineering
The optimisation of the process variables to maximise
RS contents of the heat-moisture treated sweet potato and
yam starches was performed by solving the quadratic models
using the studied experimental range of various variables.
Table 6 presents the predicted values of the responses under
optimal conditions (in the range constraint) for the models.
For the sweet potato starch, the optimal conditions included
a moisture content of 34.76%, a heating temperature of
100.11ºC, and an incubation time of 6.01h to achieve
the highest RS content of 43.9%. For the yam starch, the
highest RS content was 36.8%, which was achieved under
the optimised conditions of a moisture content of 30.06%,
a heating temperature of 119.68oC, and an incubation time
of 6.59h. These models were experimentally assessed
to confirm the RS contents of the treated sweet potato
and yam starches. However, it is difficult to maintain the
recommended conditions during processing. Therefore,
optimal conditions were targeted using the rounded
numbers of all factors, as displayed in Table 6. As a result,
the experimental RS content of the treated sweet potato
starch under the experimental conditions of heat-moisture
treatment, including moisture content of 35%, heating
temperature of 100oC, and incubation time of 6h, was
42.4%; this did not significantly differ from the calculated
data (43.9%). Likewise, the experimental RS content of
the treated yam starch (35.4%), which was obtained under
the experimental conditions of heat-moisture treatment,
including a moisture content of 30%, a heating temperature
of 120o, and an incubation time of 6.5h, did not significantly
differ from the calculated data (36.8%). Therefore, the model
conditions were targeted to be optimal for the development
of RS contents of the heat-moisture-treated sweet potato and
yam starches, and the data obtained confirmed the validity
and adequacy of the models.
The formation of RS during heat-moisture treatment was
caused by the formation of some interactions during heatmoisture treatment that have survived after gelatinisation
and partly resisted the accessibility of starch chains
through the hydrolysing enzymes [16]. Therefore, both
the treatment conditions, including moisture content,
heating temperature, and time, and starch characteristics,
December 2018 • Vol.60 Number 4
Physical sciences | Chemistry
such as amylose-lipid interactions and amylose-amylose
or amylose-amylopectin interactions, exerted a significant
influence on the digestibility of starches [26]. The results
of this study indicate that the heat-moisture treatment
exerted a greater impact on the sweet potato starch than
the yam starch under optimal treatment conditions. As a
result, the higher RS content of the treated sweet potato at
optimal treatment conditions was obtained relative to that
of the treated yam starch. These results were caused by the
fact that the formation and lateral association of double
helices involving amylopectin chains in the heat-moisture
treated B-type starches would be significantly slower, more
difficult, and less strong relative to the heat-moisture-treated
A-type starch [22]. In addition, the sweet potato starch
required a low temperature (100oC) but a high moisture
content (35%) to form the highest RS content, while the
yam starch required a high temperature (120oC) but a low
moisture content (30%) to maximise RS content. Therefore,
the optimal condition to maximise the RS content of starch
differed based on the nature of the starch.
RS contents of native and treated starches
Amounts of rapid digestible starch (RDS), slowly
digestible starch (SDS), and the RS of native and treated
sweet potato and yam starches are indicated in Table 7.
Amounts of RDS and SDS in native sweet potato starch
were higher than those in native yam starch. However, the
RS content of the native sweet potato starch was lower
relative to the native yam potato. Under optimal heatmoisture treatment conditions, the amounts of SDS and RS
of the treated sweet potato and yam starches significantly
increased relative to those of the native starches. The SDS
and RS contents of the treated sweet potato under optimal
treatment conditions were significantly higher than those of
the treated yam starch, although the amount of RS of the
treated yam starch was higher relative to the treated sweet
potato starch when these starches were heat-moisturetreated under the same conditions of 30% moisture content
and a heating temperature of 110oC for 8h, as reported by
Hung, et al. [14]. In addition, the RS contents of the treated
sweet potato and yam starch obtained in this study under
optimal treatment conditions were significantly higher than
those obtained by Hung, et al. [14]. Therefore, the formation
of RS in the starch through heat-moisture treatment was not
only affected by the internal structures and amylose contents
of the starches but was also affected by the heat-moisture
treatment conditions. The highest amount of RS is obtained
if the starch is treated under optimal conditions specific to
each starch based on the type and structure of the starch.
Table 7. RDS, SDS, and RS of native and heat-moisture-treated
sweet potato and yam starches*.
Sample
RDS (%)
SDS (%)
RS (%)
Native
78.7±2.0d
6.6±0.5a
14.7±1.5a
Heat-moisture
43.2±2.3a
14.4±2.9c
42.4±0.6d
Native
73.8±2.2c
4.7±1.0a
21.6±1.8b
Heat-moisture
55.7±0.3
8.9±1.8
35.4±1.5c
Sweet potato starch
Yam starch
b
b
Data followed by the same letter in the same column are not
significantly different (p≤0.05).
*
Conclusions
The RS contents of the heat-moisture-treated sweet potato
and yam starches were maximised using the Box-Behnken
design and the response surface analysis. The results indicate
that moisture content, heating temperature, and incubation
time were the most pivotal factors which affected the RS
formation of the heat-moisture-treated starch. The quadratic
models within the studied experimental range of various
process variables were used to maximise the RS contents
of the treated starches. As a result, the experimental RS
contents of the treated starches obtained using the optimal
conditions of heat-moisture treatment did not significantly
differ from the data calculated using the quadratic models,
meaning that the models were valid and adequate. Under
optimal treatment conditions, the RS content of the treated
sweet potato starch was higher relative to the treated yam
starch because of the differences in the internal structures
and amylose contents of these starches. Therefore, the heatmoisture treatment condition must be optimised for each
starch to obtain the highest RS content of starch.
ACKNOWLEDGEMENTS
This research is funded by Vietnam National University,
Ho Chi Minh city under grant number B2017-28-03.
The authors declare that there is no conflict of interest
regarding the publication of this article.
REFERENCES
[1] World Health Organization (2016), Global report on diabetes,
Geneva, Switzerland.
[2] S.H. Ley, et al. (2014), “Prevention and management of type
2 diabetes: dietary components and nutritional strategies”, Lancet.,
383(9933), pp.1999-2007.
[3] Food and Agriculture Organization (2010), Fats and fatty
acids in human nutrition: report of an expert consultation, FAO Food
and Nutrition.
[4] Food and Agriculture Organization (2003), Diet, nutrition and
the prevention of chronic diseases, WHO Technical Report Series.
December 2018 • Vol.60 Number 4
Vietnam Journal of Science,
Technology and Engineering
13
Physical Sciences | Chemistry
[5] J.L. Slavin (2005), “Dietary fiber and body weight”, Nutrition,
21(3), pp.411-418.
[6] M. Kurek, et al. (2015), “The application of dietary fiber in
bread products”, J. Food Process Technol., 6, p.447, doi:10.4172/21577110.1000447.
[7] S.K. Patil (2004), “Resistant starches as low-carb ingredientscurrent applications and issues”, Cereal Foods World, 49(5), pp.292294.
[8] S.A.S. Craig, et al. (1998), “Polydextrose as soluble fiber:
physiological and analytical aspects”, Cereal Foods World, 43(5),
pp.370-376.
[9] D.L. Topping, P.M. Clifton (2001), “Short-chain fatty acids
and human colonic function: roles of resistant starch and nonstarch
polysaccharides”, Physiol. Rev., 81(3), pp.1031-1064.
[10] H.N. Englyst, et al. (1982), “Determination of the non-starch
polysaccharides in plant foods by gas-liquid chromatography of
constituent sugars as alditol acetates”, Analyst, 107(1272), pp.307318.
[11] M.G. Sajilata, et al. (2006), “Resistant starch - a review”,
Compr. Rev. Food Sci. Food Safety, 5(1), pp.1-17.
[12] D.B. Thompson (2000), “Strategies for the manufacture of
resistant starch”, Trends in Food Sci. and Tech., 11(7), pp.245-253.
[13] H. Jacobs, J. Delcour (1998), “Hydrothermal modifications
of granular starch with retention of granular structure: a review”, J.
Agric. Food Chem., 46(8), pp.2895-2905.
[14] P.V. Hung, et al. (2014), “Impact of acid and heat-moisture
treatment combination on physicochemical characteristics and
resistant starch contents of sweet potato and yam starches”, Starch,
66(11-12), pp.1013-1021.
[15] T.-T. Huang, et al. (2016), “Effect of repeated heat-moisture
treatments on digestibility, physicochemical and structural properties
of sweet potato starch”, Food Hydrocolloids, 54A, pp.202-210.
[16] H.J. Chung, et al. (2009), “Impact of annealing and heat-
14
Vietnam Journal of Science,
Technology and Engineering
moisture treatment on rapidly digestible, slow digestible and resistant
starch levels in native and gelatinized corn, pea and lentil starches”,
Carbohydr. Polym., 75(3), pp.436-447.
[17] X. Qi, et al. (2016), “Heat and moisture modification of native
starch granules on susceptibility to amylase hydrolysis”, Starch, 68(910), pp.1-5.
[18] S.I. Shin, et al. (2005), “Effect of hydrothermal treatment
on formation and structural characteristics of slowly digestible nonpasted granular sweet potato starch”, Starch, 57(9), pp.421-430.
[19] P.V. Hung, N. Morita (2005), “Physicochemical properties
and enzymatic digestibility of starch from edible canna (Canna
edulis) grown in Vietnam”, Carbohydr. Polym., 61(3), pp.314-321.
[20] George E.P. Box, N.R. Draper (1987), Empirical modelbuilding and response surfaces, John Wiley & Sons.
[21] H.N. Englyst, et al. (1992), “Classification and measurement
of nutritionally important starch fractions”, Eur. J. Clin. Nutr., 46,
pp.S33-S50.
[22] A. Gunaratne, R. Hoover (2002), “Effect of heat-moisture
treatment on the structure and physicochemical properties of tuber
and root starches”, Carbohydr. Polym., 49(4), pp.425-437.
[23] J. Jane, et al. (1999), “Effects of amylopectin branch
chain length and amylose content on the gelatinization and pasting
properties of starch”, Cereal Chem., 76(5), pp.629-637.
[24] H.F. Zobel (1988), “Starch crystal transformations and their
industrial importance”, Starch, 40(1), pp.1-7.
[25] R. Hoover (2001), “Composition, molecular structure, and
physicochemical properties of tuber and root starches: a review”,
Carbohydr. Polym., 45(3), pp.253-267.
[26] J.H. Ahn, et al. (2013), “Slowly digestible sweet potato
flour: preparation by heat-moisture treatment and characterization of
physicochemical properties”, Food Sci. Biotechnol., 22(2), pp.383391.
December 2018 • Vol.60 Number 4