Assessment of particulate matter and lead levels in the Greater Cairo area for the period 1998–2007
Bạn đang xem bản rút gọn của tài liệu. Xem và tải ngay bản đầy đủ của tài liệu tại đây (4.82 MB, 11 trang )
Journal of Advanced Research (2010) 1, 53–63
University of Cairo
Journal of Advanced Research
ORIGINAL ARTICLE
Assessment of particulate matter and lead levels in
the Greater Cairo area for the period 1998–2007
Zeinab Safar
a
b
a,*
, Mounir W. Labib
b,*
Mechanical Engineering Department, Faculty of Engineering, Cairo University, Giza, Egypt
Climate Change Unit, Egyptian Environmental Affairs Agency (EEAA), Misr Helwan Road Bldg. 30, Maadi, Cairo, Egypt
KEYWORDS
Particulate matter (PM);
Lead (Pb);
Air quality monitoring;
Air quality limits (AQL)
Abstract A health risk assessment study conducted in 1994 for the Greater Cairo (GC) area evaluated the environmental health risks to Cairo residents and determined the major health hazards
of ambient lead and particulate matter. In order to determine the spatial and temporal trends in
the concentration of these substances, the Egyptian environmental affairs agency (EEAA) decided
to initiate a pollutant monitoring program. This was conducted with the help of the USA and Denmark. Numerous monitoring sites were established in Egypt. These sites monitored ambient particulate matter (PM10 and PM2.5) and lead through the Cairo air improvement project (CAIP) funded
by USAID. In addition, measurements of SO2, NO2, CO, and O3 were performed through the Egyptian information and monitoring program (EIMP) funded by DANIDA. This paper describes the
ambient particulate matter and lead levels over a period from 1998 through 2007 for the all monitoring sites in GC. In addition, discussions of the sources of the observed pollutants are presented.
ª 2009 University of Cairo. All rights reserved.
Introduction
Megacity is a general term for cities together with their suburbs or recognized metropolitan area, usually with a total population in excess of 10 million people. There is no exact
* Corresponding authors.
E-mail addresses: (Z. Safar), mlabibesp@link.
net (M.W. Labib).
2090-1232 ª 2009 University of Cairo. All rights reserved. Peer review
under responsibility of University of Cairo.
Production and hosting by Elsevier
doi:10.1016/j.jare.2010.02.004
definition of its boundaries. In 2000, 22 cities were identified
as megacities: they are Tokyo, Osaka-Kobe, Mexico City,
New York, Los Angeles, Sa˜o Paulo, Mumbai, Delhi, Kolkata,
Buenos Aires, Shanghai, Jakarta, Dhaka, Rio de Janeiro, Karachi, Beijing, Cairo, Moscow, Manila and Lagos.
Air pollution in urban areas comes from a wide variety of
sources. The single most important source for the classical pollutants sulfur dioxide (SO2), nitrogen oxide (NOx), carbon
monoxide (CO), volatile organic compounds (VOCs) and particulate matter (PM) is generally fossil fuels. Of particular
importance is the burning of fuels for road transport and electricity generation. There are three major sources of air pollution in urban areas, namely mobile sources, stationary
sources, and open burning sources and these can be categorized into source groups: motor traffic, industry, power plants,
trade and domestic fuel.
54
Z. Safar, M.W. Labib
Gurjar et al. (2007) [1] evaluated emissions and air quality
pertaining to all megacities. They also ranked megacities in
terms of their trace gas and particle emissions and ambient
air quality, based on the newly proposed multi-pollutant index
(MPI) which considers the combined level of the three criterion
pollutants (TSP, SO2 and NO2) in view of the World Health
Organization (WHO) guidelines for air quality [2]. Based on
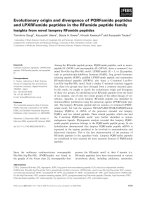
Figure 1
present MPI values, they found that Dhaka, Beijing, Cairo
and Karachi appear to be the most polluted, while OsakaKobe, Tokyo, Sa˜o Paulo, Los Angeles, New York and Buenos
Aires are the least polluted megacities.
Cairo, the capital of Egypt, is the largest city in Africa and
the Middle East. It is located on the banks and islands of the
Nile in the north of Egypt. The population of the Cairo urban
CAIP monitoring site locations in the GC area.
Assessment of particulate matter and lead levels in the Greater Cairo area for the period 1998–2007
agglomeration is 10.8 million and is projected to reach 13.1
million by 2015. GC consists of Cario, Giza and Kalubia,
and has a population of more than 20 million (for the three
governorates including the urban area).
Cairo has a hot, dry desert climate. The monthly average
temperature ranges from 14 °C in January to 29 °C in July.
The maximum daily temperature can reach 43 °C in the summer. The average annual rainfall is only 22 mm and the
monthly maximum of 7 mm occurs in December.
Although Cairo itself is only about 1000 years old, parts of
the metropolis date back to the time of the Pharaohs. In the
nineteenth century, one of the city’s rulers, Khedive Ismail
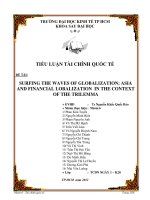
Figure 2
55
(1863–1879), sought to transform Cairo into a European-style
city. This, along with the British occupation of Cairo in 1891,
led to the development of new suburbs for affluent Egyptians
and foreigners. By the turn of the century, most commercial
activity was also moving into modern Cairo.
The urbanization of the GC area has been facilitated by an
extensive flood control program and improved transport facilities developed over the past 30 years. Cairo is the only city in
Africa with a metro system. Although the conservation of agricultural land has long been a priority of Egyptian development
policy, much of the critically needed arable land in Cairo is
being lost to urban development, half of which is illegal; the
EIMP monitoring site locations in the GC area.
56
Z. Safar, M.W. Labib
remainder is planned developments in the desert. Cairo has
about one-third of Egypt’s population and 60% of its industry.
It is one of the world’s most densely populated cities, with one
of the lowest provisions of road space per capita; it is experiencing a dramatic growth in the number of private vehicles.
The government has exacerbated this situation by spending
on bridges and overpasses and by heavily subsidizing fuel, all
of which promote the use of private vehicles.
Emissions from industry and motor vehicles cause high
ambient concentrations of PM, SO2, O3, NOx and CO in
Cairo. However, continuous measurements of these pollutants
need to be conducted to establish the extent of the air quality
problem [3]. Lead levels in Cairo are among the highest in the
world: for example, the annual average concentration of lead
in the Shoubra Kheima area (an industrialized environment
containing several lead smelters) is 23.09 on 1999 lg/m3 and
is estimated to cause 15–20,000 deaths a year, according to a
Table 1
1996 report by the Egyptian environmental affairs agency.
PM lead concentrations ranged from 0.5 lg/m3 in a residential
area to 3 lg/m3 at the city center [4].
Methodology
During the past ten years, two programs have been initiated to
routinely collect air quality monitoring data on a continuing
basis; prior to these programs the concentration of the main
atmospheric pollutants was only measured by research institutions for research work.
Air quality monitoring programs
The environmental information and monitoring program
(EIMP) has established a national monitoring network consisting of 42 air quality monitoring stations; this network was
CAIP air quality monitoring sites.
CAIP site #
CAIP site name
Site code
Samplers
PM2.5
PM10
1*
2
3*
4*
5*
6
7*
8
9
10**
11
12
13*
14*
15
16
17
18
19
20
21
22
23
24
25
26
27
28
29
30
31
32
33
34
35
36
37
Quallaly Square
Gemhoroya Street
El Waily
Nasr City
Fum Al-Khalig
Maadi/Digla
Tebbin South
Old Cairo
Ramses Square
Old Maadi
Giza
El Darb El Ahmer
6th October City
10th Ramadan City
Bilbeis
Mokatam
Shoubra el-Kheima
Shoubra el-Kheima
El Sahel
Shoubra el-Kheima
Matarya
El Waily
Tebbin
Tebbin
Imbaba
Kaha
15th May City
Almaza
Basateen
Giza
Tahrir Square
Zamalek
Helwan
El Massara
Heliopolis
Abbasia
Abu Zaabal
EQS
GEM
MET
NRC
FAK
CAC
TBS
UHC
ERA
CAI
CEH
AAU
OCT
RAM
BLB
ATI
LSA
APC
TTI
MIC
DRC
AMP
TES
LSB
HTI
KFC
MAY
HDM
LRC
CYC
AUC
BIS
HFS
SBH
OLS
EGS
ABZ
X
X
X
X
X
X
X
X
X
X
X
X
X
XC
X
X
X
XC
X
X
X
X
X
X
X
X
Site type
X
X
X
X
X
X
X
X
X
X
X
X
X
XC
X
X
X
X
XC
X
X
X
X
X
X
X
X
X
X
X
X
X
Traffic
Traffic
Mixed
Residential
Traffic
Residential
Industrial
Residential
Traffic
Residential
Residential
Mixed
Residential
Residential
Background
Residential
Source
Industrial
Industrial
Industrial
Mixed
Mixed
Industrial
Source
Residential
Background
Residential
Residential
Mixed
Residential
Mixed
Residential
Residential
Mixed
Residential
Industrial
Industrial
X – one PM2.5 and/or PM10 sampler at site.
XC – two PM2.5 and PM10 samplers collocated at site.
Site # 2 was cancelled on March 18, 2002. Site 4 was cancelled on January 1, 2001. Site 15 was moved to site 37 on February 15, 2002.
Remark: UTM Coordinates for GC area is in UTM zone number 36.
*
Located at or near EIMP monitoring site.
**
Monitoring site with collocation of AirMetrics and BGI samplers.
Assessment of particulate matter and lead levels in the Greater Cairo area for the period 1998–2007
funded by DANIDA. Fourteen of the EIMP sites are located
in the GC area. The Cairo air improvement project (CAIP) has
established a network of 34 stations in the GC area to monitor
ambient air levels of particulate matter and lead and two monitoring sites as source stations in lead smelter locations in
Shoubra Kheima and Tebbin. The CAIP monitoring effort
was intended to provide data to assess the efficacy of CAIP
and other initiatives to improve air quality in Cairo. These initiatives included: implementation of a vehicle emission testing
and tune-up program; introduction of CNG-fueled buses for
public transportation; and abatement of lead by secondary
lead smelter design improvements and lead smelter relocation
[5,6].
Formal operation of the CAIP air monitoring network began on 1 October 1998 and one full year of monitoring data
was collected as of 30 September 1999. The period of 1 October 1998 through 30 September 1999 is considered a ‘‘baseline
year’’. The baseline year monitoring data will serve as a
‘‘benchmark’’ against which future monitoring data can be
compared to assess air quality trends. CAIP and EIMP are
presented in Figs. 1 and 2 for the two networks in the GC area.
CAIP concentrates on pollution from particulate matter (PM)
and lead (Pb) which were the major harmful criterion pollutants in the GC area according to the health risk assessment
study [4] conducted by the Egyptian government and USAID
in 2004, while EIMP concentrates on measuring the other criterion pollutants, SO2, NO2, O3 and CO.
Meteorological data are also being recorded by both programs as the most important parameter for explaining the
air quality data. An automatic weather station (AWS) is
recording: wind speeds, wind direction, air temperature, solar
radiation and relative humidity.
Table 1 presents the CAIP monitoring sites locations and
the monitoring equipment in each site while Table 2 presents
the list of EIMP monitoring sites in the GC area. This table includes the monitoring and sampling equipment at these sites
[7].
Objectives of air quality monitoring
The overall objective of the air quality measurement program
is to obtain a better understanding of urban and residential air
Table 2
57
pollution [2,3] as a prerequisite for finding effective solutions
to air quality problems and for sustainable development in
the urban environment.
It will be important to identify areas where the air quality
limit (AQL) values are exceeded and to identify possible
actions to reduce the pollution load and to improve the general
environmental conditions of the country.
The main purpose of the air quality measurements is to
identify the possible exposure of the population to pollutants.
Information will be collected on ambient air pollution levels in
areas where people live and work. The measurements will cover areas of impact from various sources of pollution.
To enable assessment of air quality and trend analyses, a
network of fixed stations is needed. There are international
rules for estimating the minimum number of sampling points
for fixed measurements in order to assess compliance with limit
values for the protection of human health.
CAIP monitoring sites equipment
AIRmetricse samplers are used to collect PM2.5 and PM10
samples. At 26 sites, both sizes of PM (PM2.5 and PM10) and
Pb (Pb2.5 and Pb10) are measured. At 10 of the monitoring
sites, only PM10 and Pb10 measurements are performed. Two
each of the PM2.5 and PM10 samplers are placed at two sites
(site nos. 19 and 24). Data collected by these collocated samplers are used to estimate the precision of the PM and Pb measurements [6]. The model number of the AIRmetricse
samplers is MiniVol 4.2, and that of the quartz filters is
4.4 cm (Filter Grade: QMA, Whatman Cat No: 1851047).
Samples are collected concurrently at all monitoring sites
on a six-day schedule. During each sampling event, the samplers are programmed to continuously collect a particulate
matter sample over a 24-h period (0000–2400 h). The collocated sites in the CAIP network are numbers 19 (El Sahel)
and 24 (Tebbin).
One PM10 BGI air sampler (EPA-certified) was installed at
CAIP site number 10 with collocation with AIRmetricse for
quality control purposes. The correlation coefficient of
readings for both AIRmetricse and BGI are R2 = 0.9287
for the baseline year, 0.9351 for year 2000 and 0.9322 for year
2001.
EIMP monitoring sites in the GC area [5].
No.
ID
Area type
1
2
3
4
5
6
7
8
9
10
11
12
13
14
Quallaly
Gomhoryia
Abbassyia
Nasr City
El-Maadi
Tabbin
Tabbin South
Fum El-Khalig
Abu Zabel
Shoubra El Kheima
Cairo University
Kaha
6 October
10 Ramadan
Urban Center
Street Canyon
Urban/Residential
Residential
Residential
Industrial
Industrial
Road side/Urban
Industrial/Residential
Industrial
Residential
Back
Residential/Industrial
Residential
PM10
Monitors
Starting date
Samplers
1
1
1
1
1
1
1
1
1
1
1
1
24-May-98
25-December-97
22-May-99
08-October-98
10-December-98
27-October-97
19-October-98
07-November-98
16-November-98
01-May-98
18-July-98
1-July-2001
12-January-99
15-December-98
58
Z. Safar, M.W. Labib
TSP HiVol sampler
EIMP monitoring sites equipment
The instruments used in the EIMP air quality monitoring network can be classified as automatic monitors, semiautomatic
samplers and samplers [8]. There are samplers and monitors
for PM10, and monitors for criterion pollutants other than
PM and lead.
Table 3 presents the monitors being used in the EIMP air
quality monitoring network and Table 4 shows the average
flow rates for the different type of samplers in a specified time.
TEI model 610 TSP HiVol (thermo environment).
Flow rate 68 m3/h.
Glass fiber filter.
Concentration of selected elements (Pb, Zn, Cd, etc.) may
be sampled.
US EPA approved.
Air quality limit values
The assessment of air quality is presently being linked to air
pollution levels and to population distribution. To safeguard
health, concentrations of selected harmful air pollutants
should be limited and related to given ambient air quality
standards.
Air quality limit values for particulate matter and lead are
given in the executive regulations of the environmental law no.
4 of Egypt (1994). These air quality limit values are presented
in Table 5.
PM10 HiVol sampler
TEI model 600 PM10 (thermo environment).
Flow rate 68 m3/h.
US EPA approved.
PM10 AIRmetrics sampler
The MiniVol Portable AIRmetricse sampler is an ambient air
sampler for particulate matter and non-reactive gases. The
EIMP program is using it to sample 24-h average PM10 every
six days through a seven-day programmable timer. The flow
rate is about 5 L/min.
Results and discussion
Monitoring data summary
Ambient particulate matter data in the GC area
Table 3 Monitors used in the EIMP air quality monitoring
network.
Pollutants
PM10
Concentration units
Measurement technique
(lg/m3)
Tapered filter element oscillating
microbalance
Beta gauge ambiant particulate monitor
Instrument type
Table 4
Summary of flow rates.
Instrument
Flow rates
Thermo HiVol TSP/PM10
Thermo PM10 monitor
AIRmetricse
Table 5
m3/min
m3/h
m3/day
m3/week
1.13
0.0189
0.005
67.8
1.134
0.3
1627.2
27.216
7.2
11390.4
190.512
50.4
Ambient air quality limits (AQL), lg/m3.
Pollutant
Law 4 after
modification by the
executive regulations
of October 2005
Averaging time
Total suspended
particulate (TSP)
PM10
230
90
150
70
0.5
1.5
24 h
Annual
24 h
Annual
24 h in Urban areas
Six month average in
industrial areas
Lead in PM10
Generally high levels of PM2.5 and PM10 were recorded across
the entire GC area. This is due to the arid climate and very low
rainfall resulting from the area being surrounded by deserts.
Fig. 3 shows the monthly average PM10 concentrations for
October 1998–December 2007 at the Kaha monitoring site
which is the background site of CAIP, while Fig. 4 shows
the monthly average of PM2.5 concentrations for the same site
for the same period. PM2.5 is measured in GC only through the
CAIP network [8]. The Kaha site is located in the north of the
GC area and is upwind of the general area because the wind
blows mostly from the north.
The high concentrations of PM are, again, due to the arid
climate, as described above.
The average PM2.5/PM10 ratio for all paired measurements
made during the baseline year and the subsequent three years
is 0.51. The variation around the mean ratio expressed as the
standard deviation is ±0.13. In general, PM2.5/PM10 ratios
obtained for all monitoring sites during sampling events were
approximately the same magnitude and exhibited a similar
temporal variation. Also, it can be concluded that the 24 h daily average is fluctuating around the average value stated by the
law and the new executive regulations of 2005 which is 150 lg/
m3.
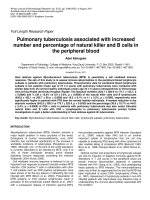
Fig. 5 shows the fluctuations of PM10 concentrations in the
past ten years in GC for some chosen monitoring sites representing different types of area: Abbasya (mixed site), Fum
Al-Kalig and Quallaly (traffic sites), Maadi, Helwan and Heliopolis (residential sites), Shoubra Khema andTebbin (industrial sites), Massara (mixed site) and Kaha (background site).
It appears clearly that PM10 concentrations are high and
more than the annual average stated in the environmental
law of Egypt (no. 4/1994) and the executive regulations approved on October 2005 (70 lg/m3) as the annual average limit. Values are lower in residential areas such as Maadi and
Assessment of particulate matter and lead levels in the Greater Cairo area for the period 1998–2007
59
450.0
400.0
350.0
µgm/m3
300.0
250.0
200.0
150.0
100.0
50.0
Oct-07
Jun-07
Feb-07
Oct-06
Jun-06
Feb-06
Oct-05
Jun-05
Feb-05
Oct-04
Jun-04
Feb-04
Oct-03
Jun-03
Feb-03
Oct-02
Jun-02
Feb-02
Oct-01
Jun-01
Feb-01
Oct-00
Jun-00
Feb-00
Oct-99
Jun-99
Feb-99
Oct-98
0.0
Months
Figure 3
Kaha monthly average of PM10 concentrations from October 1998 through December 2007.
200.0
180.0
160.0
µgm/m3
140.0
120.0
100.0
80.0
60.0
40.0
20.0
Oct-07
May-07
Dec-06
Jul-06
Feb-06
Sep-05
Apr-05
Nov-04
Jun-04
Jan-04
Aug-03
Mar-03
Oct-02
May-02
Average
Aug-01
Mar-01
Nov-00
Jun-00
Jan-00
Aug-99
Mar-99
Oct-98
0.0
Months
Figure 4
Kaha monthly average PM2.5 concentrations from October 1998 through December 2007.
450
400
1998
350
1999
300
2000
μgm/m 3
2001
250
2002
200
2003
2004
150
2005
2006
100
2007
50
0
Abbasya
Fum Al-Khalig
Quallaly
Tebbin
Maadi
Helwan
Massara
Shubra Kheima
Kaha
Monitoring Sites
Figure 5
Annual average PM10 concentrations from October 1998 through December 2007 in different monitoring sites in the GC area.
Heliopolis than in industrial areas as Shoubra Kheima and
traffic areas such as Quallaly. The concentration of PM10 in
Kaha (background site) is lower than the other monitoring
sites because of its location upwind of the GC area.
Another cause for increasing PM10 concentrations is the
existence of more than 15,000 industrial establishments in
the GC area. This was started during the Second World War
when the Allied forces built lots of foundries, smelters and
small factories for the provision of spare parts. This continued
after the 1952 revolution as the population increased and now
there are no defined boundaries between the three governorates. At the beginning of 2009 Giza split into two governorates (Giza and 6th of October) and Cairo split into two
governorates (Cairo and Helwan).
60
Z. Safar, M.W. Labib
the arid climate; there is very little rainfall and an almost constant northern wind which carries dust and sand particles from
the deserts surrounding the GC area and from the Nile delta.
The comparison of annual averages of PM10 and the conclusion
are presented in Fig. 7. The concentrations of PM10 are higher
than in Los Angeles, Mexico City, Santiago and Bogota´.
Sources of PM10 were investigated in 1999 and 2002 to
identify the major source of pollution in the GC area. Fig. 6
shows the average source contributions of PM10 emitted from
different source categories [6,9] in the GC area based on the
source attribution study (SAS) conducted earlier. The first column presents the source attribution results in the GC area during winter 1999; the second column presents the source
attribution results in fall 1999; while the third column presents
the source attribution results in summer 2002.
These data show that sand and soil dust contribute between
30% and 45% of the particulate matter and that burning of
agricultural waste and garbage is considered to be one of the
main causes of higher values of concentrations of particulate
matter in the atmosphere.
Ambient lead data
The annual average Pb10 and Pb2.5 concentration recorded
during the period of 1998 through 2007 are shown in Fig. 9
in the GC area (annual averages of all monitoring sites)
[4,10]. Fig. 8 shows the monthly average concentrations of
Pb10 during the same period for the Shoubra Kheima monitoring site which is downwind of four lead smelters. These lead
smelters were closed and moved from the area in July 2002.
The highest annual average Pb10 levels recorded were 26.2
and 25.4 lg/m3 at the Shoubra Kheima (site no. 18) and El Sahel (site no. 19) monitoring stations, respectively, during the
baseline year (October 98 to September 99). The annual aver-
Comparison of PM10 in the GC area and other megacities
PM10 average annual data were compared in terms of annual
average in some megacities [10], and it was concluded that
the GC area had the maximum values and that this is due to
Fall
280
2%
5.3%
6.9%
240
2.0%
200
27.3%
39%
Winter
3
160
μg/m
2.6%
9.2%
4.2%
3.4%
120
21.7%
Summer
11.7%
9.7%
7.8%
0.7%
3.1%
24.1%
0.9%
80
12.2%
6.5%
7.2%
1.5%
2.1%
3.5%
11.8%
1.3%
0.8%
0.2%
0.5%
1.5%
1.7%
40
46.5%
31.1%
29.3%
0
Mazout Burning
Vehicle Emissions
Sand and Soil Dust
Lead Smelter
Copper Foundries
Cement
Figure 6
PM from Marine Salts
Garbage Burning
Additional Garbage and Agricultural Burning
Secondary PM from Vehicles/Industry
Secondary PM from NH3/CL
Iron & Steel Industry
Average percentage contribution of PM10 source categories in the GC area.
250
μgm/m3
200
150
100
50
0
2000
2001
2002
2003
2004
2005
2006
Santiago
Bogota
Years
Los Angeles
Figure 7
GC area
Mexico
Average annual concentrations of PM10 in some megacities.
2007
Assessment of particulate matter and lead levels in the Greater Cairo area for the period 1998–2007
61
large reduction in lead concentration is found after 2002 due
to the closure of all operating lead smelters.
Generally, the non-attainment sites are located in the
Shoubra Kheima and Tebbin regions where Pb10 concentrations
are more than the annual limit of 1.5 gm/m3. The lead concentrations in these areas have decreased dramatically since 2002.
age Pb10 levels decreased each year after the baseline year until
July 2002 when the lead smelters in the area were closed and
moved to the industrial area of Abou Zaabal.
The monthly average concentration of lead particulate Pb10
at the Shoubra El Khema site, which had the highest levels of
lead concentrations from 1998 to 2007, is shown in Fig. 9. A
4
Pb 10
3.6
3.5
3.3
3.6
Pb 2.5
3.2
3
µgm/m
3
2.5
2
1.7
1.5
1.5
1.7
1.6
1.3
1.3
1.1
0.9
1
1.0
1.0
1.1
0.8
0.5
0.7
0.5
0.3
0.2
0
1998
1999
2000
2001
2002
2003
2004
2005
2006
2007
Figure 8 Annual average concentrations of Pb10 and Pb2.5 from 1998 to 2007 for the GC area (annual averages of all monitoring sites in
the area).
70
60
μgm/m3
50
40
30
20
10
O
ct
-9
Fe 8
b9
Ju 9
n9
O 9
ct
-9
Fe 9
b0
Ju 0
n0
O 0
ct
-0
Fe 0
b0
Ju 1
n0
O 1
ct
-0
Fe 1
b0
Ju 2
n0
O 2
ct
-0
Fe 2
b0
Ju 3
n0
O 3
ct
-0
Fe 3
b0
Ju 4
n0
O 4
ct
-0
Fe 4
b0
Ju 5
n0
O 5
ct
-0
Fe 5
b0
Ju 6
n0
O 6
ct
-0
Fe 6
b0
Ju 7
n0
O 7
ct
-0
7
0
Figure 9
Monthly average Pb10 concentrations from 1998 to 2007 for the Shoubra Kheima industrial site.
30
1998
25
1999
2000
20
µgm/m
3
2001
2002
15
2003
2004
10
2005
2006
5
2007
0
Abbasia
Quallaly
Shoubra
Khema
Tebbin South
Maadi
Helwan
Massara
Kaha
Monitoring Sites
Figure 10
Annual average Pb10 concentrations from 1998 to 2007 for some monitoring sites in the GC area.
62
Z. Safar, M.W. Labib
Figs. 10 and 11 show the annual average concentrations of
Pb10 and Pb2.5 for different monitoring sites in the GC area
from 1998 to 2007. Lead concentrations are clearly higher
for the industrial areas (Shoubra Khema) and traffic sites
(Quallaly) especially from 1998 till 2002 and the concentrations decrease after 2002.
Relations between Pb10/PM10 and Pb2.5/PM2.5
Table 6 shows the ratios of the annual average concentrations
of Pb10/PM10 for the period 1999 through 2007 of Pb2.5/PM2.5
for the period 1999 through 2003 for different monitoring sites
in the GC area. The monitoring sites were chosen to represent
20
µgm/m
3
18
1998
16
1999
14
2000
12
2001
2002
10
2003
8
2004
6
2005
4
2006
2007
2
0
Abbasia
Quallaly
Shobra
Kheima
Tebbin
South
Maadi
Helwan
Massara
Kaha
Monitoring Sites
Figure 11
Table 6
Annual average Pb2.5 concentrations from 1998 to 2007 for some monitoring sites in the GC area.
Ratios of Pb10/PM10 and Pb2.5/PM2.5 for eight monitoring sites in the GC area.
Site
Year
Abbasia
(site #36)
Quallaly
(site # 1)
Shoubra Kheima
(site # 10)
Tebbin South
(site # 7)
Maadi
(site # 10)
Helwan
(site # 33)
Massara
(site#34)
Kaha
(site # 26)
Pb10/PM10
1999
%
2000
%
2001
%
2002
%
2003
%
2004
%
2005
%
2006
%
2007
%
0.68/150
0.453
1.19/ 139.3
0.854
1.38/172.3
0.801
1.21/183.5
0.659
1.08/209.4
0.516
0.95/89.7
1.059
0.88/111.03
0.793
0.67/135.6
0.494
0.54/148.4
0.336
0.704
1.64/246
0.667
1.26/180.0
0.700
1.44/137.8
1.045
1.46/123.4
1.183
1.36/213.9
0.636
1.07/190.7
0.561
0.88/124.5
0.707
0.59/169.24
0.349
0.535/160.2
0.333
0.731
27.44/269
10.201
9.42/225
4.187
5.79/236
2.453
6.19/198
3.126
0.93/223
0.417
1.05/–
0.000
1.09/131
0.832
0.70/189
0.370
0.61/179
0.34
3.084
2.18/259.5
0.840
1.92/254.3
0.755
1.02/267.9
0.381
1.28/288.3
0.444
1.00/217.7
0.459
1.22/238.7
0.511
1.15/212
0.542
–/167
0.000
–/–
0.000
0.562
0.78/157.7
0.495
0.93/159.9
0.582
1.02/187.6
0.544
1.04/142.7
0.729
1.16/162.7
0.713
1.08/166
0.651
1.02/131
0.779
0.94/125.6
0.748
0.76/151
0.503
0.655
0.62/166.6
0.372
1.19/192.9
0.617
1.32/211.6
0.624
0.98/159.9
0.613
1.00/179.1
0.558
0.99/210
0.471
0.76/143
0.531
1.01/154.4
0.654
0.96/132
0.727
0.555
0.56/219.4
0.255
1.01/234.9
0.430
0.95/268.1
0.354
0.93/181.8
0.512
1.01/195.3
0.517
1.06/222.9
0.476
1.17/184
0.636
0.53/166.7
0.318
0.53/169
0.314
0.437
0.44/140
0.314
0.97/146
0.664
1.09/153
0.712
0.76/123
0.618
0.96/158/
0.608
0.94/–
0.000
1.21/99
1.222
0.71/211
0.336
0.2/122
0.16
0.639
1999
%
2000
%
2001
%
2002
%
2003
%
0.7/82
0.854
1.0/81
1.235
1.1/84
1.310
0.9/71
1.268
0.8/87
0.920
1.117
1.3/104
1.250
1.1/116
0.948
1.1/106
1.038
1.2/90
1.333
0.9/86
1.047
1.123
18.2/269
6.766
2.8/225
1.244
3.0/236
1.271
4.9/198
2.475
1.4/223
0.628
2.477
1.7/112
1.518
1.6/113
1.416
0.9/108
0.833
1.0/102
0.980
0.7/94
0.745
1.098
0.5/70.8
0.706
0.9/78
1.154
0.7/74
0.946
0.8/63
1.270
0.8/99
0.808
0.977
0.5/72.4
0.691
1.0/84
1.190
1.2/81
1.481
0.7/62
1.129
1/–
0.000
1.123
0.4/78.2
0.512
1.0/91
1.099
0.8/96
0.833
0.8/61
1.311
0.8/88
0.909
0.933
0.3/79
0.380
0.9/79
1.139
0.9/87
1.034
0.6/62
0.968
0.7/86
0.814
0.867
Average ratio (%)
Pb2.5/PM2.5
Average ratio (%)
The annual average Pb10/PM10 and Pb2.5/PM2.5 ratios for the eight chosen monitoring sites are 0.921% and 1.214%, respectively.
Assessment of particulate matter and lead levels in the Greater Cairo area for the period 1998–2007
the different site types (background, industrial, residential,
traffic and mixed). Each year’s annual average concentrations
are followed by the percentages (%) for the same year.
It can be concluded from Table 6 that the lead concentrations are high in 1999 especially in the industrial sites such
as Shoubra Kheima. The value of Pb10/PM10 in 1999 was
10.201% which means that 10.2% of the PM10 was pure lead
in the Shoubra Kheima area. This value decreased gradually
till it reached 0.34% in 2007. In comparison, the ratio of
Pb10/PM10 in 1999 for Quallaly (traffic monitoring site) was
0.667% in 1999 and in 2007 only 0.333%. For the background
site (Kaha) the ratio was 0.314% in 1999 and 0.16% in 2007.
These values are indicators of the efforts to reduce lead concentrations in the GC area by moving industry to new assigned
areas and using new technologies for production.
It can be concluded too that the ratios of Pb2.5/PM2.5 in
1999 for industrial sites, traffic sites and the background site
fell significantly in 2003, the year when the lead smelters were
transferred outside the residential area of GC.
Conclusions
In the GC area there are two air monitoring networks for measuring criterion pollutants. They are the CAIP network funded
by USAID and the EIMP network funded by DANIDA. The
CAIP network monitors PM and lead, while the EIMP network monitors the other criterion pollutants.
The distribution of PM concentrations is characterized by
large-scale spatial and temporal variations, which are probably
created, in part, by meteorological conditions. Due to the arid
climate, there is a persistent high background PM level in the
GC area that will probably always prevent reducing daily
PM10 levels below the 24-h limit of 70 lg/m3. The GC area
is considered to be one of the megacities which have the highest concentrations of PM10 in the atmosphere.
PM and lead are the major pollutants in the GC area. The
average PM2.5/PM10 ratio for all paired measurements made
during the baseline year and the following three years after is
0.51. Also, the variation about the mean ratio expressed as
the standard deviation is ±0.13. The average Pb2.5/Pb10 ratio
for all paired measurements during the same period is 0.77 and
63
the variation about the mean ratio expressed as the standard
deviation is ±0.11.
Lead pollution is concentrated in two industrial areas,
Shoubra Kheima and Tebbin. The lead concentrations decreased dramatically at these two industrial areas after closing
the lead smelter activities in Tebbin and moving the lead smelters from Shoubra Kheima to another industrial area. This decrease in lead concentrations is due to the EEAA initiatives
supported by USAID funding.
References
[1] Gurjar BR, Butler TM, Lawrence MG, Lelieveld J. Evaluation
of emissions and air quality in megacities. Atmos Environ
2008;42(7):1593–606.
[2] United Nations Environment Programme. Urban air pollution
in megacities of the world: Earthwatch: Global Environment
Monitoring System, Blackwell Reference; 1992.
[3] Nasralla MM. Air pollution in Greater Cairo. In: Proceeding of
the Italian–Egyptian study-days on the environment, Cairo,
Egypt; 1994. p. 88–100.
[4] Sturchio N, Sultan M, Sharkaway ME, Maghraby AE, Taher A.
Concentration and isotopic composition of lead in urban
particulate air, Cairo, Egypt: Argonne National Laboratory,
Argonne, IL and Center for Environmental Hazard Mitigation,
Cairo University, Cairo, Egypt; 1996.
[5] US Environmental Protection Agency (US EPA). National air
pollution trends, procedures document, 1900–1996; EPA-454/R98-008. US Environmental Protection Agency (US EPA),
Research Triangle Park, NC; 1998.
[6] Abu-Allaban M, Gertler AW, Lowenthal DH. A preliminary
apportionment of the sources of ambient PM10, PM2.5 and
VOCs in Cairo. Atmos Environ 2002;36(35):5549–57.
[7] Sivertsen B. National air quality monitoring program for
EEAA. DANIDA Report, Cairo, Egypt; 2004.
[8] Egyptian Environmental Affairs Authority. Monitoring data of
CAIP and EIMP monitoring networks. Egyptian Environmental
Affairs Authority, Egypt; 2004.
[9] Abu-Allaban M, Lowenthal DH, Gertler AW, Labib M.
Sources of PM10 and PM2.5 in Cairo’s ambient air. Environ
Monit Assess 2007;133(1–3):417–25.
[10] Molina MJ, Molina LT. Megacities and atmospheric pollution.
J Air Waste Manag Assoc 2004;54:644–80.