Investigation of some characterizations of black TiO2 nanotubes via spectroscopic methods
Bạn đang xem bản rút gọn của tài liệu. Xem và tải ngay bản đầy đủ của tài liệu tại đây (746.71 KB, 8 trang )
Communications in Physics, Vol. 29, No. 2 (2019), pp. 189-196
DOI:10.15625/0868-3166/29/2/13762
INVESTIGATION OF SOME CHARACTERIZATIONS OF BLACK TiO2
NANOTUBES VIA SPECTROSCOPIC METHODS
NGUYEN TRUONG THO1,2 , CAO MINH THI2 , LE VAN HIEU1 AND PHAM VAN VIET1,†
1 Faculty
of Materials Science and Technology, University of Science – VNU-HCM,
227 Nguyen Van Cu street, District 5, Ho Chi Minh city, Vietnam
2 Ho Chi Minh City University of Technology (HUTECH),
475A Dien Bien Phu street, Binh Thanh District, Ho Chi Minh city, Vietnam
† E-mail:
Received 17 April 2019
Accepted for publication 20 June 2019
Published 27 June 2019
Abstract. Black TiO2 with substantial Ti3+ and oxygen vacancies exhibit an excellent photoelectrochemical water-splitting performance due to the improvement of charge transport by boosting
visible light harvesting. In this study, black TiO2 nanotube arrays synthesized by the anodization
method, and then, they have been investigated some characterizations by spectroscopic methods
such as UV-visible reflectance (UV-vis DRS), Fourier-transform infrared spectroscopy (FTIR),
Raman spectroscopy, and photoluminescence spectrum. The results showed that some highlighted
properties of the black TiO2 nanotube arrays could be applied for efficient water splitting by sunlight.
Keywords: black TiO2 , spectroscopic technique, water-splitting, photocatalysis.
Classification numbers: 29.30.-h.
I. INTRODUCTION
Photoelectrochemical (PEC) and electrochemical water-splitting by a TiO2 electrode is regarded as one of the most promising approaches for clean fuel production such as hydrogen and
oxygen [1, 2]. Notably, one dimensional oriented TiO2 nanotubes (TNAs) which were prepared
c 2019 Vietnam Academy of Science and Technology
190
INVESTIGATION OF SOME CHARACTERIZATIONS OF BLACK TiO2 NANOTUBES . . .
by the electrochemical anodization have been demonstrated to be efficient photoanodes for the
PEC cells [3]. However, the pristine TNAs have a large band gap energy (about 3.3-3.78 eV for
anatase phase at room temperature) leading to weak light harvesting to utilize visible or infrared
light, and the electron-hole recombination rate is too rapid causing the insufficient PEC performance [4]. Previous publications relating using TNAs for the PEC are usually low efficiency
(about 1%) [5,6]. The structure modification of TiO2 have been investigating by many approaches
such as the combination of the quantum dot sensitization, chemical doping/loading the metal or
the narrow gap semiconductor coupling to enhance light absorption and obtain a higher PEC efficiency [6–8]. These works aim to create acceptor states above the valence band (VB) or donor
states below the conduction band (CB) of TiO2 [9]. Recently, a new strategy to generate a new
form of TiO2 which is called black TiO2 , with self-defect states inside its energy structure playing
role as carrier traps below the CB of TiO2 to narrow the band gap for boosting the interaction of
the material with the light irradiation [10]. Besides, these defect states have contributed to the
increase of carrier lifetime impressively for excellent photocatalytic activity and PEC efficiency.
In this study, we used the hydrothermal method to reduce the pristine TNAs to the black
TNAs. After that, we survey the electrochemical characterizations of the black TNAs and compare
with the pristine TNAs.
II. EXPERIMENT
Chemicals and materials
Titanium foils (Ti, 0.25 mm thick, 99.6%), ammonium fluoride (99.9%), ethylene glycol
(99.9%), sodium borohydride (99%), potassium hydroxide (99.9%)
Preparation of materials
TNAs were prepared by 2 steps of the anodization of 2 cm2 Ti sheets. The electrolyte
includes ethylene glycol, distilled water (10 vol %), and NH4 F (0.5 wt. %). The first step of
anodization process was conducted for 2 h, then sonicating before doing the second step of anodization in 30 min (using an applied potential of 30 V DC for both of 2 steps). After that, the
sample was calcinated at 450o C in 2 h for crystallization. After calcination, the TNAs sheet then
treated by hydrothermal method in 1 M NaBH4 solution at 50o C for 12 h, then cleansing by distilled water to form black TNAs.
Characterizations of materials
The morphology of the material was determined by the scanning electron microscopy
(SEM) image. The vibration mode of molecules was detected by Raman spectroscopy using a Raman spectrophotometer, Horiba XploraOne (λ =532 nm) and FT-IR spectroscopy using a FT-IR
spectrophotometer, JASCO-4700. The optical characterization was analyzed by diffuse reflectance
spectroscopy (DRS) over the wavelength range of 200–800 nm using an UV-Vis spectrometer
(JASCO-V550). Photoluminescence (PL) spectra were performed at the room temperature, using
a Horiba Jobin-Yvon Nanolog instrument (Xe lamp, λ = 475 nm) to determine the defects of
materials. The electrochemical characterization with cyclic voltammogram (CV) of materials was
conducted in an electrochemical workstation (Biologic SP240) with three electrodes including a
Pt wire counter electrode, an Ag/AgCl reference electrode in 1 M KOH solution.
NGUYEN TRUONG THO, CAO MINH THI, LE VAN HIEU AND PHAM VAN VIET
191
III. RESULTS AND DISCUSSION
Characterizations of materials
The morphology of the materials was observed by SEM images and indicated on Fig. 1.
Figure 1 shows the morphology of the materials is the tubular structure with the uniform shape
both the pristine TNAs (Fig. 1a) and the black TNAs (Fig. 1b). The average diameter of the tubular
TiO2 is about 80-100 nm. After the reduction process, the morphology of the black TNAs almost
didn’t change compare to the pristine TNAs.
Fig. 1. SEM images of TNAs (a) and black TNAs (b).
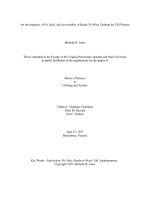
In order to determine the formation of TiO2 , FT-IR spectrum has
been used and the results were shown
in Fig. 2. The appearance of the vibration modes in the region from 500 –
800 cm−1 assigning to the vibration of
Ti-O, which are the characteristic peaks
of TiO2 for both of TNAs and black
TNAs [11]. However, the characteristic peaks of TiO2 in the FTIR spectrum
of black TNAs have shifted to a higher
wavenumber, this can be contributed to
the formation of Ti3+ states in the structure of TNAs to form black TNAs. Besides, the peaks at 3400 cm−1 , 1620
cm−1 assign to bending vibration of OH that implies absorbed water on TNAs
and black TNAs surface and the peak
obtained at 2341 cm−1 related to the
vibration of CO2 gas that absorbed on
black TNAs surface.
Fig. 2. FT-IR spectra of TNAs and black
TNAs.
192
INVESTIGATION OF SOME CHARACTERIZATIONS OF BLACK TiO2 NANOTUBES . . .
To investigate the crystalline phase and
the effect of the defects on the structure of the
black TNAs, Raman spectra have been used
and shown in Fig. 3. The obtained peaks of
both the pristine TNAs and the black TNAs
are almost similar to each other about the Raman shift values. The Raman scattering peaks
in the range of 120 cm−1 to 700 cm−1 could
be assigned to the stretching modes of Ti-O
bonding in TiO2 crystal [12]. For the TNAs
and the black TNAs, the typical peaks have
been obtained at the same wavenumber of 380
cm−1 , 505 cm−1 , and 631.2 cm−1 corresponding to the typical anatase Raman bands of B1g ,
A1g , and Eg vibration modes, respectively [13].
However, there is a peak of the TNAs at 119
cm−1 being shifted strongly to 144 cm−1 after
the formation of the black TNAs and widening
of the FWHM from 18.3 cm−1 to 28.4 cm−1 .
This could be explained due to the disorder
in the crystal lattice of the TiO2 crystal after
Fig. 3. Raman spectra of TNAs
changing into the black TNAs. The appearance
and black TNAs.
of of Ti3+ states in the structure of TiO2 crystal
lattice has led to the shift, which would form a continuum with the conduction band edge and lead
to band tail states merging with the valence band, and thus narrowing the band gap.
Fig. 4 shows the PL spectra of as synthesized samples. As can be seen in Fig. 4a, the PL
intensity of black TNAs sample is strongly reduced. This can be explained due to the formation of
defect states in the energy structure playing a role as electron traps. The electrons cannot migrate
back to the valence band to recombine with the holes leading to reducing the PL intensity and
extend the electron lifetime. To give a clearly evidence for the existence of the defect states inside
the band structure of black TNAs, the Gaussian fitting curves have been made. The Gaussian fitting
curve of the TNAs in Fig. 4b shows two typical peaks at 547 nm (2.27 eV) and 597 nm (2.08 eV)
corresponding to the emission of the recombination of the electrons from oxygen vacancy and
oxygen vacancy losing one electron states, respectively. The Gaussian fitting curve of the black
TNAs in Fig. 4c shows three typical peaks at 522 nm (2.38 eV), 550 nm (2.26 eV) and 595 nm
(2.09 eV). Beside the peaks that attributed to the recombination of electrons from oxygen vacancy
states, the appearance of the peak at 522 nm of wavelength for the black TNAs has attributed to
the luminescence of the recombination of electron from the Ti3+ states, which demonstrates for
the success of the reduction of Ti4+ into Ti3+ after the hydrothermal process, and the effect of this
kind of defect on the shifting of Raman spectra [14]
Fig. 5 shows the DRS spectra of the pristine TNAs and the black TNAs, the interaction
to light of the TNAs sample almost happens in the UV range. However, the black TNAs have a
very good interaction to light in both UV range and visible range, with a much higher absorbance
compared to TNAs sample.
NGUYEN TRUONG THO, CAO MINH THI, LE VAN HIEU AND PHAM VAN VIET
193
Fig. 4. PL spectra of materials (a) and Gaussian fitting curves of TNAs (b), black TNAs (c).
The band gap energy of the materials can be determined by the following Eq. (1) [15].
αhν = A(hν − Eg )2
(1)
where a, h, ν, A, and Eg are absorption coefficient, Plank’s constant, light frequency, a constant,
and band gap energy, respectively. The band gap can be obtained by extrapolating to zero a linear
fit to a plot of against (often referred to as a Tauc’s plot). The estimated optical band gap of the
TNAs is about 3.67 eV (Fig. 5b), which is suitable to other publications about TNAs. As shown
in Fig. 5c, the estimated optical band gap values of the black TNAs sample is 2.93 eV, clearly
indicating for transformation of TNAs into black TNAs with the reduced band gap value. Besides,
the color of the TNAs has been changed into black (Fig. 5c).
Fig. 6 demonstrates that the TNAs and the black TNAs have the same behavior in both of
two scanning processes. The distance between the absorption peak and the desorption peak of H+
for the black TNAs is smaller than that of the TNAs, indicating that the black TNAs are less likely
to be separated from H+ leading to increase the hydrogen evolution reaction efficiency.
194
INVESTIGATION OF SOME CHARACTERIZATIONS OF BLACK TiO2 NANOTUBES . . .
Fig. 5. DRS spectra of materials (a), Kubelka – Munk plots of TNAs (b) and black TNAs (c)
Fig. 6. CV of the TNAs (a) and the black TNAs (b).
NGUYEN TRUONG THO, CAO MINH THI, LE VAN HIEU AND PHAM VAN VIET
195
In alkaline solutions, the electrolyte cation is probably the charge balancing, therefore, in
the first process of scanning, from the positive potential to the negative potential, materials are
attributed to filling of surface states below the conduction band, according to Eq. (2) [16, 17]:
+
TiIV O2 + e− + H+ ←→ TiIV O2 (e−
CB )(H )
(2)
Then, the reaction happens to reduce Ti(IV) to Ti(III), according to Eq. (3):
TiIV O2 + e− + H+ ←→ TiIII O2 (H+ )
(3)
The TiO(OH) could be formed in alkaline solution and the most critical reaction in this
process is the adsorption of H+ into the materials to form hydrogen gas. Usually, the current at
nagative potential increases exponentially, and eventually, hydrogen evolution will be taken by
reduction of water. At negative potential value, the reduction reaction of H+ occurred with the
presence of the current formation.
In the reversed period, the TNAs and the black TNAs have a peak in the oxidation range
after starting the reversed scan. However, this peak was attributed to H+ realeased, and adsorbed
on the surface of the materials.
IV. CONCLUSIONS
In summary, the black TNAs have been successfully prepared by a simple hydrothermal
method with the uniform tubular structure on the Ti substrate. The defects such as Ti3+ and
oxygen vacancies have been obtained in the black TNAs sample, which enhancing the interaction
of the materials to the light irradiation and the electron lifetime. The results show that the assynthesized samples show a dramatically enhanced light absorption to the visible light region and
substantially enhanced electron density in the entire potential window. The black TNAs are less
likely to be separated from H+ leading to increase the hydrogen evolution reaction efficiency.
ACKNOWLEDGMENTS
This research is funded by the University of Science, Vietnam National University Ho Chi
Minh City (VNU-HCM) and the CM Thi Laboratory.
REFERENCES
[1] A. Fujishima and K. Honda, Nature 238 (1972) 37.
[2] M. Gr¨atzel, Nature 414 (2001) 338.
[3] G. Di Carlo, G. Calogero, M. Brucale, D. Caschera, T. de Caro, G. Di Marco and G. M. Ingo, J. Alloys Compd.
609 (2014) 116.
[4] L. A¨ınouche, L. Hamadou, A. Kadri, N. Benbrahim and D. Bradai, Sol. Energy Mater. Sol. Cells 151 (2016) 179.
[5] C. Jiang, S. J. Moniz, A. Wang, T. Zhang and J. Tang, Chem. Soc. Rev. 46 (2017) 4645.
[6] J. H. Park, O. O. Park and S. Kim, App. Phys. Lett. 89 (2006) 163106.
[7] Q. Gui, Z. Xu, H. Zhang, C. Cheng, X. Zhu, M. Yin, Y. Song, L. Lu, X. Chen and D. Li, ACS Appl. Mater.
Interfaces 6 (2014) 17053.
[8] Y.-Q. Zhang, D.-K. Ma, Y.-G. Zhang, W. Chen and S.-M. Huang, Nano Energy 2 (2013) 545.
[9] G. B. Soares, R. A. P. Ribeiro, S. R. De Lazaro and C. Ribeiro, RSC Adv. 6 (2016) 89687.
[10] S. Chen, Y. Xiao, Y. Wang, Z. Hu, H. Zhao and W. Xie, Nanomater. 8 (2018) 245.
[11] A. M. Peir´o, J. Peral, C. Domingo, X. Dom`enech and J. A. Ayll´on, Chem. Mater. 13 (2001) 2567.
[12] M. Mangrola and V. Joshi, Mater. Today: Proceedings 4 (2017) 3832.
[13] P. Ramasamy, D.-H. Lim, J. Kim and J. Kim, RSC Adv. 4 (2014) 2858.
196
[14]
[15]
[16]
[17]
INVESTIGATION OF SOME CHARACTERIZATIONS OF BLACK TiO2 NANOTUBES . . .
D. Cristiana, P. Gianfranco, S. Annabella et al., J. Phys. Chem. C 113 (2009) 20543.
J. Tauc, Mater. Res. Bull. 3 (1968) 37.
T. Berger, T. Lana-Villarreal, D. Monllor-Satoca and R. G´omez, Electrochem. Commu. 8 (2006) 1713.
T. Berger, T. Lana-Villarreal, D. Monllor-Satoca and R. Gomez, J. Phys. Chem. C 111 (2007) 9936.