Comparison of COSMIC measurements with the IRI-2007 model over the eastern Mediterranean region
Bạn đang xem bản rút gọn của tài liệu. Xem và tải ngay bản đầy đủ của tài liệu tại đây (641.81 KB, 5 trang )
Journal of Advanced Research (2013) 4, 297–301
Cairo University
Journal of Advanced Research
ORIGINAL ARTICLE
Comparison of COSMIC measurements with the IRI-2007
model over the eastern Mediterranean region
P. Vryonides *, H. Haralambous
Frederick University, Department of Electrical Engineering, 7 Y. Frederickou Str., Palouriotissa, 1036 Nicosia, Cyprus
Received 1 April 2012; revised 17 September 2012; accepted 26 September 2012
Available online 15 November 2012
KEYWORDS
Ionosphere;
Occultation;
Electron density profile;
Critical frequency
Abstract This paper presents a comparison of the International Reference Ionosphere (IRI-2007)
model over the eastern Mediterranean region with peak ionospheric characteristics (foF2–hmF2)
and electron density profiles measured by FORMOSAT-3/COSMIC satellites in terms of GPS
radio occultation technique and the Cyprus digisonde. In the absence of systematic ionosonde measurements over this area, COSMIC measurements provide an opportunity to perform such a study
by considering observations for year 2010 to investigate the behaviour of the IRI-2007 model over
the eastern Mediterranean area.
ª 2012 Cairo University. Production and hosting by Elsevier B.V. All rights reserved.
Introduction
A constellation of six satellites, called the Formosa Satellite 3–
Constellation Observing System for Meteorology, Ionosphere,
and Climate (COSMIC), was launched in 2006 to improve global weather prediction and space weather monitoring [1].
Three different instruments make up the science payload of
the COSMIC satellites which orbit at 800 km, namely, four
sets of GPS receivers, a Tri-Band (150, 400, and 1067 MHz)
beacon transmitter system, and a tiny ionospheric photometer
at 135.6 nm. In this investigation we deal with the GPS receiver
which is used to obtain atmospheric and ionospheric measurements through phase and Doppler shifts of radio signals. The
* Corresponding author. Tel.: +357 22431355; fax: +357 22438234.
E-mail address: eng.vp@fit.ac.cy (P. Vryonides).
Peer review under responsibility of Cairo University.
Production and hosting by Elsevier
Doppler shift of the GPS L-band signals received by a low
earth orbit (LEO) satellite is used to compute the amount of
signal bending that occurs as the GPS satellite sets or rises
through the earth’s atmosphere as seen from LEO [2,3]. The
primary objective of this paper is to utilise the high spatial resolution of electron density profiles retrieved by COSMIC satellites from radio occultation (RO) measurements and perform
a comparison with F layer peak ionospheric characteristics given by the International Reference Ionosphere model (IRI2007) [4] which is the most widely used empirical ionospheric
model.
COSMIC measurements and IRI model
Each COSMIC satellite is equipped with four antennas, two of
which are used for ionospheric electron density measurements
(one for rising and one for setting occultations). These two
antennas collect L1 and L2 GPS phase data from up to 13
GPS satellites every second. The inversion of COSMIC data
into electron density profiles is based on the difference between
L1 and L2 GPS phase path measurements [5]. Under the
2090-1232 ª 2012 Cairo University. Production and hosting by Elsevier B.V. All rights reserved.
/>
298
P. Vryonides, H. Haralambous
Latitude (degrees north)
assumption of straight-line propagation of GPS signals in the
ionosphere, the difference between the L1 and L2 phase path
measurements (except for a constant offset) is approximately
proportional to the total electron content (TEC) along the line
from the LEO satellite to the GPS satellite [6].
On the basis of the radio occultation technique, the bending
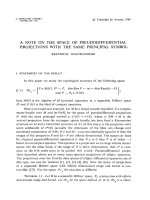
angle of GPS ray received by the GPS receivers can be converted into atmospheric refractive index through the calculation of Abel transformation. In this comparative study 1043
radio occultation profiles obtained in 2010 were considered
all of which had their F peak within the area under examination (between 25–36°N and 22–36°E) as shown in Fig. 1. Electron densities at each altitude as well as peak ionospheric
characteristics and occultation footprint were extracted directly from these profiles provided by the COSMIC Data
Analysis and Archive Center (CDAAC). No further processing
was carried out apart from rejection of profiles which exhibited
excessive electron density fluctuation. In an attempt to compare COSMIC derived foF2 and hmF2 measurements with
values from an additional measurement source, bottomside
electron density profiles measured by the Cyprus digisonde
were also considered and compared to COSMIC profiles over
Cyprus and derived characteristics. In order to make the comparison between COSMIC and digisonde measurements as
accurate as possible, collocation distance between the GPS
occultation at F peak and the ionosonde location was limited
up to 1° in latitude and longitude within a time interval for the
occultation occurrence of 15 min. Only data in geomagnetically quiet conditions were considered in the comparison
(Kp < 2). According to the Abel transformation, the spherical
symmetry of the atmospheric refractive index with respect to
the Earth centre is the most critical assumption of the retrieval
algorithm in radio-occultation of atmospheric parameters. Under this assumption, no horizontal gradient of the refractive index is allowed to exist along the spherical shell of the refractive
index. In addition, the presence of plasma irregularities in the
GPS raypath may cause significant fluctuations of the retrieved
electron density profile, giving rise to large uncertainty of the
estimation and impairment of the data reliability. Therefore,
despite quality control schemes that are being applied at the
CDAAC, in order to reject all possible outlier profiles we used
mean deviation [7] of the electron density profile as an additional measure of quality control of the data used in this study.
No other forms of averaging or filtering were used on the data.
As reported in previous studies there is a systematic discrep-
35
33
31
29
27
25
22
24
26
28
30
32
34
36
Longtitude (degrees east)
Fig. 1 Position of occultations selected from year 2010 used for
IRI validation.
ancy between ionosonde and COSMIC derived peak ionospheric characteristics which is latitude dependent. Peak
electron density (NmF2) as measured by COSMIC is reported
to be systematically smaller than that observed by ionosondes
and the opposite is valid for hmF2. However this discrepancy
was reported to minimise at the latitude range of the area under investigation (low and middle latitudes) [8].
The International Reference Ionosphere (IRI) is an international project sponsored by the Committee on Space Research
(COSPAR) and the International Union of Radio Science
(URSI) based on available experimental observations from
data sources including ground, in situ as well as satellite observations. For a given location, time and date, IRI-2007 provides
monthly averages of the electron density, electron temperature,
ion temperature, and ion composition in the altitude range
from 50 km to 2000 km. There is also the option to tune the
model with measured ionospheric characteristics to obtain a
better representation of the electron density profile and subsequent TEC estimation. This option was exploited in the current
study to estimate electron density profiles and TEC values over
Cyprus. The IRI model was applied under the Nequick topside
option and URSI coefficients (without the storm option) over
the geographical scope of the eastern Mediterranean region at
the footprint location of each occultation as shown in Fig. 1
and also by using automatically and manually scaled foF2
and hmF2 values from a low latitude European ionosonde station in Nicosia to compare with COSMIC electron density profiles and associated TEC values over the station.
Results and discussion
In Fig. 2a we can observe on the same diagram all the foF2
predictions generated by the IRI model and the corresponding
satellite occultation measurements vs time. IRI model predictions were evaluated at the exact coordinates of the F2 peak
in the occultation at the exact time of the occultation event.
Although the IRI model (as run in this scenario) provides a
monthly average foF2 value it is evident from this diagram
that the semi-annual variation in foF2 is represented by both
the IRI model and the COSMIC measurements but we can
identify that foF2_COSMIC is generally within 25–50% of foF2_IRI, with no particular bias towards either being more or
less than the foF2_IRI except during the equinoxes (i.e.
months 3 and 9) when foF2_COSMIC exceeds foF2_IRI by
up to 150% (demonstrated in Fig. 2b).
In Fig. 3a the overall diurnal profile (including all values
considered in this investigation superimposed on the same
diurnal plot) of the difference between COSMIC foF2 and
IRI foF2 is depicted. We can observe the clear tendncy for
COSMIC to exceed IRI estimates at night-time and the opposite trend at daytime.
In Fig. 3b the absolute difference with respect to latitude is
plotted outlining a clear trend (continuous line) for increasing
difference towards the equator which is expected taking into
account the high variability of the ionosphere in this region
and the lack of adequate measurements to represent low latitude regions in IRI.
In an attempt to make some basic comparisons of foF2 and
hmF2 from another measurement source, electron density profiles captured by the Cyprus digisonde were compared to profile derived characteristics observed by COSMIC at the same
IRI-2013 against COSMIC measurements
COSMIC foF2
IRI foF2
(a)
14
foF2_COSMIC-foF2_IRI %
16
299
foF2 (MHz)
12
10
8
6
4
2
0
1
2
3
4
5
6
7
8
9
10 11 12
Month
150.0
100.0
50.0
0.0
-50.0
12
-100.0
1
foF2_COSMIC-foF2_IRI %
(a)
5.0
0.0
0
2
3
4
6
12
18
24
180.0
7
8
9
10
11
12
140.0
120.0
100.0
80.0
60.0
40.0
20.0
0.0
21
23
25
27
29
31
33
35
Latitude (degrees north)
(a) Diurnal and (b) latitude profile of the absolute difference between COSMIC and IRI for 2010 over the investigation region.
approximate time (within 15 min) within 1° for both longitude
and latitude. The scatter diagrams are shown in Fig. 4b and c
along with a scatter diagram of COSMIC vs IRI foF2 values in
Fig. 4a for the whole investigation region (Fig. 1.). Clearly
Fig. 4b and c demonstrate that the correlation between the
COSMIC and digisonde values is higher for foF2 than for
hmF2 for measurements over Cyprus (Nicosia). Probably this
is a result of the automatic scaling process for ionosonde ionograms during which a special algorithm (ARTIST) is applied
to extract peak ionospheric characteristics therefore introducing some inaccuracies in their determination.
We have also used the electron density profiles to estimate
TEC (Total Electron Content) over Cyprus under the assumption that the profile obtained during the occultation matches
12
10
5
(a)
0
5
10
foF2 IRI (MHz)
Fig. 4
R=0.87
COSMIC foF2 (MHz)
COSMIC hmF2 (km)
R=0.8
0
the vertical profile up to the F2 peak that was also measured
by the Cyprus digisonde and the topside model extrapolated
by a model [9]. TEC was obtained by numerical integration
of available electron density profiles from 100 km to LEO orbit
altitude of 800 km. IRI model TEC was estimated with URSI
option and the Nequick topside option but also with peak ionospheric characteristics measured with the Cyprus digisonde as
anchor points. As expected, the IRI model driven by manually
scaled peak characteristics facilitates a more accurate TEC
estimation (as shown in Fig. 5).
As a last step to the COSMIC–IRI comparison study, we
have compared some complete electron density profiles. In
doing so we have found differing examples of IRI performance
over Cyprus. As shown in Fig. 6a IRI_driven (which corre-
340
15
COSMIC foF2 (MHz)
6
(b)
160.0
Hour (UT)
Fig. 3
5
Month
10.0
-5.0
(b)
COSMIC and IRI foF2 (a) values and (b) percentage difference for 2010.
Fig. 2
foF2_COSMIC-foF2_IRI (MHz)
200.0
280
220
(b)
15
160
160
220
280
Nicosia hmF2 (km)
340
R=0.96
8
4
0
(c)
0
4
8
12
Nicosia foF2 (MHz)
(a) COSMIC foF2 vs IRI foF2 and (b) COSMIC hmF2 vs ionosonde hmF2 (c) COSMIC foF2 vs ionosonde foF2.
300
P. Vryonides, H. Haralambous
20
20
R=0.95
15
COSMIC TEC
COSMIC TEC
R=0.90
15
10
5
0
10
5
(b)
(a)
0
5
10
15
0
20
0
IRI TEC
4.00E+10
IRI
8.00E+10
COSMIC
1.20E+11
Altitude (km)
Altitude (km)
IRI driven by foF2_hmF2
1.60E+11
900
800
700
600
500
400
300
200
100
0
0.00E+00
IRI driven by foF2_hmF2)
IRI
COSMIC
Cyprus digisonde
2.00E+11
3.00E+11
Altitude (km)
Altitude (km)
20
IRI driven by foF2_hmF2
2.00E+11
IRI
4.00E+11
COSMIC
6.00E+11
8.00E+11
(b) April 09:00 UT
(a) February 15:00 UT
1.00E+11
15
Electron density Ne (el/m3)
Electron density Ne (el/m3)
800
700
600
500
400
300
200
100
0
0.00E+00
10
COSMIC TEC vs IRI TEC up to 800 km over Cyprus.
Fig. 5
800
700
600
500
400
300
200
100
0
0.00E+00
5
IRI (driven by foF2_hmF2)TEC
4.00E+11
800
700
600
500
400
300
200
100
0
0.00E+00
Electron density Ne (el/m3)
IRI driven by foF2_hmF2
1.00E+11
2.00E+11
IRI
3.00E+11
COSMIC
4.00E+11
5.00E+11
Electron density Ne (el/m3)
(c) January 11:00 UT
(d) April 20:00 UT
Fig. 6 COSMIC profiles vs IRI profiles up to 800 km over Cyprus demonstrating different examples of IRI performance in electron
density profile determination.
sponds to the IRI profile obtained from manually scaled peak
characteristics) provides a good representation of the COSMIC profile, especially the topside. The difference between
IRI and IRI_driven is very significant. In other cases such as
Fig. 6b IRI_driven does not represent very well the COSMIC
profile (not even the topside) as the deviation between IRI and
IRI_driven is very significant. In another case such the one
shown in Fig. 6c IRI_driven represents very well the COSMIC
topside of the profile but deviates significantly in the bottomside. The digisonde topside profile (which is modelled) deviates
significantly from COSMIC and IRI. In the last example
shown in Fig. 6d IRI_driven, COSMIC and IRI match very
well both in the bottomside and topside.
Conclusions
In this study we have attempted to investigate the behaviour of
IRI-2007 model over the eastern Mediterranean area by means
of electron density profiles, peak ionospheric characteristics
and TEC values obtained mainly from occultation measurements and partly from digisonde measurements over Cyprus.
The analysis demonstrated some clear characteristic features
on a seasonal, diurnal and latitudinal basis over the area under
investigation.
References
[1] Schreiner W, Rocken C, Sokolovsky S, Syndergaard S, Hunt
D. Estimates of the precision of GPS radio occultations from
the COSMIC/FORMOSAT-3 mission. Geophys Res Lett
2007;34.
[2] Rocken C, Kuo Y-H, Schreiner W, Hunt D, Sokolovsky S,
McCormick C. COSMIC system description. Terr Atmos Ocean
Sci 2000;11:21–52.
[3] Hajj GA, Romans LJ. Ionospheric electron density profiles
obtained with the global positioning system: results from the
GPS/MET experiment. Radio Sci 1998;33:175–90.
IRI-2013 against COSMIC measurements
[4] Bilitza D, Reinisch BW. International Reference Ionosphere
2007: improvements and new parameters. Adv Space Res
2008;42:599–609.
[5] Liou Y-A, Pavelyev AG, Liu S-F, Pavelyev AA, Yen N, Huang
C-Y, Fong C-J. FORMOSAT-3/COSMIC GPS radio occultation
mission: preliminary results. IEEE Trans Geosci Rem Sens
2007;45(11):2007.
[6] Syndergaard S. A new algorithm for retrieving GPS radio
occultation total electron content. Geophys Res Lett
2002;29(16):1808.
301
[7] Yang KF, Chu YH, Su CL, Ko HT, Wang CY. An examination
of FORMOSAT-3/COSMIC F peak and topside electron density
measurements: data quality criteria and comparisons with the IRI
model. Terr Atmos Ocean Sci 2009;20:193–206.
[8] Chu Y-H, Su C-L, Ko H-T. 2010: A global survey of COSMIC
ionospheric peak electron density and its height: a comparison
with ground-based ionosonde measurements. Adv Space Res
2009;46(4):431–9.
[9] Huang X, Reinisch BW. Vertical electron density profiles from
the digisonde network. Adv Space Res 1996;18:121–9.