Applying fiber bragg grating for acoustic sensor
Bạn đang xem bản rút gọn của tài liệu. Xem và tải ngay bản đầy đủ của tài liệu tại đây (6.47 MB, 7 trang )
Communications in Physics, Vol. 29, No. 3 (2019), pp. 215-221
DOI:10.15625/0868-3166/29/3/13759
APPLYING FIBER BRAGG GRATING FOR ACOUSTIC SENSOR
PARADORN PAKDEEVANICH † , NATTAPON LIKITTANANAN
AND WORRAPASS PROMSEN
Department of Physics, Faculty of Science, Silpakorn University, Nakorn Prathom, Thailand
† E-mail:
pakdeevanich
Received 17 April 2019
Accepted for publication 28 June 2019
Published 15 August 2019
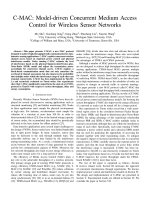
Abstract. In this work, we have interested to utilize Fiber Bragg Grating (FBG) for monitoring
sound intensity level. Acoustic disturbance could induces train and changing the refractive index
of FBG. Therefore, light will interfere for the trough of transmission at one specific wavelength
satisfied Bragg’s condition. In our demonstrations FBG sensor was perturbed with sound intensity
levels of 60, 80 and 100 dB, the measuring Bragg wavelengths were recorded at1552 nm, 1553
nm and 1555 nm,respectively. It was found that the Bragg wavelength shift has a quite linear
variation with sound intensity level. In addition, the sensitivity for sensor was 0.0566 nm/dB. The
obtained results are promising for developing acoustic and vibration sensors
Keywords: fiber-optic detection of sound, optical fibre sensors, fiber Bragg grating sensor, sound
intensity sensor acoustic sensor.
Classification numbers: 42.81.Pa; 07.60.Vg.
c 2019 Vietnam Academy of Science and Technology
216
APPLYING FIBER BRAGG GRATING FOR ACOUSTIC SENSOR
I. INTRODUCTION
In the last decade, tremendous amount of innovation in optical fiber sensors had been challenged to monitor some physical parameters namely temperature, pressure, acceleration, rotation,
force, and vibration of structure. Because of many advantages including immunity towards electromagnetic interference, highly sensitive and compactness fiber optic sensors perform reliable
and highly sensitive tasks over conventional electrical sensors Fiber-optic sensor works by modulating one or more properties of a propagating light wave, including intensity, phase, polarization,
and frequency, in response to the environmental parameter being measured.
A rapid development has led research activity aimed to measure the sound intensity level
or acoustic sensor. Fiber acoustic sensors play important roles in several applications such as oil
exploration, sonar navigation, surveillance, magnetic resonance imaging, structural health monitoring and biological applications. The bare fibers have been used primarily but it performed low
sensitivity. Later, the use of appropriate coating material has been investigated to improve sensitivity of the sensor. In general, those developements were concerned with the mechanism for
conversion of perturbation to the change in the refractive index of cladding of the fiber. Generally,
these mechanisms caused of the changes in optical power at the exit end of the fiber.
We have intended to propose a new design of high sensitivity optical fiber sensor for detection sound. Fiber Bragg Gratings (FBGs) are selected because of high sensitivity and large operational bandwidth. FBG-based sensors have been developed to observe the spectral response [1].
FBG is a distributed Bragg reflector constructed in a short segment of optical fiber. The periodic
modulation of the refractive index in the core of an optical fiber is achieved by using an interference pattern of an intense ultraviolet laser light. When injecting a spectral broadband light into
the fiber, the particular Bragg wavelength will be reflected by the inscribed grating. The Bragg’s
condition for the reflected waves interfered constructively is expressed as [1]
2πneff
2π
=
(1)
2
λB
Λ
λB =2neff
(2)
where λB is the Bragg wavelength of FBG, neff is the effective refractive index of the fiber and
Λ is the grating spacing or the pitch of the grating. The wavelength which satisfied the Bragg’s
condition is reflected back from the grating region and the rest is transmitted. Consequently, the
reflected light achieves the peak at the Bragg wavelength. In parallel, the trough of transmission
occurs at the Bragg wavelength as displayed in Fig. 1.
Theoretically, a longitudinal deformation due to an external perturbation may change both
neff and Λ. The relation between the relative shift in Bragg wavelength of FBG, ∆λB /λB , neff and
Λ applied to the grating at constant temperature is given by the partial derivative of Eq. (2) with
respect to displacement:
∂ neff
∆λB
∂Λ
= 2neff
+ 2Λ
(3)
λB
∂L
∂L
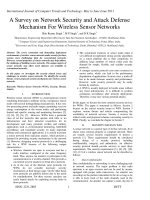
In our design sensor system, it was based on the hypothesis that the variation in sound
intensity is capable of changing neff and Λ parameters. Essentially, applied sound will induce
strain on FBG sensing area. Therefore, the relative shift in the Bragg wavelength (∆λB ) can be
measured and it must be dependent on the level of sound intensity as simulated results in Fig. 2.
PARADORN PAKDEEVANICH et al.
217
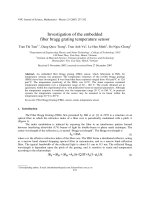
Fig. 1. Structure of sensor based on FBG and intensity for incident light, reflected light
and transmitted light.
Fig. 2. The shift in the Bragg wavelength (∆λB ) for (a) reflected light and (b) transmitted light.
In previous works, H. L. Liu et al. [2] reported the experimental study on FBG strain sensor
and the shifted Bragg wavelengths were monitored. C. Li et al. [3] suggested to use the sidepolished fiber Bragg grating to enhance the performance of optical fiber sensor. M. F. Liang et
al. [4] installed FBG on the cantilever to construct pressure sensor and their innovative sensor
could obtain a sensitivity about 339.956 pm/Mpa. In addition, Z. Zhang et al. [5] employed FBG
to calibrate the effect of temperature and pressure and use metal membrane to control the pressure.
The accuracy of 0.1 hPa in the range 800-1300 hPa was presented.
218
APPLYING FIBER BRAGG GRATING FOR ACOUSTIC SENSOR
II. EXPERIMENT
In our design system, it consisted of a tunable semiconductor laser (SANTEC TSL-210),
FBG (bandwidth wavelength of 1525-1565 nm) and spectrum analyzer (ANDO AQ6317B) as
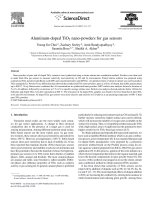
shown photographs in Fig. 3. Loudspeaker was generated from Samsung Galaxy S7 Edge with
sound generator application. IPhone 6 with sound analyzer application was utilized to monitor
sound intensity level. The schematic diagram of the experimental setup was shown in Fig. 4.
The power of optical light sources was fixed a constant power output at 3.2 mW (across all wavelengths) and connected the optical aperture with FBG. The wavelength of laser was tuned between
1530 nm to 1610 nm (increasing in step of 1 nm). The output of FBG was connected to spectrum
analyser. The frequency of loudspeaker was set constantly at 1000 Hz and operated the sound
intensity level at 60, 80 and 100 dB. For each intensity level of sound, we performed and repeated
experiment for 3 times. Optical output power and FBG wavelength shifts were measured and
recorded by spectrum analyzer. Then, the obtained results were averaged. In the situation that
operated the sensor without perturbation was served as the reference.
(a)
(b)
(c)
Fig. 3. The photographs of (a) tunable semiconductor laser, (b) single mode FBG and (c)
spectrum analyzer.
PARADORN PAKDEEVANICH et al.
219
Fig. 4. The schematic diagram of the experimental setup.
III. RESULTS AND DISCUSSION
For undisturbing situation, the output spectrum showed the trough of transmission at the
wavelength 1549 nm. When generated sound to disturb FBG, the transmitted spectra for sound
intensity level 60, 80 and 100 dB were obtained as presented in Fig. 5(a), 5(b) and 5(c), respectively.
The wavelength shift (∆λB ) for each sound intensity level (Isound ) was monitored and plotted graph as shown in Fig. 6.
According to Fig. 6, we obtained the linear relationship between the wavelength shift (∆λB )
and the sound intensity level (Isound ) as the following equation,
∆λB = 0.0566Isound − 0.1726
(4)
Therefore, we could determine the sensitivity of our sensor to be equal to 0.0566 nm/dB.
However, we admitted that our experimental results lacked of studying in the stability of sound
measurement in practice. It is necessary to investigate the stability of the FBG wavelength shifts
since it strongly depend on other parameter of sound such as the direction of sound and the vibration frequency. To achieve a higher detection sensitivity, our future developments are attempted
such as bending FBG, or FBG cladding substituted by the surrounding media, or combining with
piezoelectric materials or using membrane attached on surface or vibration system aroud FBG or
applying tilt FBG etc.
220
APPLYING FIBER BRAGG GRATING FOR ACOUSTIC SENSOR
(a)
(b)
(c)
Fig. 5. Spectrum of transmission for disturbation FBG with various sound intensity levels: (a) 60 dB, (b) 80 dB and (c) 100 dB.
PARADORN PAKDEEVANICH et al.
221
Fig. 6. Bragg wavelength shift (∆λB ) against applied sound intensity level (Isound ).
IV. CONCLUSION
An acoustic sensor based on FBG was designed and demonstrated. Strain due to sound
intensity are able to induce changes in refractive index and the pitch of the grating. The results
revealed that the designed sensor has quite linearity in the Bragg wavelength shift with sound
intensity level. The sensitivity of sensor was 0.0566 nm/dB.
For future work, we purpose to enhance the sensitivity of sensor and apply it to monitor
seismic wave, depth of under water pressure, and ultrasound detection. We suggest to use of
appropriate coating or membrane attached on FBG in order to improve sensitivity and stability of
the sensor.
ACKNOWLEDGMENTS
The present research was supported by grants from Faculty of Science, Silpakorn University, Thailand. The authors would like to thank Dr. Armote Somboonkaew and Thailand’s National
Electronics and Computer Technology Center (NECTEC) for supporting equipment and valuable
technical suggestions.
REFERENCES
[1] M. M. Werneck, C. S. B. Allil, B. A. Ribeiro and F. V. B. De Nazar´e, Current Trends in Short-and Long-Period
Fibre Gratings; InTech: Rijeka, Croatia (2013) 1.
[2] H.-l. Liu, Z.-w. Zhu, Y. Zheng, B. Liu and F. Xiao, Optical Fiber Technology 40 (2018) 144.
[3] C. Li, X. Peng, H. Zhang, C. Wang, S. Fan and S. Cao, Measurement 117 (2018) 252.
[4] M.-f. Liang, X.-q. Fang, G. Wu, G.-z. Xue and H.-w. Li, Optik 145 (2017) 503.
[5] Z. Zhang, C. Shen and L. Li, Optics Communications 411 (2018) 108.