Influence of projection effects on the observed differential rotation rate in the UV corona
Bạn đang xem bản rút gọn của tài liệu. Xem và tải ngay bản đầy đủ của tài liệu tại đây (768.49 KB, 4 trang )
Journal of Advanced Research (2013) 4, 283–286
Cairo University
Journal of Advanced Research
ORIGINAL ARTICLE
Influence of projection effects on the observed
differential rotation rate in the UV corona
Salvatore Mancuso *, Silvio Giordano
INAF–Osservatorio Astrofisico di Torino, via Osservatorio 20, 10025 Pino Torinese (To), Italy
Received 13 April 2012; revised 27 June 2012; accepted 16 August 2012
Available online 27 September 2012
KEYWORDS
Sun: corona;
Rotation;
UV radiation;
Techniques: spectroscopic
Abstract Following previous investigations by Giordano and Mancuso [1] and Mancuso and
Giordano [2,3] on the differential rotation of the solar corona as obtained through the analysis
of the intensity time series of the O VI 1032 A˚ spectral line observed by the UVCS/SOHO telescope
during solar cycle 23, we analysed the possible influence of projection effects of extended coronal
structures on the observed differential rotation rate in the ultraviolet corona. Through a simple geometrical model, we found that, especially at higher latitudes, the differential rotation may be less
rigid than observed, since features at higher latitudes could be actually linked to much lower coronal structures due to projection effects. At solar maximum, the latitudinal rigidity of the UV corona, with respect to the differential rotating photosphere, has thus to be considered as an upper
limit of the possible rigidity. At solar minimum and near the equatorial region throughout the solar
cycle, projection effects are negligible.
ª 2012 Cairo University. Production and hosting by Elsevier B.V. All rights reserved.
Introduction
The coronal rotation rate and its variation as a function of
height and heliographic latitude remains as yet a poorly understood and debated topic. In fact, quantifying the coronal rotation rate critically depends upon both the applied methods of
data reduction and the type of analysed data. The rotation rate
in the solar corona has been studied by means of different
* Corresponding author. Tel.: +39 011 8101955; fax: +39 011
8101930.
E-mail address: (S. Mancuso).
Peer review under responsibility of Cairo University.
Production and hosting by Elsevier
coronal tracers over an extended set of wavelengths, covering
the range from radio to X-rays. In the past few years, the analysis of a full decade of data obtained by telescopes aboard the
Solar and Heliospheric Observatory (SOHO; [4]) spacecraft,
has allowed to study the temporal variation in the coronal
rotation rate for the whole solar cycle 23. In particular, timeseries observations of the coronal O VI 1032 A˚ spectral line
intensity provided by the UltraViolet Coronagraph Spectrometer (UVCS/SOHO; [5]) telescope on board SOHO have been
effectively used to study the differential rotation of the solar
corona during minimum [1] and maximum [2] solar activity
and throughout the whole solar cycle [3]. The work of
Giordano and Mancuso [1] confirmed the already established
result that the corona, during minimum activity, tends to
rotate with a less pronounced differential rotation than the
plasma of the photosphere. The estimated equatorial synodic
rotation period of the corona was $27.5 days. Mancuso and
2090-1232 ª 2012 Cairo University. Production and hosting by Elsevier B.V. All rights reserved.
/>
284
S. Mancuso, S. Giordano
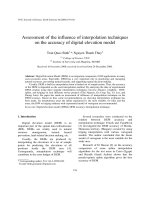
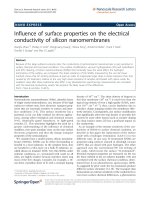
Fig. 1 Upper panel: O VI 1032 intensity synoptic map at 1.5Rx for year 1997 (solar minimum). Lower panel: O VI 1032 intensity
synoptic map at 1.6Rx for year 2000 (solar maximum). Intensities are measured in units of photons cmÀ2 sÀ1 srÀ1. Position angles,
measured counterclockwise (i.e., N–E–S–W–N) from the north pole, increase from top to bottom and cover all latitudes from 0° to 360°.
Giordano [2] in a similar study carried out during a 4-year
period around solar maximum, showed that the coronal rotation differential profile tends to be less rigid, that is, more differential, during enhanced solar activity. In general, during
solar maximum, the coronal magnetic structures were observed to rotate much faster at all latitudes, and less differentially, than the underlying small-scale magnetic structures
linked to the photospheric plasma. A striking significant positive correlation was finally discovered by Mancuso and Giordano [3] between the variations in the residual rotation rates of
the coronal and sub-photospheric equatorial plasma, suggesting that the observed variations in the coronal rotation rate reflect the dynamic changes inferred within the near-surface
shear layer, where the tracer structures responsible for the observed coronal emission are thus most probably anchored.
Projection effects could certainly play a major role in the interpretation of the results presented in the previous works.
In this paper, we analyse the possible influence of projection
effects of extended coronal structures on the observed differential rotation rate in the ultraviolet corona.
Data reduction and analysis
The data analyzed by Giordano and Mancuso [1] and Mancuso and Giordano [2,3] were collected in a time interval from
April 1996 to May 2007 from observations of the coronal O VI
1032 A˚ spectral line, which is routinely observed by the UVCS/
SOHO instrument. UVCS is an internally and externally
occulted coronagraph consisting of two spectrometric channels
for the observation of spectral lines in the UV range and a
visible light channel for polarimetric measurements of the
extended solar corona. The UVCS slit, parallel to a tangent
to the solar limb on the plane of the sky, can be moved along
the radial direction, thus being able to yield raster observations
of the solar corona between 1.4 and 10Rx with a field of view
of 400 . To cover all possible position angles, the slit can be rotated by 360° about an axis pointing to the Sun’s center. For a
complete description of the UVCS instrument, see [5]. The
periodicity analysis was restricted to periods on time scales
near the 27-day solar rotation period and was obtained by
combining results from the east and west hemispheres. Fig. 1
shows an O VI 1032 intensity synoptic map at 1.6Rx in the
time interval from March 1999 to December 2002. The lower
panels show O VI 1032 intensity synoptic maps for each single
year. Indeed, the intensity maps of Fig. 1 show a clear modulation, which can be readily attributed to the rotation of persistent features through several consecutive rotations. Results can
be found in papers [1–3].
Results and discussion
During solar minimum, the global, dipolar-like magnetic field
of the Sun is the dominant factor in determining the structure
of the UV coronal tracers, strictly linked to a longitudinally
modulated streamer belt [6]. However, during the maximum
phase, multipolar components become predominant and active
regions tend to dominate the magnetic flux up to a factor of
three. A major caveat in the analysis proposed in the papers
of Giordano and Mancuso [1] and Mancuso and Giordano
[2,3] is the possibility that different structures along the line
of sight, rooted at different latitudes over the solar surface,
might contribute to the observed periodicity due to projection
effects of lower latitude features that can contaminate the
coronal signal observed at higher latitudes [7]. These projection effects might create an unwanted bias and difficulties in
confirming the exact degree of rigidity in the corona. In other
Influence of projection effects on the observed differential rotation rate
285
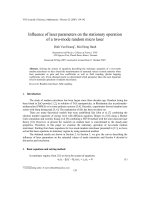
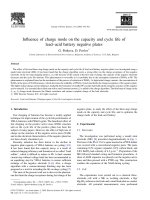
Fig. 2 Plot showing the geometrical model. See the text for
details.
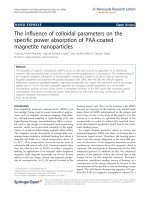
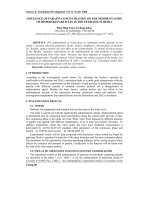
Fig. 4 Expected O VI 1032 intensity profile as a function of the
true latitude, ht, for different apparent latitudes, ha.
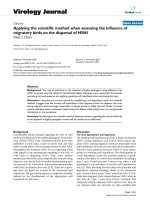
Fig. 3 O VI 1032 intensity distribution at 1.6Rx. The dashed
lines show the minimum and maximum expected intensity. The
minimum intensity is assumed as typical of the background
corona. The maximum intensity, computed as the average
intensity plus 3r, is the expected intensity of a bright streamer
feature.
words, periodicities apparently observed at higher latitudes
might be actually linked to structures from lower latitudes,
so that the overall rotation curves could be flatter than
observed. We tried to quantify this effect and the bias it may
bring to the observed latitude dependence of the coronal
rotation rate at 1.6Rx. In order to qualitatively evaluate the
uncertainty on the latitudinal determination of the position
of a bright feature, which acts as a rotation tracer, we used a
simple geometric model (see Fig. 2) and the empirical determination of the contrast between the tracer and the background
corona. In Fig. 2, we show a feature (P) lying in the plane defined by the line-of-sight (l.o.s) and the solar rotation axis (zdirection), at the true latitude ht and true heliocentric distance
rt. If the brightness of this feature is larger than the background corona, then it can be detected through the integration
of the signal along the l.o.s., appearing at the apparent distance ra and apparent latitude ha = 0°. Collecting all the observed O VI 1032 intensity at 1.6Rx, we determined the
intensity distribution (Fig. 3). The contrast between a bright
feature and the background corona was then defined as the ratio between the average plus 3r intensity and the minimum observed intensity. The so-defined contrast is of about one order
of magnitude. On the other hand, we determined the average
radial profile of the O VI 1032 intensity from a large number
of streamers observed from 1.6Rx to 3.5Rx at solar maximum. We found that the intensity drops out of one order of
Fig. 5 Acceptable range of true latitude as a function of
apparent latitude, in the dark region, a bright feature out of the
plane of the sky can dominate the emission of the background
corona.
magnitude from 1.6Rx to 2.3Rx. Then, with the assumption
that the bright features have a similar profile with height, only
those out of the plane of the sky less than 2.3Rx can dominate
the emission as they are projected into the plane of the sky to
the apparent height of 1.6Rx. For a given apparent latitude on
the plane of the sky, ha, an increasing difference between the
apparent and true latitude, ht, means an increasing distance
from Sun center, thus a decreasing of the expected emission.
In Fig. 4, for different apparent latitudes, we draw the expected intensity as a function of the true latitude. We expect
that when the intensity drops out of one order of magnitude
the contamination of the feature out of the plane of the sky
is negligible. In Fig. 5, we show the acceptable region of the
true latitude as a function of the apparent latitude. In particular, we see that for a tracer observed at about 60° the true latitude ranges from 60° to 68° and for an apparent latitude of
30°, in the worst case, the feature can actually lie at 50°. In this
light, at solar maximum, the latitudinal rigidity of the UV corona, with respect to the differential rotating photosphere, has
to be considered as an upper limit of the observed rigidity. In
fact, the coronal rotation should be more differential if the
286
S. Mancuso, S. Giordano
tracers observed at high latitudes are linked to the lower
acceptable latitudes. Although the difficulty in determining
the true latitude of a tracer is obviously also present at solar
minimum, in that phase of the solar cycle the streamer belt
was well defined and restricted to about 25° in latitude from
the equator where the projection effects are less relevant.
Acknowledgements
Conclusions
References
Following previous investigations by Giordano and Mancuso
[1] and Mancuso and Giordano [2,3] on the differential rotation of the solar corona as obtained through the analysis of
the intensity time series of the O VI 1032 A˚ spectral line
observed by the UVCS/SOHO telescope, we analyzed the possibility that different structures along the line of sight, rooted
at different latitudes over the solar surface, might contribute
to the observed periodicity due to projection effects. Especially
at higher latitudes, the differential rotation may be less rigid
than observed, since features observed at higher latitudes
could be actually linked to much lower coronal structures
due to projection effects. At least during solar maximum
and away from the equatorial region, the latitudinal rigidity
of the UV corona, with respect to the differential rotating
photosphere, has thus to be considered as an upper limit of
the possible rigidity.
[1] Giordano S, Mancuso S. Coronal rotation at solar minimum
from UV observations. Astrophys J 2008;688:656–68.
[2] Mancuso S, Giordano S. Differential rotation of the ultraviolet
corona at solar maximum. Astrophys J 2011;729:79–86.
[3] Mancuso S, Giordano S. Coronal equatorial rotation during
solar cycle 23: radial variation and connections with
helioseismology. Astron Astrophys 2012;539(A26):1–7.
[4] Domingo V, Fleck B, Poland AI. The SOHO mission: an
overview. Solar Phys 1995;162:1–37.
[5] Kohl JL, Esser R, Gardner LD, Habbal S, Daigneau PS, Dennis
EF, et al.. The ultraviolet coronagraph spectrometer for the solar
and heliospheric observatory. Solar Phys 1995;162:313–56.
[6] Mancuso S, Spangler SR. Faraday rotation and models for the
plasma structure of the solar corona. Astrophys J
2000;539:480–91.
[7] Lewis DJ, Simnett GM, Brueckner GE, Howard RA, Lamy PL,
Schwenn R. LASCO observations of the coronal rotation. Solar
Phys 1999;184:297–315.
The authors would like to thank the organizers of IAGA-III
symposium, Dr. A. Hady and Dr. L. Dame´. The authors used
data from the UVCS/SOHO instrument. SOHO is a project of
international cooperation between ESA and NASA.