Sampling the folding transition state ensemble in a tube-like model of protein
Bạn đang xem bản rút gọn của tài liệu. Xem và tải ngay bản đầy đủ của tài liệu tại đây (1.18 MB, 11 trang )
Communications in Physics, Vol. 29, No. 2 (2019), pp. 129-139
DOI:10.15625/0868-3166/29/2/13670
SAMPLING THE FOLDING TRANSITION STATE ENSEMBLE IN A
TUBE-LIKE MODEL OF PROTEIN
NGUYEN BA HUNG1 AND TRINH XUAN HOANG2,3,†
1 Vietnam
2 Institute
Military Medical University, 160 Phung Hung, Ha Dong, Hanoi, Vietnam
of Physics, Vietnam Academy of Science and Technology, 10 Dao Tan, Ba Dinh, Hanoi,
Vietnam
3 Graduate
University of Science and Technology, Vietnam Academy of Science and Technology,
18 Hoang Quoc Viet, Cau Giay, Hanoi, Vietnam
† E-mail:
Received 8 March 2019
Accepted for publication 2 May 2019
Published 15 May 2019
Abstract. We used the tube model with Go-like potential for native contacts to study the folding
transition of a designed three-helix bundle and a designed protein G-like structure. It is shown that
both proteins in this model are two-state folders with a cooperative folding transition coincided
with the collapse transition. We defined the transition states as protein conformations in a small
region around the saddle point on a free energy surface with the energy and the conformational
root mean square deviation (rmsd) from the native state as the coordinates. The transition state
region on the free energy surface then was sampled by using umbrella sampling technique. We
show that the transition state ensemble is broad consisting of different conformations that have
different folded and unfolded elements.
Keywords: free energy landscape, transition state, Monte Carlo simulation.
Classification numbers: 87.15.M-; 87.64.K-.
I. INTRODUCTION
Understanding the nature of the transition state, a half-way conformation supposed to be
at the maximum of a free energy barrier separating the unfolded (denatured) state and the native
state, is crucial for understanding the folding mechanism of two-state proteins. There have been
two different views on the folding process. The old view dated back to the late 1960s suggested
that folding proceeds through one or a few confined pathways so that the Levinthal paradox can be
c 2019 Vietnam Academy of Science and Technology
130
N. B. HUNG AND T. X. HOANG
avoided [1]. The new view, arisen in the early 1990s from the energy landscape theory along with
the concept of a folding funnel [2,3], described the folding process as a progressive rearrangement
of an ensemble of conformations towards lower internal energy and lower conformational entropy.
The new view is thus associated with multiple pathways. In the old view, the transition state
corresponds to one or a few conformations and the free energy barrier leading to the transition
state from the unfolded state would be purely enthalpic. In the new view, the transition states are
an ensemble of conformations and the associated free energy barrier was suggested to be primarily
entropic [4, 5].
Protein engineering method combined with equilibrium and kinetic experiments can provide information about the transition state structure. Such information includes the Φ-values [6],
which reveal the degree of native structure around a mutated residue in the transition state. Φ = 0
means that the residue does not form a native-like structure in the transition state. Φ = 1 means
that the structure around the residue in the transition state is the same as in the native state. Fractional Φ-value however indicates that either the residue forms a partial native-like structure in the
transition state or the transition state ensemble is a mixture of conformations in which full nativelike structures form in different regions among different conformations. Fersht and coworkers
have shown that Chymotrypsin Inhibitor 2 (CI2) has fractional Φ-values and the transition state
has no region forming a full native-like structure [7, 8]. CI2 was suggested to have a single transition state which corresponds to an ensemble of similar structures resembling an expanded version
of the native state. Ubiquitin [9] was reported to have polarized transition state in which some
elements of the native structure are fully formed and some other elements are fully unstructured.
The SH3 domain [10] was shown to have a defined and conformationally restricted transition state
with a β -turn formed even before the formation of the transition state. These experimental results
indicated that proteins fold via multiple pathways, but the pathways are related.
Structure-based Go-like models have been useful for understanding the folding mechanism,
and successful in capturing the folding events [11, 12] and the folding transition state [13, 14] with
significant agreement to experiments. In the present study, we attempt to identify the transition
state for proteins in a different but related model, the tube model with Go-like potentials for the
native contacts, namely the tube Go model. This model inherits both the geometrical constraints
and hydrogen bondings from the tube model and also the native structure selectivity from the Golike model. The tube Go model thus is more realistic than Go-like models. We also introduce
a new quantity f measuring the fraction of native contacts formed by a residue in the transition
state, which is similar to the Φ-value, for the analysis of the transition state structures.
II. METHODS
The tube Go model
We considered the tube model with Go-like potential for native contacts and called it the
tube Go model [15]. The latter is exactly the same as the tube model [16] except that the hydrophobic interaction is replaced by the structure-based Go-like interaction [17]. The model assumes the
polypeptide chain as a chain of Cα atoms representing amino acid residues located along the axis
˚ The tube self-avoidance is enforced by
of a self-avoiding tube of the thickness radius ∆ = 2.5 A.
applying a three-body potential, in such a way that the radius of a circle going through any triplet
of Cα atoms must be larger than ∆ [18]. A bending energy penalty of constant magnitude eR = 0.3
SAMPLING OF THE FOLDING TRANSITION STATE ENSEMBLE IN A TUBE-LIKE MODEL OF PROTEIN
131
along the chain is given to any non-terminal residue, at whose position the chain local curvature
˚ The energetics and geometry of hydrogen bonds are encapsulated
radius is smaller than 3.2 A.
in the model based on a statistical analysis of protein native structures [19]. The local (nonlocal)
hydrogen-bond energies are defined to be −1 (−0.7) with a cooperative energy of −0.3 assigned
to any pair of consecutive hydrogen bonds either in a β -sheet or an α-helix.
A Go-like potential is assigned to non-local contacts between the Cα atoms. In a given
protein conformation, a contact between two atoms is formed if the distance between them is less
˚ Non-local contacts are formed by atoms separated by at least 3 amino acids along the
than 7.5 A.
chain. A negative energy eW is assigned equally to all non-local native contacts, i.e. the contacts
that are present in the protein native state. Non-native contacts are given zero energy.
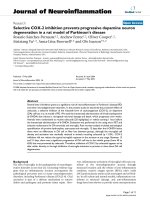
In the present study, we consider two proteins with the native structures shown in Fig. 1.
They are a three-helix bundle denoted as 3HB and a protein G-like structure denoted as GB1.
These structures are the ground states of previously designed proteins in the tube model with
hydrophobic-polar (HP) sequences [20]. Here, these structures are used as input for determining
the native contacts for the Go-like interactions. The energy parameter eW in the Go-like potential
for each protein was chosen such that the total energy of all native contacts in the native state is
equal to the total hydrophobic energy in the tube model with HP sequences. For protein 3HB, we
obtained eW = −0.229, and for GB1, eW = −0.15. Both proteins have the same chain length with
N = 48 amino acids.
(a)
(b)
3HB
GB1
Fig. 1. (a) Structure of a three-helix bundle (3HB). (b) A structure akin to the B1 domain
of protein G (GB1). α-helices are shown in red color whereas β -sheets in yellow color.
Parallel tempering [21] Monte Carlo simulations were carried out with the standard pivot
and crankshaft moves commonly used in stochastic chain dynamics. The Metropolis algorithm
for move acceptance/rejection is used with a thermal weight exp(−E/T ) for each conformation,
where E is the energy of the conformation and T is an effective temperature. We have adopted
dimensionless units for both energy and temperature with the Boltzmann constant kB = 1. The
weighted histogram method [22] was used to calculate the equilibrium properties such as the
132
N. B. HUNG AND T. X. HOANG
average energy, the mean radius of gyration, and the specific heat. The latter is defined as
E2 − E 2
.
(1)
T2
The folding temperature T f is defined as the temperature of the maximum of the specific heat.
The radius of gyration of a protein conformation is defined as
C=
N
Rg =
∑ (ri − rcm )2 ,
(2)
i=1
where ri is the position of residue i and rcm is the position of the center of mass of the protein.
The root mean square deviation (rmsd) of a conformation to the native state is given by
N
rmsd =
min ∑ (ri − r0i )2 ,
(3)
i=1
where r0i is the position of residue i in the native state.
Sampling the transition state ensemble
To determine the transition state of protein we considered a two-dimensional free energy
surface defined as
F(E, rmsd) = −T log P(E, rmsd) ,
(4)
where P(E, rmsd) is the probability of observing a conformation of energy E and a given rmsd to
the native state. The probability P can be determined from equilibrium simulations. The transition state is defined by the saddle point in the free energy surface, presumably with coordinates
(E0 , rmsd0 ). Due to discretization procedure as well as numerical uncertainty, in practice we assumed the transition state to be found anywhere in a small region around the saddle point, i.e.
˚
within (E0 ± 1, rmsd0 ± 0.5), where the rmsd is given in units of A.
Because the transition state is transient during equilibrium simulation, we have employed
umbrella sampling technique [23] to effective sample protein conformations in the transition state
region, with the use of a restraint potential for the energy E
V0 (E) = k0 (E − E0 )2 ,
(5)
where k0 is a constant. We have checked that it is good enough to choose k0 = 0.01. In the
umbrella sampling simulation, the conformations were sampled with the probability weight
w(E) = exp −
E +V0 (E)
T
.
(6)
In order to characterize the transition state, we defined the quantity fi of each residue position i in the protein chain as
k‡ (i)
fi =
,
(7)
kN (i)
where k‡ (i) is the number of native contacts formed by residue i in the transition state (‡) and
kN (i) is the corresponding number in the native state (N). Thus, fi is the fraction of native contacts
SAMPLING OF THE FOLDING TRANSITION STATE ENSEMBLE IN A TUBE-LIKE MODEL OF PROTEIN
133
formed by residue i in the transition state. It receives values between 0 and 1 and plays a role
similar to that of the φ -value considered in protein engineering experiments. The values of k‡ (i)
were calculated from umbrella sampling simulations at T = T f as [23]
k‡ (i) =
∑TSregion k(i)(w(E))−1
,
∑TSregion (w(E))−1
(8)
where k(i) is the number of native contacts of residue i in a conformation and the summation is
taken over all conformations occurred in the transition state region during the simulation. The
weights (w(E))−1 remove the sampling bias provided by the energy and the restraint potential.
III. RESULTS AND DISCUSSION
10
0
(a)
-20
<E>
<E>
0
-40
-60
0.1 0.2 0.3 0.4 0.5 0.6 0.7
(b)
12
3HB
8
0.1 0.2 0.3 0.4 0.5 0.6 0.7
GB1
18
16
(e)
14
12
10
GB1
8
0.1 0.2 0.3 0.4 0.5 0.6 0.7
5000
4000
-30
20
14
10
-20
0.1 0.2 0.3 0.4 0.5 0.6 0.7
<Rg>(Å)
<Rg>(Å)
16
(d)
-40
3HB
18
-10
3000
(c)
3000
(f)
C
C
2000
2000
1000
1000
3HB
GB1
0
0.1 0.2 0.3 0.4 0.5 0.6 0.7
0
0.1 0.2 0.3 0.4 0.5 0.6 0.7
T
T
Fig. 2. Temperature dependence of the average energy (a,d), the mean radius of gyration (b,e) and the specific heat (c,f) for protein 3HB (left panels) and protein GB1 (right
panels) in the tube Go model.
Figure 2 shows the temperature dependences of the average energy E , the mean radius of
gyration Rg , and the specific heat for protein 3HB and protein GB1. Both the average energy and
the mean radius of gyration show a sharp change near a temperature, at which the specific heat C
has a very strong and narrow peak. All these behaviors indicate a cooperative folding transition.
In a cooperative folding, all parts of the protein fold almost simultaneously without intermediates
134
N. B. HUNG AND T. X. HOANG
leading to sharp changes of energy and other properties of the molecule at the transition temperature. Our results here also show that the collapse transition, associated with the change in Rg ,
happens almost at the same temperature as the folding transition. The folding temperature T f ,
corresponding to the temperature of the maximum of specific heat, was found to be equal to 0.34
for 3HB and 0.297 for GB1.
Figures 3 and 4 show the time dependences of the energy, the rmsd and the radius of gyration Rg in a long simulation at the folding temperature T f for two proteins 3HB and GB1, respectively. For both proteins, the simulations show multiple switching between conformations of high
and low values of the considered quantities, suggesting that the proteins in our model are two-state
folders. The conformations of low energy, low rmsd, and low Rg correspond to the folded state
whereas those of high energy, high rmsd, and high Rg correspond to the unfolded state. The histograms of energy, rmsd and Rg shown on the right panels of Figs. 3 and 4 also indicate two peaks
corresponding to these two states. The separation of the peaks however is more clearly for energy
and rmsd than for Rg , suggesting that energy and rmsd better coordinates for folding than Rg .
0
(a)
(d)
5000
10000
15000
MCsteps(x105)
0
0.02 0.04
normalizedhistogram
(b)
(e)
5000
10000
15000
MCsteps(x105)
0
0.03 0.06
normalizedhistogram
(c)
(f)
5000
10000
15000
MCsteps(x105)
0
0.1
0.2
normalizedhistogram
E
-20
-40
-60
rmsd(Å)
0
20
16
12
8
4
0
0
Rg(Å)
24
20
16
12
8
0
Fig. 3. Time dependence of the energy E (a), the root mean square deviation rmsd
(b) and the radius of gyration Rg (c) in a long trajectory for protein 3HB at its folding
temperature T f = 0.34. Time is given in Monte Carlo steps. Right panels show histograms
of the quantities considered in the left panels.
SAMPLING OF THE FOLDING TRANSITION STATE ENSEMBLE IN A TUBE-LIKE MODEL OF PROTEIN
E
0
(a)
(d)
5000
10000
15000
MCsteps(x105)
0
0.03 0.06
normalizedhistogram
(b)
(e)
5000
10000
15000
MCsteps(x105)
0
0.03 0.06
normalizedhistogram
(c)
(f)
5000
10000
15000
5
MCsteps(x10 )
0 0.05 0.1 0.15
normalizedhistogram
135
-20
-40
0
rmsd(Å)
25
20
15
10
5
0
0
28
Rg(Å)
24
20
16
12
8
0
Fig. 4. Same as Fig. 3 but for protein GB1 at its folding temperature T f = 0.297.
Figure 5 shows the dependence of the free energy on the number of native contacts for the
two proteins 3HB and GB1 at their folding temperature T f . For both proteins, the free energy has
two minima corresponding to the unfolded state and the folded state separated by a barrier. The
folding and unfolding free energy barriers are found to be in the range from 0.6 to 1 in units of
local hydrogen bond energy, or equivalently 3–5 kB T . These low free energy barriers indicate that
the modeled proteins are fast folders.
Figure 6 shows contour plots of the free energy surface F(E, rmsd) along the two coordinates E and rmsd for protein 3HB and protein GB1. The free energy was obtained from long
simulations at T = T f . For both proteins, the free energy surface has two minima, one corresponds
to the folded state at low E and low rmsd and the other one corresponds to the unfolded state at
high E and high rmsd. There is a saddle point between the two minima supposed to be the position
of the transition state on the free energy surface. The coordinates (E0 , rmsd0 ) of the saddle point
˚ and (−18, 8 A)
˚ for
on the surface can be approximately read from the contour plots as (−23, 6 A)
3HB and GB1, respectively.
136
N. B. HUNG AND T. X. HOANG
2.5
3HB
GB1
freeenergy
2
1.5
1
0.5
0
20
40
60
80 100 120 140 160 180
numberofnativecontacts
Fig. 5. Dependence of the free energy on the number of native contacts for 3HB (solid)
and GB1 (dashed) at their folding temperatures T f . The free energy was obtained as
F(Q) = −T log P(Q), where P(Q) is the probability of observing conformations of the
number of native contacts Q in equilibrium simulations.
Tube Go model: 3HB
14
16
4.5
Tube Go model: GB1
4
14
12
12
4
3.5
10
3.5
8
+
6
3
4
+
8
3
6
2.5
4
2
0
-70
Rmsd
Rmsd
10
2.5
-60
-50
-40
E
-30
(a)
-20
-10
0
2
0
2
-50
-40
-30
E
-20
-10
0
(b)
Fig. 6. Contour plots of the free energy as function of the energy E and the rmsd for
protein 3HB (a) and protein GB1 (b) at their folding temperatures T f . The approximate
position of the transition state at the saddle point is indicated by the cross.
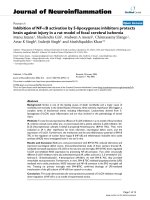
We have carried out umbrella sampling simulations to sample protein conformations in
the transition state region as described in the Methods section. With a run of 4 × 10⁹ MC steps
and the sampling frequency of one conformation every 104 steps we were able to obtain about
1000 conformations in the transition state region. Figure 6 shows the values of fi obtained for
all amino acid positions in the two proteins and some examples of transition state conformations
found near the saddle points. For protein 3HB, fi varies mainly between 0.2 and 0.5 with some
SAMPLING OF THE FOLDING TRANSITION STATE ENSEMBLE IN A TUBE-LIKE MODEL OF PROTEIN
137
values slightly larger than 0.5 for a few positions around the middle of the protein sequence. This
profile of fi indicates that all the positions in the sequence of the 3HB protein mildly contribute to
the formation of the transition state though not equally. The values of fi found to be substantially
less than 1 indicate that the transition state ensemble includes a variety of different conformations
of different sets of native contacts. In other words, one can say that the transition state is broad. In
consistency with the calculated fi values, the transition state conformations shown in the bottom
of Fig. 7a are very different from each other thought they have almost the same energy and the
same rmsd with respect to the native state. One can notice that the transition state may have one or
two pieces of the α-helices formed and the rest of the conformation disordered. We have checked
that β -sheets typically are not present in the transition state ensemble of 3HB. However, in less
than 8% of the snapshots in the TS ensemble, some small amount of β structure (4-8 residues) can
be observed.
E = -23.259
rmsd = 5.990 Å
E = -23.001
rmsd = 5.989 Å
(a)
E = -23.033
rmsd = 6.042 Å
E = -18.0
rmsd = 8.033 Å
E = -18.0
rmsd = 7.945 Å
E = -18.0
rmsd = 8.065 Å
(b)
Fig. 7. (a) (Top) Dependence of the quantity fi on the residue number i for protein 3HB.
(Bottom) Examples of transition state conformations for protein 3HB with the corresponding values of energy and rmsd as indicated. (b) Same as (a) but for protein GB1.
Secondary structures formed in the transition state are shown in colors.
The fi profile for protein GB1 shows stronger variation than for 3HB, with the values range
mostly from 0.3 to 0.7. At position i = 10, the value fi = 0 is shown because the residue number
10 has no native contacts. Some values of fi for GB1 are somewhat higher than those of 3HB,
but the conclusions about the transition state are similar for the two cases. For GB1, the transition
state is also broad with a large variety of conformations. The examples of conformations shown
in Fig. 7b indicate that the transition state may arise with the formation of a portion of the β -sheet
or a piece of the α-helix, whereas the rest of the conformation is largely disordered.
There has been a rich body of theoretical studies on the folding mechanism of proteins with
native state topologies similar to those considered in our study. The 46-residue three-helix bundle
138
N. B. HUNG AND T. X. HOANG
of the B domain of staphylococcal protein A was studied by Zhou and Karplus [24,25] in a Go-like
model. They showed that thermodynamically this protein has multiple transitions between various
phases of different degrees of ordering, while kinetically it may have on-pathway and off-pathway
intermediates. A folding intermediate of this three-helix bundle domain was also found in a free
energy calculation by Boczko and Brooks [26] and in a kinetic study by Yang et al. [27] via allatom simulations. Shimada and Shakhnovich [28] studied the folding of the 57-residue B1 domain
of protein G in an all-atom model with Go-like potential and showed that this protein has an onpathway intermediate. A more recent study of Kmiecik and Kolinski [29] using a coarse-grained
model with statistical potential also indicated that protein G folds via three-state mechanism with
a molten globule intermediate. In contrast to the above theoretical studies, our tube Go model
shows two-state behavior with a single sharp transition between the unfolded phase and the folded
phase for both the 3HB and the GB1 proteins.
Experimentally, protein A was shown to have rapid two-state kinetics with no evidence
of intermediates [30–32], whereas whether protein G is a two-state or three-state folder is under
debate [33, 34]. The behaviors of 3HB and GB1 thus are partially in agreement with experiment.
The experiments also reported high Φ-values (≈ 0.8–1) for some residues in the helix 1 and helix
2 of protein A [31] and in the second β -turn of protein G [34]. Our f values obtained for 3HB
and GB1 do not reflect these experimental results. Note that the native structures of 3HB and GB1
are designed structures taken from previous study of the tube model and thus to some extents are
different from real structures of protein A and protein G. The designed proteins and real proteins
are also different in chain length. Thus, our study only serves as a general consideration of twostate proteins but not for a detailed comparison with experiment for specific proteins.
IV. CONCLUSION
Our study comes with two main findings. The first finding is that the tube Go model yields
cooperative two-state folding characteristic similar to that of small globular proteins. This characteristic arises from both the geometrical and energetic components of the tube model, which are
associated with basic properties of a polypeptide chain, and the native-centric potentials of the Go
model accounting for the effect of the amino acid sequence. The tube model yields a presculpted
free energy landscape [16] with few energy minima while the Go-like potential provides the selectivity of the native state as the global minimum. As a more realistic feature than standard Go-like
models, the tube Go model can form non-native hydrogen bonds which compete with native interactions. Our results show that this competition does not destroy the two-state folding behavior.
The second finding is that the transition state ensemble of protein is broad consisting of largely different conformations, which indicates that proteins fold through multiple independent or weakly
related parallel pathways. This scenario is fully consistent with the new view of protein folding,
while experiments seem to indicate more strongly related pathways. Further investigations are
needed to understand this gap between theory and experiment.
ACKNOWLEDGMENTS
This research is funded by Vietnam National Foundation for Science and Technology Development (NAFOSTED) under grant number 103.01-2016.61.
SAMPLING OF THE FOLDING TRANSITION STATE ENSEMBLE IN A TUBE-LIKE MODEL OF PROTEIN
139
REFERENCES
[1]
[2]
[3]
[4]
[5]
[6]
[7]
[8]
[9]
[10]
[11]
[12]
[13]
[14]
[15]
[16]
[17]
[18]
[19]
[20]
[21]
[22]
[23]
[24]
[25]
[26]
[27]
[28]
[29]
[30]
[31]
[32]
[33]
[34]
C. Levinthal, J. Chim. Phys. 65 (1968) 44.
P. E. Leopold, M. Montal and J. N. Onuchic, Proc. Natl. Acad. Sci. USA 89 (1992) 8721.
P. G. Wolynes, J. N. Onuchic and D. Thirumalai, Science 267 (1995) 1619.
ˇ
A. Sali,
E. Shakhnovich and M. Karplus, J. Mol. Biol. 235 (1994) 1614.
J. N. Onuchic, N. D. Socci, Z. Luthey-Schulten and P. G. Wolynes, Fold. Des. 1 (1996) 441.
A. R. Fersht, A. Matouschek and L. Serrano, J. Mol. Biol. 224 (1992) 771.
D. E. Otzen, L. S. Itzhaki, S. Jackson and A. Fersht, Proc. Natl. Acad. Sci. USA 91 (1994) 10422.
A. R. Fersht, L. S. Itzhaki, J. Matthews and D. Otzen, Proc. Natl. Acad. Sci. USA 91 (1994) 10426.
H. M. Went and S. E. Jackson, Prot. Eng. Des. Sel. 18 (2005) 229.
J. C. Martinez, M. T. Pisabarro and L. Serrano, Nat. Struct. Mol. Biol. 5 (1998) 721.
T. X. Hoang and M. Cieplak, J. Chem. Phys. 112 (2000) 6851.
T. X. Hoang and M. Cieplak, J. Chem. Phys. 113 (2000) 8319.
C. Clementi, H. Nymeyer and J. N. Onuchic, J. Mol. Biol. 298 (2000) 937.
C. Clementi, A. E. Garcıa and J. N. Onuchic, J. Mol. Biol. 326 (2003) 933.
N. B. Hung and T. X. Hoang, Comm. Phys. 23 (2013) 313.
T. X. Hoang, A. Trovato, F. Seno, J. R. Banavar and A. Maritan, Proc. Natl. Acad. Sci. USA 101 (2004) 7960 .
N. Go, Ann. Rev. Biophys. Bioeng. 12 (1983) 183 .
A. Maritan, C. Micheletti, A. Trovato and J. R. Banavar, Nature (London) 406 (2000) 287 .
J. R. Banavar, T. X. Hoang, A. Maritan, F. Seno and A. Trovato, Phys. Rev. E 70 (2004) 041905.
T. X. Hoang, L. Marsella, A. Trovato, F. Seno, J. R. Banavar and A. Maritan, Proc. Natl. Acad. Sci. USA 103
(2006) 6883 .
R. H. Swendsen and J.-S. Wang, Phys. Rev. Lett. 57 (1986) 2607.
A. M. Ferrenberg and R. H. Swendsen, Phys. Rev. Lett. 63 (1989) 1195.
G. M. Torrie and J. P. Valleau, J. Comp. Phys. 23 (1977) 187.
Y. Zhou and M. Karplus, Proc. Natl. Acad. Sci. USA 94 (1997) 14429.
Y. Zhou and M. Karplus, Nature 401 (1999) 400.
E. M. Boczko and C. L. Brooks, Science 269 (1995) 393.
J. S. Yang, S. Wallin and E. I. Shakhnovich, Proc. Natl. Acad. Sci. USA 105 (2008) 895.
J. Shimada and E. I. Shakhnovich, Proc. Natl. Acad. Sci. USA 99 (2002) 11175.
S. Kmiecik and A. Kolinski, Biophys. J. 94 (2008) 726.
J. K. Myers and T. G. Oas, Nat. Struct. Mol. Biol. 8 (2001) 552.
S. Sato, T. L. Religa, V. Daggett and A. R. Fersht, Proc. Natl. Acad. Sci. USA 101 (2004) 6952.
S. Sato, T. L. Religa and A. R. Fersht, J. Mol. Biol. 360 (2006) 850.
S.-H. Park, M. R. Shastry and H. Roder, Nat. Struct. Mol. Biol. 6 (1999) 943.
E. L. McCallister, E. Alm and D. Baker, Nat. Struct. Mol. Biol. 7 (2000) 669.