El-Salam canal is a potential project reusing the Nile Delta drainage water for Sinai desert agriculture: Microbial and chemical water quality
Bạn đang xem bản rút gọn của tài liệu. Xem và tải ngay bản đầy đủ của tài liệu tại đây (1.38 MB, 10 trang )
Journal of Advanced Research (2012) 3, 99–108
Cairo University
Journal of Advanced Research
ORIGINAL ARTICLE
El-Salam canal is a potential project reusing the Nile Delta
drainage water for Sinai desert agriculture: Microbial
and chemical water quality
Amal A. Othman a, Saleh A. Rabeh a, Mohamed Fayez b, Mohamed Monib b,
Nabil A. Hegazi b,*
a
b
National Institute of Oceanography and Fisheries, El-Qanater Research Station, Egypt
Faculty of Agriculture, Cairo University, Giza, Egypt
Received 12 December 2010; revised 24 February 2011; accepted 4 April 2011
Available online 4 November 2011
KEYWORDS
El-Salam canal;
North Sinai;
Drainage water;
Reuse of Nile water;
Water pollution;
Diazotrophs
Abstract More than 12 · 109 m3/year of Nile Delta drainage water is annually discharged into the
Mediterranean Sea. El-Salam (peace) canal, having a mixture of such drainage water and the Nile
water (1:1 ratio), crosses the Suez canal eastward to the deserts of north Sinai. The suitability of the
canal water for agriculture is reported here. Representative samples were obtained during two successive years to follow effects of seasonal and spatial distribution, along the first 55 km course in
north Sinai, on the water load of total bacteria, bacterial indicators of pollution, and chemical
and heavy metals contents. In general, the canal water is acceptable for irrigation, with much concern directed towards the chemical contents of total salts (EC), Na and K, as well as the trace elements Cd and Fe. Extending the canal course further than 30 km significantly lowered the fecal
pollution rate to the permissible levels of drinking water. Results strongly emphasize the need for
effective pre-treatment of the used drainage water resources prior mixing with the Nile water.
ª 2011 Cairo University. Production and hosting by Elsevier B.V. All rights reserved.
Introduction
* Corresponding author. Tel./fax: +20 2 3 5728 483.
E-mail address: (N.A. Hegazi).
2090-1232 ª 2011 Cairo University. Production and hosting by
Elsevier B.V. All rights reserved.
Peer review under responsibility of Cairo University.
doi:10.1016/j.jare.2011.04.003
Production and hosting by Elsevier
Sinai peninsula is a unique environment. Over the years, it has
been subjected to flora [1–5] and microflora [6,7] investigations. With a rainfall of <100 mm a year, the major limitations for agricultural development is the available water
resources. Therefore, the need arises to secure additional resources, e.g. the reuse of agriculture drainage water. At present, more than 12 · 109 m3/year of such water is annually
discharged into the Mediterranean sea [8]. In this respect, ElSalam (peace) canal is considered as a unique project brings
the Nile water to the eastern deserts of north Sinai; originating
from the River Nile at 210 km on Damietta branch and
100
running south east ca. 89.4 km. Then, it crosses the Suez canal
through a siphon to the peninsula extending 175 km eastward
in north Sinai. It is planned to deliver 4.45 · 109 m3 water, provided by the river Nile (2.11 · 109) mixed (ca. 1:1, v/v) with
2.34 · 109 m3 from drainage water (El-Serw and Hadous
drains) [9,10]. The canal is planned to provide water for the
cultivation of ca. 150,000 hectares in north Sinai out of the
total targeted ca. 248,000 hectares. Water is to be checked
and analyzed periodically during years of plantation to monitor and readjust the ratio of mixing in the light of changes in
soil and waters. So far, in situ and laboratory studies concentrated on the western part of the canal before crossing the Suez
canal. The water quality has been checked, chemically not
microbiologically, along El-Serw and Hadous drains since
1997 as well as the western course prior the Suez canal siphon
[8,10–12].
Since 1992, joint governmental and international development agencies did cooperate to report on the environmental
impact assessment of the canal project [13]. Among the major
positive impacts of the canal project are reclaiming desert
soils and development of new agro-ecological habitats,
improving socio-economic conditions for native and introduced settlers, and fixation of moving sand dunes. However,
the expected negative impacts include upsetting and increasing pressure on the natural ecosystems, build up of soil salinity leading to soil degradation, and increased seepage of
contaminated groundwater into aquifers and Lake Bardawil.
Taking into considerations such impacts, our group have already conducted research to document the diversity of flora
and associated microflora in plant–soil ecosystems of the major targeted area of the canal in north Sinai [6,7,14]. The
present study is primarily reporting on the water quality of
the canal water and its impact on the environment of north
Sinai. The suitability of water for agriculture in principle,
and for drinking if possible, was investigated taking into consideration spatial distribution along the first 55 km and sea-
A.A. Othman et al.
sonal variations during two successive years (2003/2004 and
2004/2005).
Material and methods
Experimental sites
El Salam canal originates from Damietta city where water
from River Nile (Damietta branch), Bahr Hadous Drain and
El Serw Drain are mixed together by the ratio 1:1. The canal
brings the water from the west of Suez canal to the east. Under
the Suez canal, a siphon of four tunnels (750 m long and 5.1 m
Ø) brings the already mixed water from west to east. Water
samples were collected from the mouth of the siphon (0 km)
and five further eastward sites up to 55 km, in north Sinai
(Fig. 1).
Sampling and in situ measurements
Representative water samples were manually collected during
the seasons winter, spring, summer, and autumn of two successive years (2003/2004 and 2004/2005). For microbiological
analysis, surface water (ca. <1 m ashore) samples were aseptically collected in sterile brown bottles (500 ml capacity), transported to laboratory, and stored at 4 °C until bacteriological
analysis completed within 48 h of sampling. Additionally, glass
stopped oxygen sampling bottles (300 ml), for dissolved oxygen as well as biochemical oxygen demand determinations,
were filled carefully with water samples and fixed immediately
on the spots by adding 2 ml MnSO4 followed by 2 ml alkaline
KI [15]. For trace elements analysis, water samples were further collected in 1 l plastic bottles, and preserved with 5 ml
concentrated nitric acid on the spot and stored in refrigerator
[15]. One-liter plastic bottles were also filled with water samples for undertaking the rest of chemical analysis.
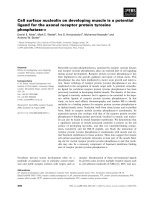
Fig. 1 El-Salam canal course in north Sinai. (A) A satellite image for the canal beginning of the El-Salam siphon under Suez canal. (B)
Outline map of El-Salam canal development project, showing the course of the canal and the five (I, II, III, IV, V) future targeted
cultivated areas beginning of South El-Qantara eastward to El-Arish 90. (C) The sampling six sites of the canal, 0, 11, 22, 33, 44, 55 km
away of the siphon, with the following respective GPS data, N: 31°010 17100 , E: 32°180 88900 ; N: 31°010 27200 , E: 32°250 76500 ; N: 31°010 44600 , E:
32°320 7200 ; N: 31°000 28300 , E: 32°390 11100 ; N: 30°560 11700 , E: 32°430 43700 ; N: 30°580 71900 ; E: 32°480 89300 .
El-Salam canal for reusing the Nile Delta drainage water
101
Analyses
Eosin methylene blue agar Levin’s medium [15]
In situ measurements
Contains (g lÀ1): peptone, 10.0; lactose, 10.0; K2HPO4, 2.0; eosin Y, 0.4; methylene blue, 0.065; agar, 15; pH, 7.2.
Temperature of surface water and air, pH, EC were determined in situ according to the Standard Methods of American
Public Health Association [15], using a pH and EC meter (Jenway 4330).
Laboratory measurements
Bacteriological analyses
(a) The pour plate technique [16] and the plate count agar [15]
were used for the enumeration of total culturable bacteria at
both 22 and 37 °C incubation temperatures. Total spore-forming bacteria, after pasteurization of selected sample dilutions
for 15 min at 80 °C, were counted by the incubation of pour
plates prepared at 30 °C.
(b) Total and spore-forming diazotrophs were counted using
the surface inoculated plate method and N-deficient combined
carbon sources agar medium, CCM [17]. Three agar plates were
inoculated from each suitable dilution and incubation took
place at 30 °C for 72 h. Representative colonies were transferred
to semi-solid CCM, and measured for acetylene reduction [18].
Isolates producing >5 nmol C2H4 cultureÀ1 hÀ1 were secured
for further identification based on API 20 E (Enterobacteriacea)
and 20 NE (Non-Enterobacteriaceae) profiles [6].
(c) Total and fecal coliforms were enumerated in MacConkey broth medium [15]. For presumptive test, three sets of
tubes were prepared: five tubes each containing 10 ml of double strength broth [15] were inoculated with 10 ml water sample, five tubes containing 5 ml of single strength broth were
inoculated with 1 ml of water, and the remaining five tubes
containing 5 ml of broth were inoculated with 0.1 ml of water
samples. After incubation at 37 °C, the MacConkey broth
tubes were observed for gas production, and presumptive coliform numbers were estimated using the MPN index. For confirmations, sub-cultures from positive tubes were incubated in
a water bath at 45.5 °C for 24–48 h, again observed for gas
production, and the number of positive tubes used to calculate
the MPN. Completed test using eosin methylene blue (EMB)
agar was performed and plates were incubated at 44.5 °C for
24–48 h; metallic shine or pink with dark center colonies on
EMB agar indicated positive results.
The recommended method [15] for detection and counting
fecal streptococci in waters were applied. Azide dextrose broth
medium [15] in tubes was inoculated with the suitable serial
decimal dilutions of water samples, incubated at 37 °C for
48 h. A confirmation test was made by transferring three loops
from the turbid positive tubes to ethyl violet azide broth and
incubated at 37 °C for 72 h. Positive tubes were those having
a slight turbidity accompanied with purple bottom.
Media
Plate count agar [15]
Contains (g lÀ1): tryptone, 5.0; glucose, 1.0; yeast extract, 2.5;
agar, 15; pH, 7.2.
MacConkey broth [15]
Comprises (g lÀ1): peptone, 20.0; NaCl, 5.0; lactose, 5.0; sodium taurocholate, 5.0; bromocresole purple, 0.01; pH, 7.2.
Azide dextrose broth [15]
Contains (g lÀ1): peptone, 15.0; beef extract, 4.5; NaCl, 7.5; sodium azide, 0.25; pH, 7.2.
N-deficient combined carbon sources medium, CCM [17]
Comprises (g lÀ1): glucose, 2.0; malic acid, 2.0; mannitol, 2.0;
sucrose, 1.0; K2HPO4, 0.4; KH2PO4, 0.6; MgSO4, 0.2; NaCl,
0.1; MnSO4, 0.01; yeast extract, 0.2; fermentol (a local product
of corn-steep liquor), 0.2; KOH, 1.5; CaCl2, 0.02; FeCl3, 0.015;
Na2MoO4, 0.002, ZnSO4, 0.00025; CuSO4, 0.00008; sodium
lactate (60%, v/v) 0.6 mlÀ1; pH, 7.0. Filter-sterilized solutions
of biotin (0.5 lg lÀ1) and para-amino benzoic acid (10 lg lÀ1)
were added after sterilization.
Chemical analyses
Dissolved oxygen was measured using the modified Winkler
method [15], and biochemical oxygen demand (BOD) was
determined with the 5-days incubation method [15]. Chemical
oxygen demand (COD) was carried out using potassium permanganate method [19]. Colorimetric methods were used to
determine ammonia using phenate method [15], nitrite [15],
and nitrate [20].
Sodium and potassium were measured using flame emission
photometric method [15]. Calcium was determined in water
samples using EDTA titrimetric method [15]. Magnesium
and heavy metals (cadmium, copper, iron and zinc) were determined using atomic absorption spectrometry (Perkin-Elmer
2380) after using the digestion technique by nitric acid [15].
Statistical analysis
Data were statistically analyzed using analysis of variance
(ANOVA) [21] and the MSTAT computer program. The correlation coefficients and linear regressions among the different
parameters were computed as well.
Results
Microbiological analyses
Microbial analyses included total bacterial counts developed
on either 22 or 37 °C, total diazotrophs as well as spore forming bacteria and diazotrophs. ANOVA analysis indicated significant differences attributed to the years, the seasons and
the sites (Fig. 2a and b). Among the years, 2003/2004 recorded
the highest populations of the majority of bacterial groups.
The seasonal effects are pronounced as well. Total bacteria
developed on 22 °C were particularly higher in winter
(>103–104 cfu mlÀ1) compared to other seasons. On the other
hand, the mesophilic groups, including total bacteria developed on 37 °C, total diazotrophs and spore formers, were significantly the highest in spring (>70–103 cfu mlÀ1).
Fluctuations in the populations of bacterial groups along
the course of the canal are presented in Fig. 2a and e. Populations decreased with the increase of canal course and percentage decreases were calculated (Fig. 2c). Compared to the zero
102
A.A. Othman et al.
a
C
d
b
e
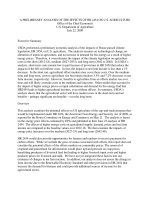
Fig. 2 Spatial changes in microbial populations (log no./l) along the course of El-Salam canal during the two successive years (n = 8
seasons). (a) Population changes in various bacterial groups by distance; (b) one-way ANOVA analysis; (c) percentage decreases in
bacterial load by distance; (d) correlation matrix; (e) cumulative total bacterial load by distance; means followed by the same letter are not
significantly different (p < 0.05).
point at the juncture (crossing point) of Suez canal, percentage
decreases ranged from <5% to 84%. Less than 5% decreases
were reported along the first 22 km, and increased to 24–45%
further to the end of the tested sites (44 km). As to spore formers, corresponding decreases were higher, 24–27% and 46–
84%. The behavior of various microbial groups was alike, that
was confirmed by positive correlations reported (Fig. 2d).
Interactions between bacterial groups and physico-chemical
parameters were computed and reported to be positive with
temperature and negative with pH and EC.
Differential temperature ratio test, relating total bacterial
counts on 22 °C to those on 37 °C, was applied and figures obtained did range from 0.21 to 6.25. Compared to the permissible stander of 10:1, this indicates the heavy pollution of the
canal waters. Further pollution parameters indicated the presence of total and fecal coliforms as well as fecal streptococci
El-Salam canal for reusing the Nile Delta drainage water
103
a
b
c
d
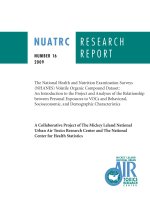
Fig. 3 Spatial changes in the populations of bacterial indicators of pollution along the course of the canal. (a) Population changes in
bacterial indicators of pollution (MPN/100 ml); (b) percentage decreases in bacterial load by distance; (c) correlation matrix; (d)
cumulative total bacterial load by distance.
(Fig. 3a). Irrespective of the seasons and sites, the indicators of
pollution did present with population ranged from >0 to 550,
>0 to 70, and >0 to 550 MPN/100 ml of total coliforms, fecal
coliforms, and fecal streptococci respectively. This is an indication of the suitability of the water for irrigation not for drinking. Further than 30 km, fecal coliforms were almost absent
allowing the potability of the canal water (Fig. 3b and d).
The ratio between fecal coliforms and fecal streptococci ranged
from 0 to 1.43 indicating the non-human sources of pollution.
The associative nitrogen-fixing bacteria (diazotrophs) were
present in appreciable numbers in the canal water (Fig. 2).
Their populations represented >66% of the total bacterial
population, a clear demonstration to the terrestrial supplement
to the canal through agricultural drainage waters. Representative isolates of diazotrophs were single-colony purified and
tested for their acetylene reducing activities. Potential isolates,
having >5 nmol C2H4 cultureÀ1 hÀ1, were identified by API
profiles (data not shown), being Gram negative representatives
of Chryseomonas meningospt, Chrysemonas luteola (Pseudomonos luteola), Klebsiella pneumoniae, Ochrobactrum anthropi,
Pantoea spp. (Enterobacter agglomerans), Pasteurella pneumotropica, and Azospirillum spp.
Chemical analyses
Dissolved oxygen did increase with the increase in canal distance. The turbulence and agitation of water by three pumping
stations built in during the tested course of the canal may be an
explanation. This pumping activates did interfere with BOD
and COD (data not shown). Determinations showed increasing, not decreasing, values with the extending of the canal
course.
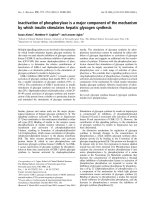
Statistical analysis indicated significant differences in the
available forms of N, attributed to years, seasons and sites
(Fig. 4c). The highest concentrations were for nitrates (0.01–
5.47 mg lÀ1) followed by ammonia (0.07–1.49 mg lÀ1) and nitrites (0.05–0.93 mg lÀ1). Significantly, the lowest estimates
were reported for the year 2004, and the season summer
(Fig. 4c). Successive decreases were reported with the increase
of the canal course, reaching the lowest records by the terminal
site (Figs 4a and b).
Cations present in the canal water are presented in Fig. 5.
Their concentrations did follow the descending order of Na+
(75–294 mg lÀ1) followed by Mg2+ and K+ (5.0–28.0 mg lÀ1)
then Ca2+ (0.3–2.7 mg lÀ1). Among seasons, the highest
104
A.A. Othman et al.
a
b
Fig. 4 (a) Spatial changes in NH3, NO2, and NO3 determinations (mg/l) along the course of El-Salam canal; (b) cumulative load of
nitrogen forms; (c) one-way ANOVA analysis. Means followed by the same letter are not significantly different (p < 0.05).
concentrations of all cations were found in the autumn (data
not shown). Interestingly enough is the successive increase in
concentrations of cations except Ca2+ with the further extending of the canal, especially for Na+ (Fig. 5).
The sodium adsorption ratio (SAR), as one of the parameters used for water suitability for irrigation, ranged from 5 to
18 meq lÀ1. The ratio increased by the extending of the canal
course, being highest at the canal terminal. This makes the canal water complies with the permissible levels of this ratio,
being 0–15 meq lÀ1 (data not shown).
As to the heavy metals (Fig. 6), the highest concentrations
were reported for Fe (2.24–9.97 mg lÀ1) followed by Zn (0.12–
0.21 mg lÀ1); the lowest were for both Cu and Cd (0.05–
0.12 mg lÀ1). Statistical analyses indicated significant differences attributed to fluctuations in seasons and site distances.
Fe in particular significantly decreased with distance, scoring
the least records further than 33 km.
Discussion
The quality of El-Salam canal water should be addressed to
help monitoring and mitigating the negative impacts of the reused drainage water of the canal on the surrounding environment of north Sinai. So far, most of the follow up studies were
carried out on the western part of the canal before crossing the
Suez canal to north Sinai [5,8,10–12]. Therefore, the present
study does complete the picture and focus on the eastern part
extending in north Sinai.
El-Degwi [8] focused on the BOD parameter as a good measure for the organic load in the canal water, depending on water
quality data during 1998–2001, along the first 89.4 km of the
western part of the canal. They reported that BOD of El-Serw
drain (21–51 mg lÀ1) and Hadous drain (30–136 mg lÀ1) upon
mixing with the Nile water (6–34 mg lÀ1) did elevate the BOD
values of the mixed water to 24–44 mg lÀ1 before crossing the
siphon under the Suez canal to north Sinai. Our results on
the eastern 55 km extension of the canal showed an average
of 0.01–9.88 mg lÀ1. This agrees with the conclusions of ElDegwi et al. [8] that BOD values along El-Salam canal do comply with Egyptian environmental regulations (40 mg lÀ1 set by
the governmental Law of 48/1982). International permissible
limits for the use of water in irrigation are in the average of
10 mg lÀ1 [22] to 40 mg lÀ1 [23], and 2 mg lÀ1 for non-polluted
rivers [24]. Statistical analysis of the data obtained in this study
indicated significant differences attributed to seasons, summer
and autumn being higher (3.2–4.0 mg lÀ1) compared to spring
and winter (0.7–2.4 mg lÀ1). Fluctuations in BOD values monitored in the River Nile environment are often reported (3.7–
50.2 mg lÀ1), being affected by quantity and quality of discharges, as well as seasonal and spatial effects [25].
El-Salam canal for reusing the Nile Delta drainage water
105
Fig. 5 Spatial changes in contents of cations (NaÀ, K+, Ca2+, Mg2+) along the course of El-Salam canal; means followed by the same
letter are not significantly different (p < 0.05).
Fig. 6 Heavy metals (Cd, Cu, Fe, Zn) detected in the water along the tested course of the canal; means followed by the same letter are
not significantly different (p < 0.05).
106
Table 1
A.A. Othman et al.
Over all view on the analysis of El-Salam canal water related to international permissible limits.a
Parameters
Range
Permissible limits
Irrigation water
Drinking water
(I) Chemical analysis
PH
EC (dSmÀ1)
BOD (mg lÀ1)
COD (mg lÀ1)
NH3 À (mg lÀ1)
NO2 (mg lÀ1)
NO3 À (mg lÀ1)
Ca2+ (mg lÀ1)
Mg2+ (mg lÀ1)
Na+ (mg lÀ1)
SAR (meq lÀ1)
K+ (mg lÀ1)
Cd (mg lÀ1)
Cu (mg lÀ1)
Fe (mg lÀ1)
Zn (mg lÀ1)
8.1–9.9
0.83–8.28
0.01–9.88
1.1–18.2
0.07–1.49
0.05–0.93
0.01–5.47
0.34–2.70
9.4–13.5
75–294
5.05–17.82
5–28
0.045–0.145
0.005–0.135
0.13–14.10
0.095–0.315
6.5–8.5
<0.7–<3
10WEF,40
75WEF, 80
0–5
NA
<5–<30
0–400
0-60
0–920
0–15
0–2
0.01
0.2
5.0
2.0
6.5–8.5
0.4EC
NA
NA
1.5
1.0
50
100EC
30EC
20EC–200
NA
NA
0.003
2.0
0.3
5.0
(II) Bacteriological
Total coliforms (MPN/100 ml)
Fecal coliforms (MPN/100 ml)
Total count 22 °C (colony/ml)
Total count 37 °C (colony/ml)
0–550
0–70
1.30 · 102–4 · 105
0.32 · 102-3.9 · 105
NA
Unrestricted irrigation (6 or 103)WHO
NA
NA
0
0
100EC
10 EC
NA, not available.
Bold face cells are those of concern.
a
Permissible limits are those provided by FAO for irrigation water [23] and WHO for drinking water [30]. The superscripted values: EC,
European Economic Community (EC) [37]; WEF, Water Environment Federation [22].
The suitability of the canal water for irrigation is further
evaluated by a number of measures. As excessive solutes in irrigation water are a common problem in semi-arid area, FAO
recommends the use of the sodium adsorption ratio (SAR)
to be in the range of 0–15 meq lÀ1 [23,26]. The mixed water
of El-Salam canal comply with such permissible limits and
proved to be suitable for irrigation, as SAR values reported
during the 2 years of the present study ranged from 5 to
18 meq lÀ1. The ratio is shown to be affected by seasons, being
higher in autumn and winter, and significantly increased as
well by extending of the canal course to further than 33 km.
Certainly, extending El-Salam canal through the semi-arid
desert of north Sinai is an attraction for human and animal
activities. Therefore, its water quality for human consumption
is of much concern, and justifies including microbial analyses
in the present study. The differential temperature ratio test,
rating the total bacterial counts reported on 22 and 37 °C, is
a parameter to be considered and supposed to be more than
10:1 [15]. In our study, this ratio ranged from 0.66 to 2.14 indicating the pollution of the canal water. This was also confirmed by El-Khodary [13] who reported rather narrow
ratios for all waters and sediments at various sites on the western part of the canal. However, a number of investigators [27]
dispute the validity of this ratio in warm waters. Additional
clues on imposed pollution of Hadous drain and El-Salam canal water, compared to river Nile water, was demonstrated by
phycological monitoring (diversity, saprobic indices, and
saprobic quotient) [28]. Identification of sources of pollution
was further investigated by the detection of bacterial indicators
of pollution, fecal coliform (0–70 MPN/100 ml) and fecal
streptococci (>0–550 MPN/100 ml) with a ratio ranged from
0 to 1.43, indicating the non-human sources of pollution
[29]. The reported wide range of pollution is very much influenced by the nature of the water in the canal and the applied
ratio of mixing the Nile water with the drainage water. This
is in addition to the possible variations in the biological and
chemical load of the drainage water that is affected by seasonality and potential external sources of pollution during its
course in the rural areas of the Nile Delta. Extending the canal
further than 30 km in north Sinai significantly lowered the fecal pollution rate to the permissible levels of drinking water. A
direct clue on the ability of the canal water of self-purification
by traveling such distance under this particular semi-arid
conditions.
The ammonia–nitrite–nitrate concentrations in groundwater and surface water is normally low but can reach high levels
as a result of leaching or runoff from agricultural land or contamination from human or animal wastes [23,30]. Ammonia
(0.07–1.5 mg lÀ1) and nitrate (0.01–5.47 mg lÀ1) concentrations
are found to be within the permissible limits. The higher contents of nitrite (0.06–0.93 mg lÀ1) are indication to the microbial activity, and may be intermittent. This is explained by
the higher microbial load of the tested canal water compared
to the non-polluted River Nile water [31].
Aquatic contamination by heavy metals is very harmful
since these elements are not degradable in the environment
and may accumulate in the living organisms [32,33]. Industrial
residues are presently one of the greatest and most diversified
sources to heavy metal introduction in the water environment,
and their concentration in this medium varies with the type of
effluent treatment. Discharge of metal effluents into rivers may
cause deleterious effects to the health [34]. Chemical analysis of
El-Salam canal for reusing the Nile Delta drainage water
El-Salam canal water indicated that concentrations of Cu, Zn
are within the permissible levels for irrigation and drinking
water (Table 1). While on average, Cd and Fe concentrations
exceeded the permissible levels for both irrigation and drinking. The high concentrations of Cd (.045–0.145 mg lÀ1) are
additional evident for the industrial pollution of the drainage
water used, and that the wastewater treatment of mixed drainage water was not adequate to avoid metal discharge into the
environment. Abdo [35] reported high concentrations of heavy
metals in the Damietta branch sediments, following the order
Fe > Mn > Cu > Zn > Pb > Cd. Such levels of potential
pollutants are expected taking into consideration that the canal carries the wastewater of the dense cultivated Nile Delta
with its high load of agrochemical residues as well as terrestrial
materials including microorganisms. This in addition to the
uncontrolled disposal of industrial and human activities into
the drainage system in this part of the Delta, where the canal
originates and receives its share of water resources.
In conclusion, the general picture is summarized in Table 1.
Results of the chemical and microbiological analyses are related to the permissible levels of FAO [23], WHO [30] and Mediterranean countries [36]. The canal water is generally
acceptable for irrigation; however, special concern is not directed towards microbial load (fecal coliforms) but the chemical
contents of total salts (EC), Na and K, as well as the trace elements Cd and Fe. The potability of water is disputable along
the first 30 km, in view of its higher load of total bacteria,
and total and fecal coliforms. This is in addition to the chemical
content of total salts, Na, Fe, and Cd. Our results clearly indicate the urgent need for effective strategies for the treatment of
the drainage water resources before mixing with the Nile water.
Acknowledgment
The authors pay tribute to Cairo University on its centennial
anniversary, acknowledging the European cooperation in research and education through the years. The present work
was supported by the EU-French-Egyptian Research Grant
BLAFE/FC31/3-94.
References
[1] Ta¨ckholm V. Students’ Flora of Egypt. Cairo University: Beirut
Publishing; 1974.
[2] Danin A. Desert vegetation of Israel and Sinai. Jerusalem:
Cana. Publ. House; 1983.
[3] Gibbali MA. Studies on the flora of northern Sinai. M.Sc.
Thesis. Fac. Science. Egypt: Cairo Univ.; 1988. p. 393.
[4] Boulos L. Flora of Egypt. Geraniaceae-Boraginaceae, vol. 2.
Cairo, Egypt: Al Hadara Publishing; 2000.
[5] Serag MS, Khedr AA. Vegetation–environment relationships
along El-Salam Canal, Egypt. Environmetrics 2001;12:219–32.
[6] Othman AA, Amer MW, Fayez M, Monib M, Hegazi NA.
Biodiversity of diazotrophs associated to the plant cover of
north Sinai deserts. Arch Agron Soil Sci 2003;49:683–705.
[7] Othman AA, Amer MW, Fayez M, Monib M, Hegazi NA.
Biodiversity of microorganisms in semi-arid soils of north Sinai
deserts. Arch Agron Soil Sci 2003;49:241–60.
[8] El-Degwi AMM, Ewida FM. Gawad SM. Estimating BOD
pollution rates along El-Salam canal using monitored water
quality data (1998–2001). In: Proceedings of 9th international
drainage workshop, Paper No 50. The Netherlands, Utrecht,
September 10–13; 2003.
107
[9] Mostafa AM. Development of water quality indicators and atlas
of drainage water quality using GIS tools. CIDA-DRTPCMWRI. Technical report submitted to the NAWQAM projectEgypt; 2002. p. 85.
[10] Mostafa AM, Gawad ST, Gawad SM. Development of water
quality indicators for Egyptian drains. ICID, Montreal, Canada,
Paper No. Q50/R6.01; 2002.
[11] Mostafa AM. GIS analysis of the NWQM data with emphasis
on WWTP. CIDA-DRTPC-MWRI. Technical report submitted
to the NAWQAM project-Egypt; 2001. p. 151.
[12] Rabeh SA. Monitoring of microbial pollution in El- Salam
Canal, Egypt. J Egypt Acad Soc Environ Develop
2001;2:117–27.
[13] EL-Khodary NM. Northern Sinai agricultural development
project environmental impact assessment (executive summary)
[Online].
< />summary/>, 1992 [Cited 30.01.08].
[14] Othman AA, Fayez M, Monib M, Wafaa Amer M, Ragab M,
Fendrid I, et al.. Diversity of major microbial croups and
diazotrophs in the soil–plant system of north Sinai. In: Fayez M,
Hegazi NA, editors. Proceedings of the symposium on agrotechnologies based on biological nitrogen fixation for desert
agriculture. Giza: Cairo university Press; 2000. p. 45–67.
[15] APHA (American Public Health Association). Standard
methods for the examination of water and wastewater. 2nd ed.
Berlin: Springer; 1995.
[16] Parkinson D, Gray TRG, Williams ST. Methods for study
the ecology of soil micro-organisms. IBP Handbook No. 19;
1971.
[17] Hegazi NA, Hamza MA, Osman AA, Ali SM, Sedik MZ, Fayez
M. Modified combined carbon N-deficient medium for isolation,
enumeration and biomass production of diazotrophs. In: Malik
KA, Mirza MS, Ladha JK, editors. Proceedings of the 7th
international symposium on nitrogen fixation with nonlegumes. Kluwer Academic Publishers; 1998. p. 247–53.
[18] Hegazi NA, Amer HA, Monib M. Studies on N2-fixing spirilla
(Azospirillum spp.) in Egyptian soils. Rev Ecol Biol Sol
1980;17:491–9.
[19] Golterman HL. Method for chemical analysis of fresh
water. Oxford
and
Edinburgh: Blackwell
Scientific
Publications; 1971.
[20] Mullin JB, Riley JP. The spectrophotometric determination of
nitrate in natural waters, with particular reference to sea-water.
Anal Chim Acta 1955;12:464–80.
[21] Power P, Freed R, Goetz S, Reicoskg D, Smail VW, Wolberg
PW. MSTAT microcomputer statistical program for design,
management and analysis of agronomic research experiments.
Version 4.0 Michigan State University; 1982.
[22] WEF (Water Environment Federation). Using reclaimed water
to augment potable water resources. Alexandria, VA, USA;
1998.
[23] Ayers RS, Wescot DW. Water quality for agriculture, FAO
Irrigation and Drainage Paper 29. Rome, Italy; 1994.
[24] Stanners D, Bourdeau P, editors. Europe’s environment. The
Dobbris assessment. Compiled by Eurostat together with other
organizations; 1995. p. 455.
[25] Abdelhamid MI, Shaabandessouki SA, Skulberg OM. Waterquality of the River Nile in Egypt. 1: Physical and chemical
characteristics. Arch Hydrobiol 1992;3:283–310.
[26] Jurdi M, Korfali Karahagopian SIY, Davies B. Evaluation of
water quality of the Qaraaoun reservoir, Lebanon suitability for
multipurpose usage. Environ Monit Assess 2002;77:11–30.
[27] Rai H, Hill G. Bacteriological studies on Amazon Mississippi
and Nile waters. Arch Hydrobiol 1978;81:445–61.
[28] El-Sheekh MM, Deyab MAI, Desouki SS, Eladl M.
Phytoplankton compositions as a response of water quality in
El Salam canal Hadous drain and Damietta branch of river Nile
Egypt. Pak J Bot 2010;42(4):2621–33.
108
[29] Feachem R. An improved role for faecal coliform to faecal
streptococci ratios in the differentiation between human and
nonhuman pollution sources. Water Res. 1975;9:689–90.
[30] WHO, Guidelines for drinking-water quality, incorporating first
addendum. Recommendations. 3rd ed. vol. 1. Geneva: World
Health Organization; 2006. p. 515.
[31] Ali SM, Sabae SZ, Fayez M, Monib M, Hegazi NA. The
influence of agro- industrial effluents on River Nile pollution. J
Adv Res 2011;2(1):85–95.
[32] Taylor HE, Shiller AM. Mississippi river methods comparison
study: implication for water quality monitoring of dissolved
trace elements. Environ Sci Technol 1995;29:1313–7.
[33] Zarazua G, A´vila-Pe´rez P, Tejeda S, Barcelo-Quintal I,
Martı´ nez T. Analysis of total and dissolved heavy metals
in surface water of a Mexican polluted river by Total
A.A. Othman et al.
[34]
[35]
[36]
[37]
Reflection X-ray Fluorescence Spectrometry. Spectrochim
Acta B 2006;61:180–4.
Tavares TM, Carvalho FM. Avaliac¸a˜o de exposic¸a˜o de
populac¸a˜es humanas a metais pesados no ambiente: exemplos
do Recoˆncavo Baiano’. Quı´ mica Nova 1992;15:147–54.
Abdo MH. Distribution of some chemical elements in the recent
sediments of Damietta branch, River Nile, Egypt. J Egypt Acad
Soc Environ Develop 2004;5:125–46.
Bahir A, Brissaud F. Setting up microbiological water reuse
guidelines for the Mediterranean. Water Sci Technol
2004;50:39–46.
European Economic Community (EC): Dir. 98/83: Council
Directive of 3 November 1998 on the quality of water intended
for human consumption. Off J Eur Commun 1998;L 330:32–56.