Anthropogenic Disturbances and the Natural Vegetation Regeneration: A Case Study of a Forest Fragment Located in a Cuesta Relief Area, State of São Paulo, Brazil
Bạn đang xem bản rút gọn của tài liệu. Xem và tải ngay bản đầy đủ của tài liệu tại đây (2.91 MB, 15 trang )
Open Journal of Forestry, 2015, 5, 621-635
Published Online August 2015 in SciRes. /> />
Anthropogenic Disturbances and the Natural
Vegetation Regeneration: A Case Study of a
Forest Fragment Located in a Cuesta Relief
Area, State of São Paulo, Brazil
Luiz Alberto Blanco Jorge*, Vanessa Rodrigues Pereira
Department of Forest Science-FCA, UNESP, Botucatu, Brazil
*
Email:
Received 11 June 2015; accepted 21 August 2015; published 25 August 2015
Copyright © 2015 by authors and Scientific Research Publishing Inc.
This work is licensed under the Creative Commons Attribution International License (CC BY).
/>
Abstract
The present study has been conducted in one of the five natural vegetation fragments at the Experimental Farm Edgardia, in Botucatu, São Paulo State, Brazil. In the past the forest fragment suffered disturbances due to the selective exploitation of tree species and the use of part of the surface as pasture. The objectives of this research were to evaluate the structure and the dynamics of
natural vegetation. Three phytosociological surveys (2006, 2010 and 2014) were carried out in a
sampled area of one hectare. The most abundant species were mapped in 2014, in a sampling unit
with two hectares. Individuals of 37 families and 110 species have been recorded. The oscillation
of the basal area observed through the forest inventories was due to the instability caused by disturbances. Only two out of the seven most abundant species mapped showed exponential diameter distribution. The unimodal distributions shown by the other five species have suggested that
the vegetation has been occupying the most open spaces through regeneration in cycles. There
was direct association between the spatial distribution and the dispersion syndrome for five out of
the seven most abundant species. Three species have zoochoric dispersion, showing that wild animals populations have accomplished their function in the dispersion of seeds/fruit. The spatial
distributions of four out of the seven most abundant species have provided evidence of how the
regeneration of natural vegetation is being processed in this area.
Keywords
Secondary Succession, Diameter Distribution, Spatial Statistics, Vegetation Structure
*
Corresponding author.
How to cite this paper: Jorge, L. A. B., & Pereira, V. R. (2015). Anthropogenic Disturbances and the Natural Vegetation Regeneration: A Case Study of a Forest Fragment Located in a Cuesta Relief Area, State of São Paulo, Brazil. Open Journal of
Forestry, 5, 621-635. />
L. A. B. Jorge, V. R. Pereira
1. Introduction
The landscapes inland in the State of São Paulo, Brazil, have heavily been modified by man, which led to the
decline and fragmentation of the natural vegetation, reflecting directly on the soil conservation and the water
resources, as well as the diversity of flora and fauna. In this context, the Experimental Farm Edgardia, managed
by the UNESP, presents five fragments of natural vegetation, comprising an area of 740 hectares, conforming
great importance for Botucatu municipality and Capivara River Basin, where the experimental unit is set.
This present paper refers to one of the forest fragments at Experimental Farm Edgardia, located on sandy soil
with low fertility in the area of peripheral depression in the cuesta in Botucatu. The forest fragment has suffered
disturbances in the past, which are due to: 1) the selective exploitation of the economically important tree species and 2) the use of part of the surface as pasture.
According to Elliott et al. (2013), a tropical forest is characterized by a mosaic of gaps in different sizes, regenerating patches and old growth, with species composition varying according to microhabitat, the disturbance
history, limitation of seed dispersion and chance events. All these factors contribute to the high diversity of species. Due to these occurring disturbances there might be a reversal to a temporary initial ecosystem or seral stage
in the succession sequence. The nature of the seral stage depends on the severity of the disturbance. A major
disturbance can completely destroy the community of plants and the soil. Less severe disturbances, such as exploitation, cultivation and fire, transform the forests into grass or shrub areas. When disturbances cease, sequential changes in species composition occur due to interactions among plants, animals and the surrounding environment. Grass and shrubs initiate secondary succession, where the shrubs shade out herbs. Pioneer trees that
need light shade the shrubs and much later, these become shaded by tolerant trees. Thus, the forest becomes
progressively denser, structurally more complex and richer in species, as the succession drives to the climax
conditions. Even under the best conditions, this process may take 80 - 150 years to be complete.
Local anthropogenic effects on tropical forests include land-cover change, invasive species and timber extraction (Wright, 2005). Some studies have assessed the impact of different degrees of disturbance on the species
composition, structure and dynamics (Sagar et al., 2003; Hitimana et al., 2009). Secondary forests resulted from
these disturbances have rapid rates of aboveground production, especially during the early stages of succession.
Consequently, they have the potential to assimilate and store relatively large fractions of carbon and nutrients
that are lost during deforestation and land use phases (Hughes et al., 1999).
One tried to understand the process of the vegetation regeneration in this study area. This understanding is
important for the conservation of this natural resource, but it is also important for offering subsidies during the
pre-selection of species to be tested for the purpose of restoration. The current research aimed to answer the following question: how has the natural vegetation behaved up until the present moment, before two anthropogenic
disturbances checked on site? For this purpose, the specific objectives of this research were: 1) to evaluate the
structure and the dynamics of the natural vegetation; 2) to analyze the diameter distribution of each tree species
which was more abundant among the ten with the highest importance value in the area; 3) to check the spatial
distribution patterns and the associations among tree species which were more abundant in the forest fragment.
2. Material and Methods
2.1. Study Area
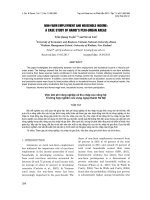
The studied forest fragment lies on Experimental Farm Edgardia (1200 ha) (Figure 1), in Botucatu, State of São
Paulo, and between the geographical coordinates 22˚47'30" and 22˚50' latitude S and 48˚26'15" and 48˚22'30"
longitude W. On this site two geomorphic units are observed: cuesta front, a basaltic escarpment with their originated soils and the peripheral depression, comprising the presence of sandstones and alluvial sediments,
mainly at east, covering the wetlands of the Capivara River Basin, 250 meters lower in relation to the basaltic
Cuesta (Carvalho et al., 1991).
The climate in this region has two distinct seasons: a rainy and warm season (from September to March) and a
dry and cool one (from April to August). The average annual rainfall is 1428.4 mm. The average annual temperature is 20.3˚C, with monthly averages ranging from 17.1˚C (July) to 23.1˚C (February) (da Cunha & Martins,
2009). The main uses of the land at Edgardia Farm are for extensive livestock grazing, crops and small areas for
forest plantations.
622
L. A. B. Jorge, V. R. Pereira
Figure 1. Position of the two transects of adjoining units (red) in relation to the sampling area for the mapping of the most
abundant species (rectangle in orange), on aerial photography of 2005, which shows the limits of the Edgardia Experimental
Farm (in white).
The natural vegetation (with 740 hectares and 61.67 percent of total farm area) partially sheds its leaves during the dry season. It is classified as semi-deciduous forest (IBGE, 2012). In the area it occurs forest fragments
showing different levels of anthropogenic disturbance. They are also present in the remaining place of transition
vegetation between forest and forested savanna, and riparian forests.
The inventoried forest fragment, where the vegetation is characterized as an ecotone between semidecidual
seasonal forest and forested savanna, is situated in an area of predominantly Albic Arenosols, with low fertility.
Most of the 111.29 hectares of the vegetation fragment are located on the Edgardia Farm, but a portion of the
study area is located on a neighboring property.
This fragment has suffered disturbances generated in the past by: 1) selective exploitation of economically
important tree species (area 1 in Figure 2), with the last intervention occurring between 1975 and 1980 (extraction of Astronium graveolens (Anacardiaceae), Copaifera langsdorffii (Fabaceae-Caesalpinioideae) and Hymenaea courbaril (Fabaceae-Caesalpinioideae) individuals); and 2) use of part of the area as pastureland (area 2 in
Figure 2).
2.2. Phytosociological Surveys
The phytosociological surveys of the natural vegetation of the forest fragment, which were conducted in 2006,
2010 and 2014, involved an initial allocation of adjoining units of 10 × 25 m strips transecting the variation gradient, characterizing a systematic single-stage sampling design. The distance between the two transects was 300
meters. A total of 40 permanent units were sampled (first transect units numbered from 1 to 24 and second transect units numbered from 25 to 40 (Figure 3)), covering an area of 1 hectare. The entry and exit points of the
transects in the fragment, as well as the location of the units in the field, were georeferenced using GPS. All individual trees in the sampling units presenting a diameter at breast height (DBH) ≥ 4.8 cm were inventoried. A
collection of botanical material allowed for the identification of the species occurring in the area. Exsiccata of
reproductive material were deposited in the herbarium of the Department of Forest Science of the Faculty of
Agronomic Sciences of UNESP at Botucatu. The species found in the forest fragment were classified according
to the APG III botanical classification system, checking the species list of flora in Brazil (Jardim Botânico do
Rio de Janeiro, 2014).
623
L. A. B. Jorge, V. R. Pereira
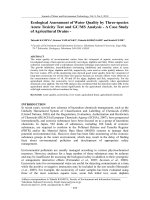
Figure 2. Position detail of the two transects of adjoining units (red) in relation to the sampling area for the mapping of the
most abundant species (rectangle with orange lines), on aerial photography of 1962.
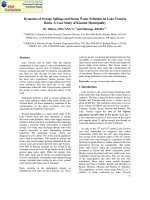
Figure 3. Position of the forty permanent units (red) sampled in the phytosociological surveys.
The quantitative parameters employed in the study of the horizontal structure of the vegetation were absolute
density-AD (1), relative density-RD (2), absolute dominance-ADo (3), relative dominance-RDo (4), absolute
frequency-AF (5) and relative frequency-RF (6), which were also expressed in the form of an importance value
index-IVI (7) resulting from the sum of the relative values of these parameters (Müeller-Dombois & Ellenberg,
1974). The parameters related to the horizontal structure of the sample of 1 hectare were calculated for 2006, 2010
624
L. A. B. Jorge, V. R. Pereira
and 2014, after developing corresponding script in the environment of the software R (R Core Team, 2013).
ADi =
ni
A
(1)
ADi
=
RDi
× 100
∑ i =1ADi
P
ADoi =
=
RDoi
RFi
=
Gi
A
(3)
ADoi
∑ i =1ADoi
AF=
i
(2)
P
× 100
(4)
ui
× 100
ut
AFi
∑ i =1AFi
P
(5)
× 100
(6)
IVI i =RDi + RDoi + RFi
(7)
where ni = number of sampled individuals for the ith species; Gi = basal area for the ith species; ui = number of
sample units where the ith species is present; ut = total number of sample units; P = number of sampled species;
A = sampled area (in hectares);
2.3. Mapping of the Most Abundant Species
Individuals occurring in a sampled rectangular area of 2 hectares (Figure 1 and Figure 2) have been mapped for
the analysis of the spatial distribution of the most abundant species in this forest fragment, based on the methodology described by Figueiredo and Cunha (2007) using GPS with high sensitivity antenna, allowing to capture
the satellite signals even under the coverage of trees. The mapping included individuals with minimum DBH of
4.8 cm.
The diameter distributions of the most abundant species among the ten with the highest importance value in
this surveyed area have been made. The frequencies observed by diameter classes have been computed from the
development of the corresponding script, which has been programmed within the software R environment. Trying to describe the behavior of the diameter distributions showing a J reverted pattern in a more detailed manner,
three exponential models have been set (Table 1). The best adjustment possible has indicated whether the decrease in the number of trees related to a specific distribution has approached a uniform geometric progression—Type I, increasing geometric progression—Type II, or decreasing geometric progression—Type III
(Loetsch et al., 1973).
Based on the linearized model (Table 1) linear equations have been used as functions of self-initiation for the
adjustment of nonlinear equations within the statistical software R (Ritz and Streibig, 2008) as initial values of
the coefficients a, b, respectively taken by eb0, b1.
Four models (Table 2) have been applied in this present research when the observed frequencies of a given
species showed a unimodal diameter distribution pattern. The linearized models have been adjusted. The best
equation based on the coefficient of determination (R2) has been selected, as well as standard error of estimate
(S.E.) and the coefficients significance. After having derived the antilogarithm of the chosen equation, the estimated distribution was described.
Among other statistics, the quality of the adjustment for equations used to describe the diameter distributions,
both for those with a standard inverted J, as well as for the unimodal, has been measured by the adjustment index-AI (22).
(
n
∑ i =1 yi − yi
=
AI 100 1 −
n
∑ i =1 yi − yi
(
625
)
)
2
2
(22)
L. A. B. Jorge, V. R. Pereira
Table 1. Models adjusted for inverted J curve of diameter distribution.
Type
Geometric progression
Exponential model
I
Uniform
N i = ae
II
Increasing
N i = aebd
III
Decreasing
N i = aebd
bdi
2
i
12
i
Linear model
(8)
ln N=
b0 + b1di (11)
i
(9)
ln N=i b0 + b1di2 (12)
(10)
ln N i = b0 + b1di1 2 (13)
Ni = number of individuals in class i; di = center of diameter class i; a, b = coefficients of exponential models; b0, b1 = coefficients of linear models.
Table 2. Models adjusted for unimodal diameter distribution.
Model
N i = ad e
b
i
cdi
N i = adib ecd
N i = adib ecd
2
i
12
i
N i = adib ecd
γ
i
Linear model
(14)
ln N i =
b0 + b1 ln di + b2 di (18)
(15)
ln N i =
b0 + b1 ln di + b2 di2 (19)
(16)
ln N i =
b0 + b1 ln di + b2 di1 2 (20)
(17)
ln N i =
b0 + b1 ln di + b2 diγ (21)
Ni = number of individuals in class i; di = center of diameter class i; a, b, c = coefficients of nonlinear models; b0, b1, b2 = coefficients of linear models;
γ = power.
where yi = observed absolute frequency in diameter class i;
yi = expected absolute frequency in diameter
class i; yi = average frequency of n classes.
The point maps containing the position of each evaluated individual species for the spatial distribution have
been prepared within the ArcInfo v.10 software environment based on the GPS files. In a second moment, the
data were transferred to the software R environment, using the package “spatstat” (Baddeley, 2010).
Ripley K function computes the distances among all the trees on a map (Cruz-Rot, 2006). In a simplified way,
the procedure involves generating a rradius circle centered on each tree. The number of neighbors within each
circle is counted. By varying the r radius, it is possible to detect spatial patterns at different scales. In order to
determine the distribution pattern of individuals of the most abundant species the L function has been applied in
accordance with Cruz-Rot (2006) and Dalmaso et al. (2012). The L function is transformed from the univariated
K function (L(r) = (K(r)/π)1/2). Significance tests for spatial measurements are usually built using the Monte
Carlo simulations (Diggle, 2003). For the univariated function, the null hypothesis is from the complete spatial
randomness (test if L(r) – r = 0 to each r distance). The hypothesis has been tested in “spatstat” in 500 Monte
Carlo simulations as α = 0.01. Confidence envelopes have been created. Thus, for the observed values inside
these envelopes, random spatial patterns have been considered. For positive values outside these confidence envelopes, null hypothesis has been rejected and the spatial pattern as aggregate has been considered.
Tests of interaction between species have been carried out with the use of K12 bivariate function and the L12
corresponding function (Cruz-Rot, 2006). The observed values for L12 have been compared to the theoretical
values for a null value of the independence hypothesis corresponding to the absence of interaction between the
two kinds of points. The null model (spatial independence hypothesis) has been generated with 500 simulations
for α = 0.01, using the package “spatstat”.
3. Results and Discussion
3.1. Natural Vegetation Behavior
The phytosociological surveys involved individuals from 37 families and from 110 species. The diameter distribution of the forest community based on the inventory of 2014 has been characterized by a typical pattern in
inverted J (Figure 4). The basal area (m2/ha) of measured individuals in the sampled area of one hectare showed
the value of 16.6419 in 2006, increasing to 18.5184 in 2010, slightly decreasing to 18.3363 in 2014. This oscillation in the basal area is due to the instability caused by disturbances in the fragment, which is in the process of
regeneration. Changes in the distribution of the basal area of the 40 sampled units also occurred between 2006
626
L. A. B. Jorge, V. R. Pereira
Figure 4. Diametric distribution of forest community based
on the 2014 inventory.
and 2014 (Figure 5).
Regarding phytosociological surveys from 2006, 2010 and 2014, eight species have remained among the ten
with the highest importance value—IVI (Figure 6). Three other species have been in and out of the list of the
ten highest IVIs within eight years of observation but these were at the minimum in the eleventh position.
3.2. Diametric Structure of the Most Abundant Species
Analyzing the diameters distributions (Table 3 and Table 4, Figure 7) of the seven most abundant species in the
forest fragment which remained on the list among the ten with the highest importance value from 2006 to 2014,
it was found that for two of them Trichilia pallida (Meliaceae) and Metrodorea nigra (Rutaceae) a standard inverted J had occurred, an indication that the regeneration has processed continuously. Five further species (Croton floribundus (Euphorbiaceae), Mabea fistulifera (Euphorbiaceae), Ocotea velutina (Lauraceae), Astronium
graveolens (Anacardiaceae) and Copaifera langsdorffii (Fabaceae-Caesalpinioideae)) have shown a unimodal
distribution pattern, characteristic of regeneration in cycles.
The equations used in the description of distributions in inverted J for Trichilia pallida and Metrodorea nigra,
have been adjusted from the model (9) and have been selected based on the coefficients significance level, on
the standard error of the estimate values (S.E.) and on the adjustment index—AI% (Table 3). The selection of
equations related to model (9) shows that the decrease of individuals within the classes took place in increasing
geometrical progression.
The equations used in the description of the unimodal distributions for Croton floribundus, Mabea fistulifera,
Ocotea velutina, Astronium graveolens and copaifera langsdorffii have been adjusted, respectively, from models
(19), (18), (21), (21) and (18), selected based on the coefficients significance level, on the standard error of the
2
estimate values (S.E.), on the adjusted determination coefficient Radjusted and on the adjustment index—AI%
(Table 4).
(
)
3.3. Spatial Arrangement of the Most Abundant Species
The mapping of trees has allowed checking the distribution of individuals among the seven species (Figure 8)
within the surveyed area of two hectares in 2014 in the remaining natural vegetation. It was possible to determine
the spatial distribution pattern of the species (Figure 9). Croton floribundus, Trichilia pallida, Mabea fistulifera,
Astronium graveolens and Metrodorea nigra have shown an aggregated distribution of the individuals based on
the fact that, for these five species, the line describing the L function has exceeded the expected theoretical value,
this is, the confidence envelope (gray area). As for Copaifera langsdorffii the empirical function (estimated L)
627
L. A. B. Jorge, V. R. Pereira
Figure 5. Distribution of basal area (m2/ha): (a). 2006; (b). 2010; (c). 2014.
628
L. A. B. Jorge, V. R. Pereira
Figure 6. Ten species with the highest importance index values: (a) 2006;
(b) 2010; (c) 2014.
was kept within the confidence limits, indicating random distribution pattern. The spatial distribution pattern for
Ocotea velutina depended on the scale of analysis. Ocotea velutina has shown a pattern of aggregate distribution
for a radius distance among individuals within 0 and 10 meters and randomized distribution for subjects with
distance greater than 10 meters among them.
The dispersion of seeds produced by the parent plant is the initial process which generates the spatial distribution of a particular species. For a species for which the dispersion occurs by the wind (anemochory), a random
distribution of individuals would be expected. Regarding autochory, the expectation lies in the deposition of
629
L. A. B. Jorge, V. R. Pereira
Figure 7. Diameter distribution of: (a) Croton floribundus; (b) Trichilia pallida; (c) Mabea fistulifera; (d) Ocotea velutina;
(e) Astronium graveolens; (f) Copaifera langsdorffii; (g) Metrodorea nigra.
Figure 8. Spatial distribution of individuals: (a) Croton floribundus; (b) Trichilia pallida; (c) Mabea fistulifera; (d) Ocotea
velutina; (e) Astronium graveolens; (f) Copaifera langsdorffii; (g) Metrodorea nigra.
seeds/fruit in certain micro sites, more specifically around the parent plant, setting an aggregated distribution.
Such pattern would also be plausible for species dispersed by animals (zoochory), since there is often deposition
of seeds in certain locations, such as feeding perches. Harms et al. (2000) and Jordano and Godoy (2002) observed dispersion by animals with seed accumulation at certain points, while much of the area was not affected
by the spread, in contrast to the usual random patterns of anemochoric species. These likely direct associations
630
L. A. B. Jorge, V. R. Pereira
Figure 9. L-function and confidence envelope for: (a) Croton floribundus; (b) Trichilia pallida; (c) Mabea fistulifera; (d)
Ocotea velutina; (e) Astronium graveolens; (f) Copaifera langsdorffii; (g) Metrodorea nigra.
Table 3. Statistics related to the equations adjusted for inverse-J-shaped diameter distribution.
Distribution
Model
(8)
Trichilia pallida
(9)
(10)
(8)
(9)
Metrodorea nigra
(10)
***
a
S.E.
No. iterations
AI (%)
**
1.9990
6
99.21
***
b
**
−0.27586
***
−0.01583
2830.120475
626.920492
260.239418
88.440622
127.843453
**
15947.741390
0.8968
4
99.84
−1.62969
**
2.8720
10
98.36
−0.49463
**
3.7620
9
95.98
−0.03717
**
2.8770
6
97.65
−2.54225
**
4.2850
15
94.79
P ≤ 0.001; P ≤ 0.01; P ≤ 0.05.
**
*
between the spatial distribution pattern found and the dispersion syndrome has not been observed for all of the
seven most abundant species in the study area (Table 5). This indicates that in the process for Astronium graveolens and Copaifera langsdorffii, besides the seed dispersal, other aspects related to ecophysiological characteristics of species (phenology, intra and interspecific competition) have shown up, as well as environmental
631
L. A. B. Jorge, V. R. Pereira
Table 4. Statistics related to the equations adjusted for unimodal diameter distribution.
Distribution
Model
Croton floribundus
Mabea fistulifera
b0
b1
(18)
−9.55245
(19)
−4.62301**
(20)
−8.13890
(18)
−5.16013
(19)
−0.89075
(20)
−1.05920
(18)
−0.84583
(19)
***
**
*
7.06202
***
3.25689***
14.77750
***
2
Radjusted
AI (%)
6.52235
**
−0.42328
1
0.1014
0.9928
97.98
2
0.0850
0.9949
99.50
**
1/2
0.1827
0.9766
93.47
***
***
−0.00505***
−7.37980
−0.64644
*
−0.01108
***
−9.51500
2.29086
15.02790
1
0.1918
0.9786
96.73
**
2
0.2359
0.9677
95.03
***
2.94025
−0.29244
*
1.64965
0.73802
−0.00427
*
0.72890
*
−4.62700
*
7.36100
**
**
−489.24000
**
1/2
0.1913
0.9787
96.04
1
0.3364
0.8695
91.20
2
0.3754
0.8375
84.84
1/2
0.3194
0.8824
93.66
0.085
0.3077
0.8909
95.20
(21)
481.54000
(18)
−1.52944
2.65426
−0.17303
1
0.1465
0.9614
97.72
(19)
1.10459
0.84413
−0.00180
2
0.2138
0.9177
94.63
(20)
−1.49870
6.37560
−3.26850
1/2
0.1130
0.9770
98.72
11.37610
Astronium graveolens
Copaifera langsdorffii
S.E.
**
Ocotea velutina
(20)
γ
b2
50.62000
−16.77620
0.3
0.0999
0.9820
99.02
*
−0.18584
*
1
0.1736
0.9777
97.44
−1.16236
1.49285
−0.00145
*
2
0.2425
0.9564
97.25
−6.30100
*
−3.98200
**
1/2
0.1828
0.9752
94.46
*
(21)
10.12200
(18)
−5.28260
(19)
(20)
*
*
3.96967
9.04300
P ≤ 0.001; P ≤ 0.01; P ≤ 0.05.
**
*
Table 5. Characteristics of the most abundant species.
Species
Occurrence
Dispersion
Spatial
Distribution
Astronium graveolens
interior of forest fragments.
Anemochory
aggregate
Copaifera langsdorffii
semi-deciduous forest-forested savanna ecotone.
Zoochory
random
Croton floribundus
secondary formations of semi-deciduous forest.
Autochory/Zoochory
aggregate
Mabea fistulifera
secondary vegetation in sandy soils.
Autochory
aggregate
Metrodorea nigra
understory of dense forest; moist and shady places.
Autochory
aggregate
Ocotea velutina
dense semi-deciduous forest and secondary formations.
Zoochory
aggregate/random
Trichilia pallida
understory, gaps and edge of forest fragments.
Zoochory
aggregate
conditions (light availability, humidity, nutrients in the soil) in micro sites, where the seeds of the trees were
deposited. Direct association between the spatial distribution and dispersion syndrome have been observed to
Croton floribundus, Mabea fistulifera, Metrodorea nigra, Trichilia pallida and Ocotea velutina, in that case in
specific scales.
3.4. Occurrence of Species that Reflect the Natural Regeneration Process
In the natural regeneration process of the vegetation in the forest fragment studied, the occurrence of four species (among the seven most abundant) could be analyzed within the two environments evidenced in the aerial
photography in 1962 (Figure 10). Croton floribundus is seen at site 1 but mainly at site 2, used as pasture in the
past (grazing pasture). Mabea fistulifera trees are located almost exclusively at site 2, in clearer places. There is
no spatial interaction between these both species in a scale of 0 to 15 meters (Figure 11(a)). The spatial distribution of Croton floribundus is independent related to the distribution of the other two species (Figure 11(b)
632
L. A. B. Jorge, V. R. Pereira
Figure 10. Occurrence of Astronium graveolens, Croton floribundus, Mabea fistulifera and Metrodorea nigra, in the sampled area of two hectares, on the aerial photography of 1962.
Figure 11. Spatial dependence analysis with the K12 function (estimated L12) for trees of: (a) Croton floribundus and Mabea
fistulifera; (b) Croton floribundus and Astronium graveolens; (c) Croton floribundus and Metrodorea nigra; (d) Mabea fistulifera and Astronium graveolens; (e) Mabea fistulifera and Metrodorea nigra; (f) Astronium graveolens and Metrodorea nigra.
633
L. A. B. Jorge, V. R. Pereira
and Figure 11(c)). The attraction among Mabea fistulifera and Astronium graveolens or Metrodorea nigra only
occurs among individuals which are very close (Figure 11(d) and Figure 11(e)), showing a certain inhibition
compared to Metrodorea nigra in the range from 10 to 25 meters. Astronium graveolens and Metrodorea nigra
are regenerating mainly at site 1, where there has been selective exploitation of tree species (last intervention
from 1975 to 1980) but which, in a way, has kept its natural forest coverage. In the analysis of spatial dependence both species showed positive association/attraction (Figure 11(f)). Astronium graveolens occupies the
upper canopy and Metrodorea nigra the understory in areas with denser forest coverage.
The spatial distributions of Astronium graveolens, Croton floribundus, Mabea fistulifera and Metrodorea nigra have provided signs of how the natural vegetation regeneration process is being processed before the two
kinds of anthropogenic disturbances, common in tropical forest fragments areas.
An important aspect of researches conducted from surveys in forest fragments is related to the foundation
they can offer in the selection of species to be used in areas with similar environmental conditions in restoration
projects. An interesting method of ecological restoration is one based on framework species (Tucker and Murphy, 1997; Blakesley et al., 2002; Elliott et al., 2003). Framework tree species are indigenous forest tree species,
planted to complement and accelerate natural regeneration of forest ecosystems and encourage biodiversity recovery, on degraded tropical sites. The method involves planting mixtures of 20 - 30 species or roughly 10% of
the estimated number of tree species in the target forest. In this context, as a development of this work, the
pre-selection of the eleven species have been considered, the ones with the highest importance value (Figures
6(a)-(c)) related to the natural vegetation of the forest fragment studied, to be tested in restoration experiments
using the framework species method.
4. Conclusions
The oscillation of the basal area, observed throughout the forest inventories carried out in 2006, 2010 and 2014,
within the sampled area of one hectare consisting of contiguous permanent units, was due to the instability
caused by the disturbances which happened in natural vegetation fragment under study.
Only two out of the seven most abundant species mapped in 2014 in the rectangular sampling unit with two
hectares showed exponential diameter distribution (inverted J), indicating continuous regeneration, as would be
expected for all of them. The unimodal distributions shown by the other five species indicated that the vegetation had been occupying the most open spaces, trying to colonize the areas which were most affected by the
anthropogenic disturbances, by regeneration in cycles.
The exponential model of type II, adjusted for the two species that showed a diameter distribution pattern in
inverted J, properly estimated the distributions and allowed checking that the decrease of individuals within the
diameter classes took place in increasing geometrical progression.
Based on the classic exponential models, four models were developed for the five species that presented a
unimodal diameter distribution pattern. Generally, the distributions were properly estimated by the equations,
showing the potential use of the models.
Direct association has been verified between the spatial distribution and the dispersion syndrome for five out
of the seven most abundant species. Three species are characterized by zoochorous dispersion, showing that
wild animals’ populations have accomplished their function as seeds/fruit dispersers.
The spatial distribution of four out of the seven most abundant species provided signs of how the regeneration
of natural vegetation was being processed in this study area, before two kinds of characterized anthropogenic
disturbances.
References
Baddeley, A. (2010). Analysing Spatial Point Patterns in R. Version 4.1. Perth: CSIRO and University of Western Australia.
/>Blakesley, D., Elliott, S. D., Kuarak, C., Navakitbumrung, P., Zangkum, S., & Anusarnsunthorn, V. (2002). Propagating
Framework Tree Species to Restore Seasonally Dry Tropical Forest: Implications of Seasonal Seed Dispersal and Dormancy. Forest Ecology and Management, 164, 31-38. />Carvalho, W. A., Panoso, L. A., & Moraes, M. H. (1991). Levantamento semidetalhado dos solos da Fazenda Experimental
Edgardia—Município de Botucatu. Botucatu: Faculdade de Ciências Agronômicas—UNESP, 467 p.
Cruz-Rot, M. (2006). Introdución al análisis de datos mapeados o algunas de las (muchas) cosas que puedo hacer si tengo
634
coordenadas. Ecosistemas, 15, 19-39. />
L. A. B. Jorge, V. R. Pereira
da Cunha, A. R., & Martins, D. (2009). Classificação climática para os municipios de Botucatu e São Manuel, SP. Irriga, 14,
1-11. />Dalmaso, C. A., Inoue, M. T., Oliveira Filho, P. C., Marcelino, V. R., & Pottker, G. S. (2012). Análise dos padrões espaciais
de Ocotea odorifera (Vell.) Rohwer na Floresta Nacional de Irati (PR). Revista Ambiência, 8, 559-570.
/>Diggle, P. J. (2003). Statistical Analysis of Spatial Point Patterns. London: Academic Press.
Elliott, S. D., Navakitbumrung, P., Kuarak, C., Zangkum, S., Anusarnsunthorn, V., & Blakesley, D. (2003). Selecting
Framework Tree Species for Restoring Seasonally Dry Tropical Forests in Northern Thailand Based on Field Performance.
Forest Ecology and Management, 184, 177-191. />Elliott, S.D., Blakesley, D., & Hardwick, K. (2013). Restoring Tropical Forests: A Practical Guide. Kew: Royal Botanic
Garden, 344 p.
Figueiredo, E. O., & Cunha, R. M. (2007). Levantamento das árvores com coordenadas apropriadas com GPS de alta
sensibilidade. In: E. O. Figueiredo, E. M. Braz, & M. V. N. D’oliveira (Editores téCnicos), Manejo de precisão em
florestas tropicais: modelo digital de exploração florestal (pp. 103-118). Rio Branco: Embrapa Acre.
Harms, K. E., Wright, S. J., Calderón, O., Hernández, A., & Herre, E. A. (2000). Pervasive Density-Dependent Recruitment
Enhances Seedling Diversity in a Tropical Forest. Nature, 404, 493-495. /> />Hitimana, J., Kiyiapi, J., Njunge, J., & Bargerei, R. (2009). Disturbance Indicators and Population Decline of Logged Species in Mt. Elgon Forest, Kenya. African Journal of Ecology, 48, 699-708.
/>Hughes, R. F., Kauffman, J. B., & Jaramillo, V. J. (1999). Biomass, Carbon, and Nutrient Dynamics of Secondary Forests in
a Humid Tropical Region of México. Ecology, 80, 1892-1907.
IBGE (2012). Manual técnico da vegetação brasileira (2 ed.). Rio de Janeiro: IBGE, Diretoria de Geociências,
Departamento de Recursos Naturais e Estudos Ambientais, 271 p.
Jardim Botânico do Rio de Janeiro (2014). Lista de Espécies da Flora do Brasil. />Jordano, P., & Godoy, J. A. (2002). Frugivore-Generated Seed Shadows: A Landscape View of Demographic and Genetic
Effects. In D. J. Levey, W. R. Silva, & M. Galleti (Eds.), Seed Dispersal and Frugivory: Ecology, Evolution and Conservation (pp. 305-321). New York: CABI Publishing.
/>ape_view_of_demographic_and_genetic_effects//links/0912f504df32a5b442000000.pdf
Loetsch, F., Zohrer, F., & Haller, K. E. (1973). Forest Inventory (Vol. 2). München: BLV Verlagsgesellchaft, 469 p.
Müeller-Dombois, D., & Ellemberg, H. (1974). Aims and Methods of Vegetation Ecology. New York: John Wiley & Sons,
547 p.
R Core Team (2013). R: A Language and Environment for Statistical Computing. Vienna: R Foundation for Statistical
Computing. />Ritz, C., & Streibig, J. C. (2008). Nonlinear Regression with R. New York: Springer, 144 p.
Sagar, R., Raghubanshi, A. S., & Singh, J. S. (2003). Tree Species Composition, Dispersion and Diversity along a Disturbance Gradient in a Dry Tropical Forest Region of India. Forest Ecology and Management, 186, 61-71.
/>Tucker, N. I. J., & Murphy, T. M. (1997). The Effects of Ecological Rehabilitation on Vegetation Recruitment: Some Observations from the Wet Tropics of North Queensland. Forest Ecology and Management, 99, 133-152.
/>Wright, S. J. (2005). Tropical Forests in a Changing Environment. Trends in Ecology and Evolution, 20, 553-560.
/>
635