Determination of melamine in soil samples using surfactant-enhanced hollow fiber liquid phase microextraction followed by HPLC–UV using experimental design
Bạn đang xem bản rút gọn của tài liệu. Xem và tải ngay bản đầy đủ của tài liệu tại đây (815.4 KB, 10 trang )
Journal of Advanced Research (2015) 6, 957–966
Cairo University
Journal of Advanced Research
ORIGINAL ARTICLE
Determination of melamine in soil samples
using surfactant-enhanced hollow fiber liquid
phase microextraction followed by HPLC–UV
using experimental design
Ali Sarafraz Yazdi *, Samaneh Raouf Yazdinezhad, Tahereh Heidari
Department of Chemistry, Faculty of Sciences, Ferdowsi University of Mashhad, Iran
A R T I C L E
I N F O
Article history:
Received 22 July 2014
Received in revised form 30 October
2014
Accepted 31 October 2014
Available online 8 November 2014
Keywords:
Melamine
Hollow fiber liquid phase
microextraction
High performance liquid
chromatography–UV detection
Soil
Experimental design
A B S T R A C T
Surfactant-enhanced hollow fiber liquid phase (SE-HF-LPME) microextraction was applied for
the extraction of melamine in conjunction with high performance liquid chromatography with
UV detection (HPLC–UV). Sodium dodecyl sulfate (SDS) was added firstly to the sample solution at pH 1.9 to form hydrophobic ion-pair with protonated melamine. Then the protonated
melamine–dodecyl sulfate ion-pair (Mel–DS) was extracted from aqueous phase into organic
phase immobilized in the pores and lumen of the hollow fiber. After extraction, the analyteenriched 1-octanol was withdrawn into the syringe and injected into the HPLC. Preliminary,
one variable at a time method was applied to select the type of extraction solvent. Then, in
screening step, the other variables that may affect the extraction efficiency of the analyte were
studied using a fractional factorial design. In the next step, a central composite design was
applied for optimization of the significant factors having positive effects on extraction efficiency.
The optimum operational conditions included: sample volume, 5 mL; surfactant concentration,
1.5 mM; pH 1.9; stirring rate, 1500 rpm and extraction time, 60 min. Using the optimum conditions, the method was analytically evaluated. The detection limit, relative standard deviation
and linear range were 0.005 lg mLÀ1, 4.0% (3 lg mLÀ1, n = 5) and 0.01–8 lg mLÀ1, respectively. The performance of the procedure in extraction of melamine from the soil samples
was good according to its relative recoveries in different spiking levels (95–109%).
ª 2014 Production and hosting by Elsevier B.V. on behalf of Cairo University.
* Corresponding author. Tel.: +98 511 8797022; fax: +98 511
8796416.
E-mail address: (A. Sarafraz Yazdi).
Peer review under responsibility of Cairo University.
Production and hosting by Elsevier
Introduction
Melamine, 1,3,5-triazine-2,4,6-triamine, is a triazine-based
chemical containing high nitrogen level (66.7 g nitrogen in
100 g). This chemical is used widely in production of melamine
resins which has a broad range of industrial uses, including
manufacture of industrial coating, components of paper and
/>2090-1232 ª 2014 Production and hosting by Elsevier B.V. on behalf of Cairo University.
958
paperboards, white boards, dishware, kitchenware, plastics,
flame retardant fibers, electrical equipment, adhesives, laminates, permanent-press fabrics [1–3]. Melamine is also added
to crop fertilizer for its high N content to act as a slow nitrogen
release source [4–6]. It may also be a by-product when triazinebased pesticides such as cyromazine are used [7].
Melamine contamination has been detected in both environmental and food samples. The primary source of food contamination with melamine was resulted from using melaminetainted milk or other protein sources such as wheat gluten as
one of food ingredients [8,9].
The stimulus for addition of melamine as adulteration to
food products is its high nitrogen content that increases the
apparent protein content measured by standard protein analysis tests, such as Kjeldahl or Dumas [10].
Apart from adulterated products, migration of melamine
from kitchenware in contact with food content at higher temperatures or acidic conditions [11,12] was known as another
source of melamine contamination.
Environmental melamine contamination has also detected
due to its huge consumption in industry and also its application in agriculture. As evidence, detection of melamine in
waste water [13], water and sediment [14], soil [15] and as a
consequence crops [16] can be mentioned.
The maximum level allowed for melamine residue has regulated and set 1 mg kgÀ1 for powdered infant formula and
2.5 mg kgÀ1 for other foods and animal feed (FAO/WHO
2010) [17].
Melamine can cause tissue injury, such as acute kidney failure, urolithiasis, bladder cancer, and even death above the
safety regulation level [18].
There are several analytical methods reported for quantitative determination of melamine in different matrices, including: high performance liquid chromatography with UV
detection (HPLC–UV) [19–21], liquid chromatography–tandem mass spectrometry (LC/MS/MS) [22–24], gas chromatography–mass
spectrometry
(GC/MS)
[25–27,9],
gas
chromatography–tandem mass spectrometry (GC/MS/MS)
[28,29], capillary zone electrophoresis [30], and enzyme-linked
immunosorbent assay (ELISA) [31]. Different samples require
especial pretreatment before analysis depending on their matrices. However, most of the reported methods have applied for
determination of melamine in food samples, especially dairy
product and milk while few studies have reported melamine
analysis in soil samples [15,16,32,33].
The present study utilized surfactant-enhanced two-phase
hollow fiber liquid phase microextraction in combination with
HPLC–UV for determination of melamine in soil samples.
Sodium dodecyl sulfate (SDS) was employed to form an
extractable ion-pair with aqueous protonated melamine in
acidic solution. Firstly melamine was converted to a protonated species in the presence of acid in aqueous sample solution.
Then the positively charged analyte formed an ion-pair with
sulfate group of SDS. Hydrocarbon tail of SDS in the formed
ion-pair enhanced the extraction efficiency of melamine––that
is known as a polar compound by itself––into an organic
phase. The effects of different parameters on extraction efficiency of the protonated melamine–dodecyl sulfate ion-pair
(Mel–DS) were evaluated by a multivariate strategy based on
an experimental design. Firstly, a fractional factorial design
was employed for screening the main parameters affecting
the extraction efficiency and then a central composite design
A. Sarafraz Yazdi et al.
was performed to optimize the significant variables involved
in the procedure. The model can predict mathematically how
a response relates to the values of various factors [34]
moreover, allows optimization with a minimum number of
experiments compared to a one-at-a-time procedure.
Experimental
Reagents and material
The hollow fiber polypropylene membrane support Q 3/2
Accurel PP (200 lm thick wall, 600 lm inner diameter and
0.2 lm average pore size) was obtained from Membrana
(Wuppertal, Germany). 1-Decanol, 1-octanol, isooctane, toluene and butyl acetate were purchased from Merck (Darmstadt,
Germany) and were used as extraction solvents. Hydrochloric
acid, trifluoroacetic acid (TFA), sodium chloride and methanol were also supplied by Merck (Darmstadt, Germany). Melamine was purchased from Fluka (Sigma–Aldrich, St. Louis,
MO, USA) and was used as standard. These materials are all
of analytical grade.
Stock solution of melamine (500 lg mLÀ1) was prepared by
dissolving it in 50% aqueous methanol. The stock standard
solution was kept in 4 °C and protected from light. It was stable at least for one year [35]. Aqueous working solutions were
prepared daily by dilution of stock solution with double distilled water.
Deionized water was prepared by Millipore Q 5 instrument
(Millipore Corp., Billerica, MA, USA).
Apparatus
The experiment was carried out using a Shimadzu HPLC system comprising a micro-volume double plunger pump connected with a manual injector with a 100 lL sample loop,
solvent delivery module LC-20AD, on-line degasser DGU20A5 and column oven CTO-20AC.
The UV detector SPD-20A with wavelength of 240 nm was
used for detection of melamine. The pump and detector were
controlled by the Shimadzu LC solution software. A Nucleodur C18 HPLC column (150 · 4.6 mm I.D., 5 lm particle size)
from Machery–Nagel, Germany was used for chromatographic separation. This was preceded by a Nucleodur guard
cartridge (8 · 4 mm) with the same material of the analytical
column. The mobile phase was consisted of 0.1% (pH 2)
TFA/methanol (90:10) pumped at flow rate of 1 ml/min. All
chromatographic analyses were done at room temperature. A
Multi-Hotplate Stirrer (0–1500 rpm, Witeg, Germany) was
used to stir three sample solutions simultaneously.
Surfactant-enhanced hollow fiber liquid phase microextraction
The extraction was performed using the polypropylene hollow
fiber pieces with the practical length of 2.5 cm. The approximate
internal volumes of these segments were 7 lL. The hollow fiber
segments were sonicated for 2 min in acetone to remove any possible contaminants and then allowed to dry completely in air. 1Octanol was used for both impregnation of the pores and also
filling the lumen of the hollow fiber. Organic solvent was drawn
into the micro-syringe before a hollow fiber affixed onto the tip
of the micro-syringe’s needle, then the hollow fiber immersed
Determination of melamine in soil samples
250000
200000
Peak area
into the organic solvent for 10 s. Subsequently, the syringe plunger was depressed and 1-octanol injected into the lumen of the
hollow fiber. The surface of the hollow fiber was cleaned with
distilled water to remove any residual organic solvent present
on the fiber surface. Then, the prepared fiber was placed in a
sample-vial with 5 ml of sample solution containing 1.5 mM
SDS that its pH was adjusted at 1.9. The sample was stirred with
1500 rpm during the extraction with a magnetic stirrer. After
60 min. extraction time, the analyte enriched 1-octanol was
withdrawn into the syringe and the hollow fiber was discarded.
The analyte enriched 1-octanol was injected into the HPLC and
diluted with mobile phase to 100 lL in the loop.
959
150000
100000
50000
0
1-decanol
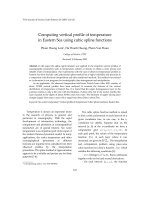
Fig. 1
Results and discussion
Extraction solvent selection
Choosing the most suitable extraction solvent is of primary
importance for achieving good extraction efficiency of the target compounds. Therefore, some factors should be considered,
i.e., the solvent must be immiscible with water, the solubility of
the analytes should be higher in the organic phase than the
donor phase to promote the extraction of the analytes and
the density of the extraction organic solvent must be lower
than water. Five organic solvents were investigated: 1-decanol,
1-octanol, isooctane, toluene and butyl acetate.
A series of sample solutions were studied by using 15.00 mL
of 3 lg mLÀ1 aqueous solution of melamine with adjusted pH
at 3, containing 1 mM SDS. These solutions stirred at 800 rpm
during 20 min extraction time. As shown in Fig. 1 using different organic solvents resulted in different extraction efficiency
and the highest response was obtained when using 1-octanol
as extraction solvent. Therefore, 1-octanol was selected for
subsequent experiments.
Screening by the fractional factorial design
The proposed SE-HF-LPME procedure is depending on several factors. The sequential study of all potential factors is
being too complex and involving a prohibitive long experimental time [36].
Screening is the first step in the efficient assessment of the
factors affecting an analytical system.
Isooctane
Toluene
Butyl
acetate
Organic solvent
Design of experiments
Preliminary, univariate design was used to select the extraction
solvent. In the next step the other parameters which may affect
the surfactant-enhanced hollow fiber liquid phase microextraction procedure including surfactant and salt concentrations,
pH, sample volume, time of extraction and stirring rate were
evaluated. A fractional factorial design with resolution IV
(26À2) was used for this purpose. Afterward, a central composite design was performed to optimize the values of the four significant variables obtained in the fractional factorial design, in
order to improve the response. A 24 central composite design
was performed, with eight star points and six center points,
totaling 30 experiments (24 + (2 · 4) + 6). The value of axial
spacing (a) used was 2. The data were processed using Minitab
16.2.0 software.
1-octanol
Effect of type of extraction solvent on extraction.
Usually, factorial design is employed to reduce the total
number of experiments. The design determines which factors
have important effects on a response as well as how the effect
of one factor varies with the level of the other factors. The
principal steps of the statistically designed experiments are
determination of response variables, factors, factor levels,
choice of the experimental design and statistical analysis of
the data. Today the most widely used kind of experimental
design, to estimate main effect as well as interaction effects,
is the 2n (full) factorial design in which each variable is investigated at two levels [37].
Based on the preliminary experiments carried out in our
laboratory, six factors may affect the experimental response
of the SE-HF-LPME procedure. These factors are surfactant
(S) and salt concentration (I), pH (P), sample volume (V), time
of extraction (T) and stirring rate (R) that evaluated at two
levels.
One of the disadvantages of a full factorial design is that the
number of experimental runs required for estimating all the
main effects and interactions increases rapidly as the number
of factors increases (64 runs in this work) [38].
Consequently, an experimental fractionated factorial design
(26À2) with resolution IV was built for the determination of the
main and interaction factors affecting the extraction efficiency.
In order to evaluate the work, peak area of 3 lg mLÀ1 melamine standard solution in different runs was considered as the
experimental response.
The overall design consisted of 16 experiments and each
experiment was replicated two times. The experiments were
carried out randomly in order to minimize the effect of unexplained variability in the observed responses due to systematic
errors [39]. Design matrix and response are shown in Table 1.
Statistical model
Afterward, in order to determine whether main and two-way
interaction between factors was statistically significant, the
results were statistically analyzed and the main and interaction
effects and other statistical parameters of the fitted model were
determined. The effect of a factor is defined as the change in
response produced by a change in the level of the factor [40]
(two time of its coefficient in the fitted model).
The coefficients, standard error of the coefficients and
effects are shown in Table 2. Where the standard error of
960
Table 1
A. Sarafraz Yazdi et al.
Quarter-fractional design matrix and response of surfactant-enhanced HF-LPME procedure for extraction of melanin.
Experimental number
S (mM)
P
T (min)
V (lL)
R (rpm)
I (w/v%)
Response
1
2
3
4
5
6
7
8
9
10
11
12
13
14
15
16
0.5
7
0.5
7
0.5
7
0.5
7
0.5
7
0.5
7
0.5
7
0.5
7
1
1
6
6
1
1
6
6
1
1
6
6
1
1
6
6
15
15
15
15
60
60
60
60
15
15
15
15
60
60
60
60
4.5
4.5
4.5
4.5
4.5
4.5
4.5
4.5
9.5
9.5
9.5
9.5
9.5
9.5
9.5
9.5
200
1500
1500
200
1500
200
200
1500
200
1500
1500
200
1500
200
200
1500
0
0
6
6
6
6
0
0
6
6
0
0
0
0
6
6
5306
31,485
4331
917
23,797
16,756
11,731
38,445
1446
10,368
7923
13,450
28,467
37,677
2492
14,886
the coefficient is a measure of the variation in estimating the
coefficient and T-value is the ratio of the coefficient to the standard error.
The coefficient of determination (R2) of 99.48% shows a
good fit of the experimental data.
3.71
F
Term
C
Student t-test
A
+
E
Factor: Name
A:Surfactantconcentration
B:Sample pH
C:Extraction time
D:Sample volume
E:Stirring rate
F:Salt concentration
B
AF
Student’s t-test was applied to determine whether calculated
effects were significantly different from zero. The t-value for
a 99% confidence level and 15 degrees of freedom is equal
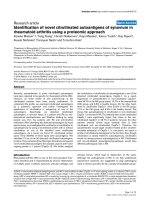
to 3.71. The Pareto chart of standardized effects at
P-value = 0.01 is presented in Fig. 2.
The vertical line on the plot judges the effects that are
statistically significant. The bars, extending beyond the line,
correspond to the effects that are statistically significant at
the 99% confidence level. Furthermore, the positive or negative sign (corresponding to a black or white) response can be
enhanced or reduced, respectively, when passing from the
lowest to the highest level set for the specific factor [41].
Analyzing Fig. 2 infers salt addition was the most significant variable with negative effect, followed by extraction time,
surfactant concentration and stirring rate all with positive
effect and lastly, pH with negative effect. The interaction
between salt and surfactant concentration was important, too.
According to the Pareto diagram sample volume and the
other interaction effects were not statistically significant.
Table 2
BD
DF
D
0
2
4
6
8
10
12
14
16
18
Standardized Effect
Fig. 2 Standardized main and two way interaction effects Pareto
for quarter-fractional factorial design (p-value = 0.01).
Optimization using central composite design
In the following step, a central composite design (CCD)
combined with the desirability function was applied for simultaneous optimization of the four factors (surfactant concentration, sample pH, extraction time and stirring rate) that
influenced the surfactant-enhanced HF-LPME procedure.
Those were chosen from the first screening design. As it is
evident salt addition was neglected in this part, due to its great
Estimated parameters of the polynomial model (coded unit).
Term
Constant
Surfactant concentration
Sample pH
Extraction time
Sample volume
Stirring rate
Salt concentration
Surfactant concentration * salt concentration
Sample volume * salt concentration
Sample pH * sample volume
Effect
Coefficient
Standard error of coefficient
t-value
P-value
9811
À7641
12,378
À2007
8741
À12,436
À7096
À2145
À2161
15,592
4906
À3820
6189
À1004
4370
À6218
À3548
À1072
À1080
360.6
360.6
360.6
360.6
360.6
360.6
360.6
360.6
360.6
360.6
43.24
13.60
À10.6
17.16
À2.78
12.12
À17.24
À9.84
À2.97
À3.00
0.000
0.000
0.000
0.000
0.032
0.000
0.000
0.000
0.025
0.024
Determination of melamine in soil samples
961
negative effect on extraction efficiency. Furthermore, SDS in the
presence of high concentration of salt formed a cloudy state that
would cover the pores in the surface of the hollow fiber and as a
consequence interfere the mass transfer of the analyte.
The factorial design allowed the investigation only of linear
relationships between parameters and response variables
because only two levels were tested [42]. For closer investigation of the factors, the central composite design is an effective
alternative to the factorial design, because five different levels
are examined for each factor. This design originally developed
by Box and Wilson [43] and improved by Box and Hunter [44].
The desirability function is based on the search for a global
optimum [D = f (Y1, Y2, . . ., Yn)] by the transformation of the
measured property to a dimensionless scale for each criterion
[45]. The search for desired goals, achievement of maximum
peak area, was found by mean of the desirability function D.
A rotatable central composite design permitted to be modeled by fitting a second-order polynomial with the number of
experiments equal to (2F + 2F + N), where F is the number
of factor and N is the number of center runs [38]. In this work
F and N were set at 4 and 6, respectively, which meant that 30
(24 + 2 · 4 + 6) experiments had to be run. The 30 experiments were performed in three blocks and in random manner
to minimize the effect of uncontrolled variables on the
response [46].
Eq. (1) was used to calculate axial spacing (a) for a rotatable design [47].
a ¼ ðfÞ1=4
ð1Þ
where f is the number of factorial points in the design.
Using Eq. (1), the axial spacing of a = ±2 was calculated
to satisfy the rotatability of the design. The factors and their
levels used in the CCD and the corresponding design matrix
with three blocks and responses are shown in Tables 3 and
4, respectively.
The mathematical relationship between the response Y and
four significant independent variables, T, S, R and P can be
initially, approximated by a nonlinear polynomial mode
including 4 squared terms, 6 two way factor interaction terms,
4 linear terms and 1 intercept term as shown below:
Y ¼ b0 þ b1 T þ b2 S þ b3 R þ b4 P þ b11 T2 þ b22 S2
þ b33 R2 þ b44 P2 þ b12 TS þ b13 TR þ b14 TP þ b23 SR
þ b24 SP þ b34 RP
ð2Þ
where b0 is the average of the results of the replicated center
point or intercept [48]. b1, b2, b3 and b4 are the main halfeffects of the coded variables including T, S, R and P, respectively; b11, b22, b33 and b44 are squared half-effects; b12, b13, . . .
and b34 are two factor interaction half-effects and Y is the peak
area.
Table 3
Experimental number
Blocks
p
R
S
T
Responsea
1
2
3
4
5
6
7
8
9
10
11
12
13
14
15
16
17
18
19
20
21
22
23
24
25
26
27
28
29
30
1
1
1
1
1
1
1
1
1
1
3
3
3
3
3
3
3
3
3
3
2
2
2
2
2
2
2
2
2
2
1
À1
À1
1
À1
1
1
À1
0
0
À1
1
1
À1
1
À1
À1
1
0
0
À2
2
0
0
0
0
0
0
0
0
À1
1
À1
1
À1
1
À1
1
0
0
À1
1
À1
1
À1
1
À1
1
0
0
0
0
À2
2
0
0
0
0
0
0
À1
À1
1
1
À1
À1
1
1
0
0
À1
À1
1
1
À1
À1
1
1
0
0
0
0
0
0
À2
2
0
0
0
0
À1
À1
À1
À1
1
1
1
1
0
0
À1
À1
À1
À1
1
1
1
1
0
0
0
0
0
0
0
0
À2
2
0
0
292,010
242,930
336,364
241,352
120,464
106,279
127,277
84,372
330,437
280,970
199,963
201,088
410,775
211,396
123,758
135,123
103,092
73,877
376,489
328,081
217,009
335,535
214,043
136,782
274,888
283,852
165,339
32,961
336,228
312,807
a
The mean of two replicates.
Analysis of variance (ANOVA) and estimated response surface
model
In the next step, the regression method was used to find a satisfactory response model with the reasonable statistics
(Table 5).
As shown in Table 5, effects of the linear terms, two-way
factor interactions and squared terms were statistically
significant whereas the blocks were insignificant. As can be
seen in Table 6, the p-value of the lack-of-fit is
p = 0.265 > 0.01 that indicates the fitted model is satisfactory
at a 99% confidence level, on the other hand, the R2 value
indicated that the fitted model explains 92.2% of the variability in the peak area.
The coefficients of the nonlinear polynomial model,
p-values and other statistical parameters were shown in
Table 6.
Factor level used in the central composite design.
Factor notation
S
P
T
R
Table 4 The matrix of the central composite design experiments and the responses.
Model validation
Levels
À2
À1
0
+1
+2
0.5
1
15
200
2.125
2.25
26.25
525
3.75
3.5
37.5
850
5.375
4.75
48.75
1175
7
6
60
1500
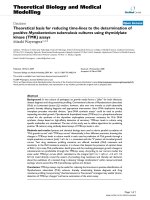
Fig. 3 represents the residual plots for Y (Peak area) in the
model (Table 6). It shows that the distribution of the residuals
for the response approximately follows the fitted normal distribution and the residuals of the response randomly scatter in
the residual plots.
962
Table 5
A. Sarafraz Yazdi et al.
Analysis of variance for central composite design (coded units).
Source
Degree of freedom (d.f.)
Sum of squares
(seq. SS)
Adjusted
sum of squares (adj. SS)
Adjusted
mean squares (adj. MS)
F-value
p-Value
Blocks
Regression
Linear
Square
Interaction
Residual error
Lack of fit
Pure error
Total
2
14
4
4
6
13
10
3
29
1,428,846,610
2.73111 · 1011
1.18134 · 1011
1.30104 · 1011
24,873,337,163
23,257,740,910
20,588,310,013
2,669,430,897
2.97798 · 1011
1,428,846,610
2.73111 · 1011
1.18134 · 1011
1.30104 · 1011
24,873,337,163
23,257,740,910
20,588,310,013
2,669,430,897
714,423,305
19,507,927,136
29,533,492,868
32,525,917,816
4,145,556,194
1,789,056,993
2,058,831,001
889,810,299
0.4
10.90
16.51
18.18
2.32
0.679
0.000
0.000
0.000
0.096
2.31
0.265
Table 6
Estimated regression coefficients of Y (peak area) for central composite design (coded units).
Term
Coefficient
Standard error of coefficient
t-value
P-value
Constant
Block 1
Block 2
T
S
R
P
T·T
S·S
R·R
P·P
T·S
T·R
T·P
S·R
S·P
R·P
327,502
À4939
À4821
15,824
À23,825
7701
À63,600
À16,044
À41,259
À15,269
À60,324
À15,323
5838
À10,402
À19,734
16,713
À22,556
17,268
10,921
10,921
8634
8634
8634
8634
8076
8076
8076
8076
10,574
10,574
10,574
10,574
10,574
10,574
18.966
À0.452
À0.441
1.833
À2.760
0.892
À7.366
À1.987
À5.109
À1.891
À7.469
À1.449
0.552
À0.984
À1.866
1.581
À2.133
0.000
0.659
0.666
0.090
0.016
0.389
0.000
0.068
0.000
0.081
0.000
0.171
0.590
0.343
0.085
0.138
0.053
Normal Probability Plot of the Residuals
Residuals vs. the Fitted Values
99
50000
Residual
Percent
90
50
10
25000
0
-25000
-50000
1
-50000 -25000
0
25000
50000
0
200000
300000
400000
Fitted Value
Histogram of the Residuals
Residuals vs. the Order of the Data
12
50000
Residual
Frequency
100000
Residual
9
6
3
25000
0
-25000
-50000
0
00
00
-6
00
00
-4
00
00
0
-2
0
00
20
0
00
40
0
00
60
2
4
6
8 10 12 14 16 18 20 22 24 26 28 30
Observation Order
Residual
Fig. 3
Residual plots for Y (peak area) in the model.
Determination of melamine in soil samples
New
High
D
Cur
0.91480 Low
T
60.0
[60.0]
15.0
963
S
7.0
[1.50]
0.50
R
1500.0
[1500.0]
200.0
P
6.0
[1.90]
1.0
Composite
Desirability
0.91480
Peak are
Maximum
y = 4.202E+05
d = 0.91480
Fig. 4
The optimization plots for the central composite design.
on signal-to-noise ratio (S/N) of 3 and relative standard deviation (RSD) for the extraction of melamine from 5 ml of
3 lg mLÀ1 aqueous solutions were investigated under optimum
conditions and were 0.01–8 lg mLÀ1, 0.005 lg mLÀ1 and 4.0%
(n = 5), respectively. Calibration equation of y = 155,615
x + 7388 with correlation coefficient (R2) of 0.998 was
obtained by plotting the calibration curve using 8 spiking levels.
mV
a
Fig. 5 Chromatogram of 3 lg mLÀ1 melamine standard solution
obtained after surfactant-enhanced HF-LPME procedure under
optimum conditions.
Response optimization
The optimization plot (Fig. 4) indicates the predicted conditions for the optimum point and the desirability of the prediction. Each individual plot in the figure shows the way each
factor influences the response (peak area). According to the
overall results of the optimization study the following experimental conditions were chosen: extraction time, 60 min; surfactant concentration, 1.5 (mM); stirring rate, 1500 (rpm);
pH, 1.9.
Fig. 5 represents the chromatogram of 3 lg mLÀ1 melamine
standard solution obtained after surfactant-enhanced HFLPME procedure under optimum conditions.
Analytical performance
The figures of merit in the proposed surfactant-enhanced hollow fiber liquid phase microextraction method including
dynamic linear range (DLR), limit of detection (LOD) based
b
Melamine
min
Fig. 6 Chromatograms after surfactant-enhanced HF-LPME
procedure under optimum conditions from (a) soil sample, (b) soil
spiked sample (0.6 mg kgÀ1).
964
Table 7
A. Sarafraz Yazdi et al.
Relative recoveries and relative standard deviations of melamine for three different spiked soil samples.
Sample
Added concentration (mg kgÀ1)
Founded concentration (mg kgÀ1)
RSD (%) (n = 3)
Relative recovery (%)
Kang soil
0
0.1
0.6
–
0.109
0.570
–
5.2
4.5
–
109
95
Zoshk soil
0
0.1
0.6
–
0.102
0.594
–
5
4.3
–
102
99
Shandiz soil
0
0.1
0.6
–
0.095
0.630
–
4.5
4.7
–
95
105
A preconcentration factor of 50 was achieved by considering
the sample volume of 5 mL and the final diluted octanol phase
of 100 lL. The enhancement factor based on the slope ratio of
the calibration curves for the preconcentrated samples and the
ones not submitted to preconcentration was 25.
Real sample analysis
Although field samples are the best choice for analytical works
but in our city, we could not find melamine resin manufacturing factory that would lead to soil contamination in neighbor
lands. So we used spiked soil samples as an alternative. Soil
samples were collected from three villages near Mashhad, Iran.
It was grinded and then sieved using a sieve with mesh number
30.6 g of the sieved soil was mixed completely with 12 mL of
double distilled water in a test tube and spiked with melamine.
The test tube was centrifuged for 10 min at 6000 rpm. After
centrifugation, 7 mL of the supernatant was diluted three times
and its pH adjusted to 1.9 with some drops of 2 M HCl. 5 mL
of the prepared solution was transferred to a sample-vial and
then the required amount of SDS was added to make the final
concentration of 1.5 mM. Finally, the proposed surfactantenhanced HF-LPME was carried out on the sample solution.
Fig. 6 represents the chromatograms obtained from soil sample extracted with and without spiking. The relative recoveries
along with respective relative standard deviation (RSD)%
(n = 3) were calculated to assess sample matrix effects on
extraction efficiency in two concentration levels (0.1 and
0.6 mg kgÀ1). The calculated data were shown in Table 7.
Conclusions
In the present study, surfactant-enhanced HF-LPME method
was used for extraction and determination of melamine. The
effects of different parameters on extraction yield were investigated using a fractional factorial design for screening and a
central composite design for optimization of the significant
factors. This technique represents a simple, easy, free of cross
contamination and inexpensive sample preparation method.
Under optimum condition, it provides low detection limit,
wide linear range and reasonable RSD% for extraction of
melamine. The current HF-LPME technique benefits from
advantageous of miniaturization and also excellent clean up
in complex matrix using hollow fiber membrane [49].
Furthermore, two individual steps of extraction and clean up
can be performed simultaneously. Therefore, the pretreatment
procedure was much easier and faster comparing with the
existing methods of determination of melamine in soil samples
that applied extraction and clean up steps, separately [15,32].
Moreover, the proposed method provides lower detection limit
(0.005 lg mLÀ1) than the other methods reported elsewhere
for melamine determination in soil, e.g. HPLC–UV
(0.05 lg mLÀ1), an enzyme-linked immunosorbent assay
(ELISA) (0.15 lg mLÀ1) and an enzyme-linked rapid colorimetric assay (RCA) (0.2 lg mLÀ1) method [33]. Finally the
optimized procedure was applied successfully for determination of melamine in soil samples with acceptable relative recoveries (95–109%).
Conflict of Interest
The authors have declared no conflict of interest.
Compliance with Ethics Requirements
This article does not contain any studies with human or animal
subjects.
Acknowledgment
The authors gratefully acknowledge the financial support of
this research by Ferdowsi University of Mashhad, Mashhad,
Iran.
References
[1] Updegraff IH, Moore ST, Herbes WF, Roth PB. Amino resins
and plastics. In Kirk-Othmer encyclopedia of chemical
technology. England: Wiley; 1979.
[2] Garber EA. Detection of melamine using commercial enzymelinked immunosorbent assay technology. J Food Protect 2008;
71:590–4.
[3] Andersen WC, Turnipseed SB, Karbiwnyk CM, Clark SB,
Madson MR, Gieseker CM, et al. Determination and
confirmation of melamine residues in catfish, trout, tilapia,
salmon, and shrimp by liquid chromatography with tandem
mass spectrometry. J Agric Food Chem 2008;56:4340–7.
Determination of melamine in soil samples
[4] Mosdell DK, Daniel WH, Freeborg RP. Melamine and
ammeline as nitrogen sources for turfgrasses. Fertil Res
1987;11:79–86.
[5] Arcement BP, Levy HN. III. Liquid chromatographic
determination of triamino-s-triazine in fertilizer mixes:
collaborative study. J Assoc Off Anal Chem 1988;71:611–3.
[6] Bowman DC, Paul JL. Absorption of three slow-release
nitrogen fertilizers by perennial ryegrass turf. Fertil Res 1991;
29:309–16.
[7] Patakioutas G, Savvas D, Matakoulis C, Sakellarides T, Albanis
T. Application and fate of cyromazine in a closed-cycle
hydroponic cultivation of bean (Phaseolus vulgaris L.). J Agric
Food Chem 2007;55:9928–35.
[8] Zhou J, Zhao J, Xue X, Zhang J, Chen F, Li Y, et al.
Hydrophilic
interaction
chromatography/tandem
mass
spectrometry for the determination of melamine in royal jelly
and royal jelly lyophilized powder. J Chromatogr B 2009;
877:4164–70.
[9] Squadrone S, Ferro GL, Marchis D, Mauro C, Palmegiano P,
Amato G, et al. Determination of melamine in feed: validation
of a gas chromatography–mass spectrometry method according
to 2004/882/CE regulation. Food Control 2010;21:714–8.
[10] Newton GL, Utley PR. Melamine as a dietary nitrogen source
for ruminants. J Anim Sci 1978;47:1338–44.
[11] Inque T, Ishiwata H, Yoshihira K, Tanimura A. High
performance liquid chromatographic determination of
melamine extracted from cups made of melamine resin. J
Chromatogr 1985;346:450–2.
[12] Ishiwata H, Inque T, Tanimura A. Migration of melamine and
formaldehyde from tableware made of melamine resin. Food
Addit Contam 1986;3:63–70.
[13] Burrows EP, Brueggeman EE, Hoke SH. Chromatographic
trace analysis of guanidine, substituted guanidines, and striazines in water. J Chromatogr 1984;294:494–8.
[14] Screening information dataset (SIDS) for melamine. UNEP
publications;
1998.
< />OECDSIDS/108781.pdf> [accessed 06.11.13].
[15] Yokley RA, Mayer LC, Rezaaiyan R, Manuli ME, Cheung
MW. Analytical method for the determination of cyromazine
and melamine residues in soil using LC–UV and GC–MSD. J
Agric Food Chem 2000;48:3352–8.
[16] Qin Y, Lv X, Li J, Qi G, Diao Q, Liu G, et al. Assessment of
melamine contamination in crop, soil and water in China and
risks of melamine accumulation in animal tissues and products.
Environ Int 2010;36:446–52.
[17] International experts limit Melamine levels in food. FAO
publication; 2010. < />43719/icode> [accessed 06.11.13].
[18] Han S, Zhu S, Liu Z, Hu L, Parveen S, Xu G. Oligonucleotidestabilized fluorescent silver nanoclusters for turn-on detection of
melamine. Biosens Bioelectron 2012;36:267–70.
[19] Mun˜iz-Valencia R, Ceballos-Magan˜a SG, Rosales-Martinez D,
Gonzalo-Lumbreras R, Santos-Montes A, Cubedo-FernandezTrapiella A, et al. Method development and validation for
melamine and its derivatives in rice concentrates by liquid
chromatography. Application to animal feed samples. Anal
Bioanal Chem 2008;392:523–31.
[20] Sun H, Wang L, Ai L, Liang S, Wu H. A sensitive and validated
method for determination of melamine residue in liquid milk by
reversed phase high performance liquid chromatography with
solid-phase extraction. Food Control 2010;21:686–91.
[21] Zheng XL, Yu BS, Li KX, Dai YN. Determination of melamine
in dairy products by HILIC–UV with NH2 column. Food
Control 2012;23:245–50.
[22] Wu YT, Huang CM, Lin CC, Ho WA, Lin LC, Chiu TF, et al.
Determination of melamine in rat plasma, liver, kidney, spleen,
bladder and brain by liquid chromatography–tandem mass
spectrometry. J Chromatogr A 2009;1216:7595–601.
965
[23] Zhang M, Li S, Yu C, Liu G, Jia J, Lu C, et al. Determination
of melamine and cyanuric acid in human urine by a liquid
chromatography tandem mass spectrometry. J Chromatogr B
2010;878:758–62.
[24] Gpscinny S, Hanot V, Halbardier JF, Michelet JY, Van Loco J.
Rapid analysis of melamine residue in milk, milk products,
bakery goods and flour by ultra-performance liquid
chromatography/tandem mass spectrometry: from food crisis
to accreditation. Food Control 2011;22:226–30.
[25] Xu XM, Ren YP, Zhu Y, Cai ZX, Han JL, Huang BF, et al.
Direct determination of melamine in dairy products by gas
chromatography/mass spectrometry with coupled column
separation. Anal Chim Acta 2009;650:39–43.
[26] Li J, Qi HY, Shi YP. Determination of melamine residues in
milk products by zirconia hollow fiber sorptive microextraction
and gas chromatography–mass spectrometry. J Chromatogr A
2009;1216:5467–71.
[27] Li M, Zhang L, Meng Z, Wang Z, Wu H. Molecularlyimprinted microspheres for selective extraction and
determination of melamine in milk and feed using gas
chromatography–mass spectrometry. J Chromatogr B 2010;
878:2333–8.
[28] Miao H, Fan S, Wu YN, Zhang L, Zhou PP, Chen HJ, et al.
Simultaneous determination of melamine, ammelide, ammeline,
and cyanuric acid in milk and milk products by gas
chromatography–tandem mass spectrometry. Biomed Environ
Sci 2009;22:87–94.
[29] Tzing SH, Ding WH. Determination of melamine and cyanuric
acid in powdered milk using injection-port derivatization and
gas chromatography–tandem mass spectrometry with furan
chemical ionization. J Chromatogr A 2010;1217:6267–73.
[30] Xia J, Zhou N, Liu Y, Chen B, Wu Y, Yao S. Simultaneous
determination of melamine and related compounds by capillary
zone electrophoresis. Food Control 2010;21:912–8.
[31] Liu J, Zhong Y, Liu J, Zhang H, Xi J, Wang J. An enzyme
linked immunosorbent assay for the determination of
cyromazine and melamine residues in animal muscle tissues.
Food Control 2010;21:1482–7.
[32] Ge J, Zhao LW, Liu CY, Jiang S, Lee PW, Liu F. Rapid
determination of melamine in soil and strawberry by liquid
chromatography tandem mass spectrometry. Food Control
2011;22:1629–33.
[33] Tian Y, Chen L, Gao L, Wu M, Dick WA. Comparison of three
methods for detection of melamine in compost and soil. Sci
Total Environ 2012;417–418:255–62.
[34] Breretton RG. Chemometrics, data analysis for the laboratory
and chemical plant. England: John Wiley & Sons Ltd.; 2003.
[35] Venkatasami G, Sowa Jr JR. A rapid, acetonitrile-free, HPLC
method for determination of melamine in infant formula. Anal
Chim Acta 2010;665:227–30.
[36] Jofre´ VP, Assof MV, Fanzone ML, Goicoechea HC, Martı´ nez
LD, Silva MF. Optimization of ultrasound assistedemulsification-dispersive liquid–liquid microextraction by
experimental design methodologies for the determination of
sulfur compounds in wines by gas chromatography–mass
spectrometry. Anal Chim Acta 2010;683:126–35.
[37] Kavak D. Removal of boron from aqueous solutions by batch
adsorption on calcined alunite using experimental design. J
Hazard Mater 2009;163:308–14.
[38] Mousavi M, Noroozian E, Jalali-Heravi M, Mollahosseini A.
Optimization of solid-phase microextraction of volatile phenols
in water by a polyaniline-coated Pt–fiber using experimental
design. Anal Chim Acta 2007;581:71–7.
[39] Ebrahimzadeh H, Asgharinezhad AA, Adlnasab L, Shekari N.
Optimization of ion-pair based hollow fiber liquid phase
microextraction combined with HPLC–UV for the
determination of methimazole in biological samples and
animal feed. J Sep Sci 2012;35:2040–7.
966
[40] Montgomery DC. Design and analysis of experiments. 4th
ed. New York: John Wiley and sons Inc.; 1997.
[41] Ebrahimzadeh H, Yamini Y, Kamarei F. Optimization of
dispersive liquid–liquid microextraction combined with gas
chromatography for the analysis of nitroaromatic compounds
in water. Talanta 2009;79:1472–7.
[42] Ritter JB, Genzel Y, Reichl U. Simultaneous extraction of
several metabolites of energy metabolism and related substances
in mammalian cells: optimization using experimental design.
Anal Biochem 2008;373:349–69.
[43] Box GEP, Wilson KB. On the experimental attainment of
optimum conditions. J R Stat Soc Ser B Methodol 1951;13:1–45.
[44] Box GEP, Hunter JS. Multi-factor experimental designs for
exploring response surfaces. Ann Math Statist 1957;28:195–241.
[45] Clemente M, Hermo MP, Barro´n D, Barbosa J. Confirmatory
and quantitative analysis using experimental design for
the extraction and liquid chromatography–UV, liquid
A. Sarafraz Yazdi et al.
[46]
[47]
[48]
[49]
chromatography–mass
spectrometry
and
liquid
chromatography–mass
spectrometry/mass
spectrometry
determination of quinolones in turkey muscle. J Chromatogr
A 2006;1135:170–8.
Morgan E. Chemometrics: experimental design. London: John
Wiley; 1991.
Minitab statistical software release (Minitab 16.2.0).
Zhang X, Wang R, Yang X, Yu J. Central composite
experimental design applied to the catalytic aromatization of
isophorone to 3,5-xylenol. Chemometr Intell Lab 2007;89:
45–50.
Sarafraz Yazdi A, Raouf Yazdinezhad S, Akhoundzadeh J.
Simultaneous derivatization and extraction of iodine from milk
samples by hollow fiber liquid-phase microextraction followed
by gas chromatography–electron capture detection. J Iran Chem
Soc 2013;10:643–51.