Application of standard models and artificial neural network for missing rainfall estimation
Bạn đang xem bản rút gọn của tài liệu. Xem và tải ngay bản đầy đủ của tài liệu tại đây (384.51 KB, 9 trang )
Int.J.Curr.Microbiol.App.Sci (2019) 8(1): 1564-1572
International Journal of Current Microbiology and Applied Sciences
ISSN: 2319-7706 Volume 8 Number 01 (2019)
Journal homepage:
Original Research Article
/>
Application of Standard Models and Artificial Neural Network for
Missing Rainfall Estimation
Madhuri Dubey1* and M.K. Hardaha2
1
2
Indian Institute of Technology, Kharagpur, West Bengal, India
College of Agricultural Engineering, J.N.K.V.V., Jabalpur, Madhya Pradesh, India
*Corresponding author
ABSTRACT
Keywords
Arithmetic mean
model, Normal ratio
model, Inverse
distance model,
Artificial neural
network
Article Info
Accepted:
12 December 2018
Available Online:
10 January 2019
Precipitation records often suffer from missing data values for certain time periods due to
various reasons, one of them being the malfunctioning of rain gauges. This is an important
issue in practical hydrology as it affects the continuity of rainfall data. The missing data
values ultimately influence the results of hydrologic studies that use rainfall data as one of
the input variables. Therefore, it is crucial to estimate the missing rainfall data for
qualitative hydrologic assessment. In this study, the annual rainfall data of eight districts of
the state Madhya Pradesh, India is collected in the time frame of the year 1901 to 2011.
The collected information is used for estimating missing annual rainfall data. Various
existing standard models, such as arithmetic mean, normal ratio, inverse distance
weighting, multiple linear regression as well as unconventional methods like artificial
neural network (ANN) is used and compared to determine missing rainfall records in the
collected data. The results as obtained show that among the various standard models,
multiple linear regression models perform better. The model is validated and the
correlation coefficient (R), root mean square error (RMSE) and mean absolute error
(MAE) are found to be 0.913, 9017 mm, and 49.7 mm, respectively. When the ANN
model is applied for estimating annual missing rainfall data, it is found that Levenverg
Marquardt (lm) algorithm with 7 neurons and 50-year length of records performs better
than the other combination of algorithms, neurons and length of records. During the
training of this model, the values of R, RMSE and MAE value are found to be 0.998,
4.4x10⁻⁴ mm and 53.047 mm, respectively, and during validation, they are 0.858, 1.667
mm and 49.103 mm, respectively. The results as obtained indicate that the ANN method is
most suitable for estimating the missing annual rainfall data.
Introduction
Precipitation plays a significant role in
agriculture and it is the most important part of
climatological studies (Ayoade, 1983). The
study about precipitation is important due to
various reasons, such as identifying
precipitation characteristics, the occurrence of
temporal and spatial variability, statistical
modeling and forecasting of precipitation, and
resolving the problems due to natural
disasters, such as floods, droughts, landslides,
etc.
1564
Int.J.Curr.Microbiol.App.Sci (2019) 8(1): 1564-1572
For the effective study and analysis of
precipitation, the consistency and continuity
of the rainfall data are very crucial. Both
consistency and continuity may be disturbed
due to change in observational procedure and
incomplete records (missing observations),
which may vary in length ranging from one or
two days to decades of years. The rainfall data
are mainly time series data which are essential
for the hydrological design of various
structures, such as dams and bridges. Any
disruption in the rainfall data may result in the
failure of these structures resulting in major
social and economic loss.
For filling up such disrupted time series data,
existing literature consists of various standard
and advanced techniques, such as arithmetic
method, inverse distance weighting, normal
ratio method, multiple linear regression,
spatial interpolation methods, integrating
surface
interpolation
techniques
and
spatiotemporal association rules based
methods techniques (Teegavarapu, 2009; Kim
and Pachepsky, 2010; Nkuna and Odiyo,
2011; Kajornrit et al., 2011; Piazza et al.,
2011; Chen and Liu, 2012).
Kim and Pachepsky (2010) used regression
tree with artificial neural network for infilling
daily precipitation data for Soil and Water
Assessment Tool (SWAT) streamflow
simulation. Four methods local mean, normal
ratio, inverse distance, and aerial ratio
precipitation method were compared by Silva
et al., (2007) for estimating monthly missing
rainfall for the different agro-ecological zone
of the Sri Lanka, and they found that different
methods are suitable for different regions.
Piazza et al., (2011) compared different
techniques, such as inverse distance
weighting, simple linear regression, multiple
regressions,
geographically
weighted
regression, artificial neural networks, and
geostatistical models, such as ordinary kriging
and residual ordinary kriging for spatial
interpolation of rainfall data to create a
serially complete monthly time series of
precipitation for Sicily, Italy. The results
reveal that residuals ordinary kriging perform
best at monthly and annual scale to complete
monthly time series. Artificial neural network
method is also successfully used by
researchers in many scientific and engineering
disciplines since they are capable of
correlating large and complex multiparameter dataset without any prior
knowledge of the relationship between the
parameters. Applications of different types of
artificial neural network were shown by many
researchers for estimation of missing rainfall
data (Bustami et al., 2007; Nkuna and Odiyo
2011; Nourani et al., 2012; Terzi and Cevik
2012).
The suitability of different methods may vary
from one region to another as it is utilized by
many investigators in different places of the
world (references). Hence, the aim of this
study is to estimate missing annual rainfall
data using different models such as arithmetic
mean model (AMM), normal ratio model
(NRM), inverse distance model (IDM),
multiple linear regression model (MLR) and
artificial neural network (ANN).
In this study, the annual rainfall data of eight
districts of the state Madhya Pradesh, India is
collected in the time frame of the year 1901 to
2011. The eight districts are Mandla, Seoni,
Narsinghpur, Damoh, Umaria, Dindori, Katni,
Jabalpur. The complete rainfall data is used to
estimate the missing rainfall of one of the
district, viz. Jabalpur district. The remaining
seven districts were selected because of their
similar climatology with the Jabalpur district.
This study will produce reliable missing
rainfall data that may be ultimately used in
hydrological modeling and water resources
planning and management.
1565
Int.J.Curr.Microbiol.App.Sci (2019) 8(1): 1564-1572
The various models applied for the study are
the arithmetic mean, normal ratio, inverse
distance, multiple linear regression, and
ANN, and are briefly explained below:
Materials and Methods
Study area and data used
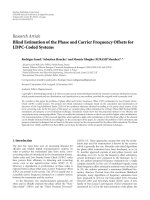
For the study, eight districts of the Madhya
Pradesh situated at the central part of the
India, is selected, as shown in Figure 1. The
Madhya Pradesh has a subtropical climate
with extreme summer and winter seasons
indicating high variability, as well as high
variability in rainfall with either extreme rain
or drought. The average annual rainfall of this
state is around 1370 mm. The south-eastern
districts of the state mostly receive heavy
rainfall. The state receives maximum rainfall
as 2150 mm and minimum as 1000 mm, and
its magnitude decreases from east to west.
The annual rainfalls of all the state districts
range from 1038 mm to 1245 mm.
The rainfall data of the selected eight districts
of Madhya Pradesh, viz. Jabalpur, Katni,
Narsinghpur, Seoni, Mandla, Damoh, Umaria,
and Dindori for the period of 110 years
(January 1901 to December 2011, excluding
2003) have been collected from the secondary
data sources, such as India Water Portal and
India Meteorology Department, Pune. The
rainfall data of Jabalpur district is assumed to
be missing and is to be estimated by using the
rainfall data of the surrounding districts.
Standard models and ANN is developed for
the estimation of annual missing rainfall data
of Jabalpur district. Out of 110 years length
record of the rainfall, 70 years of data is used
for calibration and 40 years data is used for
validation of the developed model.
Models for estimating missing rainfall data
In the present study, the standard models and
ANN have been used for estimating missing
annual rainfall of Jabalpur district based on
the rainfall data of surrounding seven
districts, viz. Mandla, Katni, Seoni,
Narsinghpur, Damoh, Dindori, and Umaria.
Arithmetic mean model
Arithmetic mean model is used to estimate the
missing observation of station X, if normal
annual precipitations at surrounding gauges
vary within the range of 10% of the normal
annual precipitation (Chow et al., 1988). This
model is given by Eq. (1):
(1)
Normal ratio model
Normal ratio model is used if any surrounding
gauges have the normal annual precipitation
exceeding 10% of the considered gauge. The
missing data are estimated by Eq. (2).
(2)
Inverse distance model
In this model, the weight for each sample is
inversely proportionate to its distance from
the point being estimated and is given in Eq.
(3).
(3)
Where R x is rainfall missing data at station
X, and R1, R2, and Rn are rainfall at the
station 1, 2 and n, respectively. Nx, N1, N2,
and Nn are normal annual precipitation at the
station X, 1, 2 and n, respectively. M is a
number of stations and d is the distance
between station (where data is missing) and
surrounding stations.
1566
Int.J.Curr.Microbiol.App.Sci (2019) 8(1): 1564-1572
Regression analysis is used for explaining or
modeling the relationship between a single
variable y, called the response, output or
dependent variable, and one or more
predictor, input, independent or explanatory
variables, x1…......xn. When the number of
predictor variables, n = 1, it is called simple
regression, but when n > 1, it is called
multiple regression or sometimes multivariate
regression. Assume that two precipitation
gauges y and x have long records of annual
precipitation, i.e. y 1, y2,…y n and x1, x2,…
x n. The precipitation yt is missing and x and
y are sample means. The missing data can be
filled in based on a simple linear regression
model. The model can be written as in Eq (4):
and the number of neurons which performed
best is considered for further improvement of
the ANN model. Thereafter, the model is
trained by the various length of a years (30,
50 and 70) for checking the sensitivity of the
ANN model to the size of training data. Mean
and standard deviation (mapstd) function is
used for scaling all input and target data.
Initially, 5 numbers of neurons are included in
the single hidden layer of the model. The
objective of training the model is to achieve
the minimum mean error between estimated
and targeted rainfall. The neural network
utility file is edited in highly efficient
computer programming software, MATLAB
Version 6.5. The input data source file,
network option, training function, setting for
the data for training, validation, plotting the
predicting values and saving the network is
created and run in the software.
(4)
Where a and b are regression coefficients.
Model comparison
Multiple linear regression model
Artificial Neural Network (ANN)
The feed-forward neural network is selected
for the analysis, wherein the input data
(rainfall at surrounding stations) are fed into
the nodes which pass the hidden nodes after
getting multiplied by the weight. The hidden
layer neurons are selected using trial and error
procedure. The output neurons of the ANN
provide the missing value at the stations other
than the station of interest. The rainfall data of
the selected Jabalpur district station for the
period of 1901-1971 and 1971-2011 is used
for training and validation purpose. For
developing ANN model for estimation of
missing annual rainfall, initially, the model is
trained with 12 training algorithm, 5 neurons
and 30-year length of the record. The training
algorithm, which performed best, has been
considered for further refinement of the
model with a varying number of neurons and
varying length of data set. Neurons in the
hidden layer have been varied from 1 to 10,
The performance of all the applied models is
evaluated by three effective performance
measures, viz. Root Mean Squared Error
(RMSE), Mean Absolute Error (MAE) and
Correlation coefficient (R). R measures the
degree to which two variables are linearly
related. RMSE and MAE provided a balanced
perspective of the goodness of fit as moderate
output values (Karunanithi et al., 1994).
Results and Discussion
Performance of standard models
The derived mathematical forms of normal
ratio model, inverse distance model, and
multiple linear regression models for
determining the missing rainfall, are given by
Eq. (5), (6) and (7), respectively.
1567
(5)
Int.J.Curr.Microbiol.App.Sci (2019) 8(1): 1564-1572
(6)
(7)
Where, PX, PM, PS, PN, PDA, PK, PU and PDI are
the annual rainfall (mm) at the eight districts,
viz. Jabalpur, Mandla, Seoni, Narsinghpur,
Damoh, Katni, Umaria, and Dinori,
respectively.
Performance of these models for training and
validation is summarized in Table 1. The
results showed that MLR performed better
over the AMM, NRM, and IDW, as it has a
lower value of RMSE and MAE for both
training and validation. Figure 2 represents
the scatter plot of observed and estimated
rainfall for the applied standard models. It is
observed from the Figure 2 that the estimated
rainfall is more closely related to observed
rainfall in case of MLR model as compared to
the other models.
The performance of the standard models were
in following order MLR>IDM>AMM>NRM.
These results are supported by Sattari et al.,
(2017) in which multiple linear regressions
were proved to be the best among the inverse
distance, normal ratio, single estimator and
non-linear iterative partial least squares
algorithm models. However, inverse distance,
normal ratio, and arithmetic mean method is
also found to be efficient to capture missing
rainfall data in Sri Lanka (Silva et al., 2007).
Performance of artificial neural network
Performance of the ANN model, developed
with different training algorithms during
model training and validation, are shown in
Table 2. Model with Levenverg-Marquardt
algorithm performed best as it has a lower
value of RMSE and MAE than other models
trained by a different algorithm. By critical
evaluation of the performance indicators, it
can be stated that the ANN model trained
with “trainlm” training algorithm performed
better than the other models trained by other
algorithms. The Model with “trainlm”
algorithm was further optimized for
calculating the optimal number of neurons in
the hidden layer.
The ANN model with learning function
“trainlm” of normalization function “mapstd”
with 30 years data set has been trained with 1
to 10 numbers of neurons and evaluated for
an optimum number of neurons. Performance
of ANN model developed with a different
number of neurons during model training and
its validation are shown in Table 3. From the
Table 3, it is found that the performance of
the ANN model is the best with 7 neurons and
it is further refined for a different length of
data set.
The performance of the ANN model
developed with various lengths of data is
shown in Table 4. From the Table 4, it is
observed that the model with L=70 performed
better than other ANN models. ANN model
with “trainlm” learning function, 7 neurons
and trained with 50-year data set for
estimation of missing rainfall of annual
rainfall of Jabalpur district is better than other
combination of algorithm, a number of
neurons and length of records. It has the
lowest RMSE and MAE as 4.109 mm and
3.286 mm, respectively during training and
86.254 mm and 49.103 mm, respectively
during the validation of the model.
Furthermore, it showed good R-value during
training and validation which is 0.999 and
0.913, respectively.
Figure 3 represents the comparison of
estimated and observed rainfall with the
selected combination of ANN model for 50
years of training and 40 years of validation
period.
1568
Int.J.Curr.Microbiol.App.Sci (2019) 8(1): 1564-1572
Table.1 Performance of Standard models for annual rainfall for validation
Indicators
R
RMSE
(mm)
MAE (mm)
AMM
0.92
85.40
Training
IDM
NRM
0.94
0.95
80.40 185.50
MLR
0.97
80.40
52.60
47.60
40.40
175.20
AMM
0.90
101.90
Validation
IDM
NRM
0.91
0.90
97.60 213.30
MLR
0.91
94.00
62.50
58.50
49.70
187.50
Table.2 Performance of ANN model with various training algorithm for annual rainfall
Algorithm
trainlm
traingd
traingdm
traingda
traingdx
traincgf
traincgp
traincgb
trainscg
trainbfg
trainoss
trainrp
R
trg
0.99
0.98
0.96
0.96
0.98
0.94
0.92
0.98
0.98
0.99
0.98
0.96
val
0.917
0.886
0.872
0.797
0.858
0.872
0.825
0.912
0.875
0.895
0.882
0.861
RMSE
(mm)
trg
val
6.55
93.69
38.65 113.35
62.97 115.46
82.08 140.25
39.54 127.71
82.51 118.95
105.16 137.25
47.04
99.68
52.95 114.64
33.36 105.49
40.05 113.27
69.16 119.15
MAE
(mm)
trg
5.18
31.94
48.81
68.79
31,94
65.99
85.48
36.49
35.72
26.34
29.55
53.36
val
52.31
76.79
83.73
103.27
79.50
76.68
110.40
66.36
76.24
63.03
68.68
87.73
Table.3 Performance of ANN model with different number of neurons for annual rainfall
S.N.
1.
2.
3.
4.
5.
6.
7.
9.
10.
Number
of
Neurons
N1
N2
N3
N4
N5
N6
N7
N9
N10
R
trg
0.974
0.979
0.990
0.983
0.991
0.989
0.997
0.993
0.992
val
0.830
0.830
0.923
0.902
0.917
0.910
0.807
0.919
0.889
1569
RMSE
(mm)
trg
val
96.63 121.89
94.10 132.40
19.16
91.20
6.89
102.50
6.55
93.60
9.99
92.41
5.20
89.01
9.02
98.84
48.40 114.70
MAE
(mm)
trg
66.63
75.60
15.20
4.34
5.18
8.25
3.62
6.08
41.40
val
99.82
106.00
58.44
59.13
51.98
54.38
51.63
58.37
79.47
Int.J.Curr.Microbiol.App.Sci (2019) 8(1): 1564-1572
Table.4 Performance of ANN model with varying length of record for annual rainfall
S.N.
1.
2.
3.
Length of
Records (L)
L-30
L-50
L-70
R
Trg
0.997
0.999
0.998
val
0.807
0.913
0.858
RMSE (mm)
trg
val
5.20
89.01
4.10
86.25
7.85
104.26
MAE (mm)
trg
val
3.62 51.63
3.28 49.10
6.12 53.04
Fig.1 Index map of Madhya Pradesh showing selected districts
Fig.2 Relationship between observed and estimated rainfall given by arithmetic mean model and
normal ratio model inverse distance model and multiple linear regression models for Annual
rainfall
1570
Int.J.Curr.Microbiol.App.Sci (2019) 8(1): 1564-1572
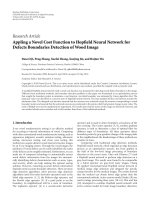
Fig.3 Rainfall graph showing estimated and observed rainfall, N=7, (training with 50 year data)
for annual rainfall
It is depicted from Figure 3 that in most of the
years, the estimated value of rainfall matches
with the observed value. The similar outcome
was found in the study conducted by Ghuge and
Regulwar (2013) in Maharashtra, India where
ANN was effectively used for estimating
missing rainfall in Maharashtra.
Comparison of standard and ANN models
From the used standard model MLR performed
slightly well compared to other standard
models. Further comparison with the developed
ANN model showed that ANN is more effective
than the standard models. From Tables 1 and 4,
it can be concluded that ANN has a higher
capability of prediction. By comparing the
statistics obtained from standard models with
the best ANN combination, it can be concluded
that ANN has the lowest RMSE, MAE and
higher R-value for estimating missing rainfall at
the Jabalpur district.
In conclusion, rainfall continuity and
consistency are the two keys of viable
hydrological analysis and design of the
hydrological structure. Maintaining their
continuity is important by estimating the
missing rainfall data. Therefore, in this study,
the missing annual rainfall of Jabalpur district is
estimated using four standard models, viz. AM,
NRM, IDW and MLR, and advance model,
ANN. ANN models were optimized in respect
of learning algorithm, number of neurons and
length of data set used for training. These
models have been compared based on the
various performance indicators. Both standard
models and ANN model have the ability to
estimate the missing rainfall data. However, in
the case of the standard model, MLR performed
best over the other standard models with lowest
RMSE and MAE values and with highest Rvalue. In the case of ANN, the model developed
with the Levenverg Marquardt algorithm, 50year length of record performed well with 5
neurons as it showed the lowest error with
higher R-value. In addition, it is evident from
performance indicators that the standard models
show greater errors as compared to the ANN
model. Hence, it may be concluded that the
ANN model is a most effective method for
estimating the missing annual rainfall data. This
study can be further extended for the estimation
of monthly and daily missing rainfall data.
References
Ayoade, J.O. 1983. Introduction to Climatology
for the Tropics. John Wiley and Sons:
New York.
Bustami, R., Bessaih, N., Bong, C., and Suhaili,
S. 2007. Artificial Neural Network for
1571
Int.J.Curr.Microbiol.App.Sci (2019) 8(1): 1564-1572
Precipitation and Water Level Predictions
of Bedup River. IAENG International
Journal of computer science, 34(2).
Chen, F-W, and Liu C-W 2012. Estimation of
the spatial rainfall distribution using
inverse distance weighting (IDW) in the
middle of Taiwan. Paddy and Water
Environment,
10(3),
209–222.
doi:10.1007/s10333-012-0319-1.
Chow, V.T., Maidment, D.R. and Mays, L.W.
1988. Applied hydrology, McGraw Hill
Book Company, ISBN 0-07-010810-2.
Ghuge, H.K., and Regulwar, D.G. 2013.
Artificial neural network method for
estimation of missing data. International
Journal of Advanced Technology in Civil
Engineering, 2, 1-4.
Kajornrit, J., Wong, K.W., and Fung, C.C.
2011. Estimation of missing rainfall data
in northeast region of Thailand using
spatial interpolation methods. Australian
Journal of Intelligent Information
Processing Systems, 13(1).
Karunanithi, N.G., Whitley, D. and Bovee,
K.1994. Neural network for river flow
prediction. ASCE J. Comp. Civil Engg.
8(2), 201-220.
Kim, J.W., and Pachepsky, Y.A. 2010.
Reconstructing
missing
daily
precipitation data using regression trees
and artificial neural networks for SWAT
streamflow
simulation. Journal
of
hydrology, 394(3-4), 305-314.
Nkuna, T.R., and Odiyo, J.O. 2011. Filling of
missing rainfall data in Luvuvhu River
Catchment
using
artificial
neural
networks. Physics and Chemistry of the
Earth, Parts A/B/C, 36(14-15), 830–835.
doi:10.1016/j.pce.2011.07.041.
Nourani, V. 2012. Investigating the Ability of
Artificial Neural Network (ANN) Models
to Estimate Missing Rain-gauge Data.
Journal of Environmental Informatics,
19(1), 38–50. doi:10.3808/jei.201200207.
Piazza, A., Conti, F.L., Noto, L.V., Viola, F.,
and La Loggia, G. 2011. Comparative
analysis of different techniques for spatial
interpolation of rainfall data to create a
serially complete monthly time series of
precipitation
for
Sicily,
Italy.
International Journal of Applied Earth
Observation and Geoinformation, 13(3),
396–408.doi:10.1016/j.jag.2011.01.005.
Sattari, M.T., Rezazadeh-Joudi, A., and
Kusiak, A. 2017. Assessment of different
methods for estimation of missing data in
precipitation
studies. Hydrology
Research, 48(4),
1032-1044.
/>Silva, R.P., Dayawansa, N.D.K, and Ratnasiri,
M.D. 2007. A comparison of methods
used in estimating missing rainfall data.
Journal of Agricultural Sciences, 3(2),
101. doi:10.4038/jas.v3i2.8107.
Teegavarapu, R.S.V. 2009. Estimation of
missing precipitation records integrating
surface interpolation techniques and
spatio-temporal association rules. Journal
of Hydroinformatics, 11(2), 133–146.
doi:10.2166/hydro.2009.009.
Zhang, M., Fulcher, J., and Scofield, R.A. 1997.
Rainfall estimation using artificial neural
network group. Neurocomputing, 16(2),
97–115.
doi:10.1016/s09252312(96)00022-7.
How to cite this article:
Madhuri Dubey and Hardaha, M.K. 2019. Application of Standard Models and Artificial Neural
Network for Missing Rainfall Estimation. Int.J.Curr.Microbiol.App.Sci. 8(01): 1564-1572.
doi: />
1572