Calculating the carbon footprint of rice production in Vietnam and formulating a proposal for mitigation options
Bạn đang xem bản rút gọn của tài liệu. Xem và tải ngay bản đầy đủ của tài liệu tại đây (1003.97 KB, 6 trang )
Environmental Sciences | Climatology
Doi: 10.31276/VJSTE.61(2).84-89
Calculating the carbon footprint of rice production in Vietnam
and formulating a proposal for mitigation options
Dao Minh Trang1, Huynh Thi Lan Huong1*, Mai Van Trinh2
Vietnam Institute of Meteorology, Hydrology and Climate Change
Institute for Agricultural Environment, Vietnam Academy of Agricultural Sciences
1
2
Received 15 March 2019; accepted 28 May 2019
Abstract:
This study aims to develop a method for calculating the carbon footprint of rice during its life cycle by combining
Life Cycle Assessment (LCA) and the 2006 Guideline of the Intergovernmental Panel on Climate Change (IPCC)
for National Greenhouse Gas Inventories (GL 2006) for paddy rice grown in Phu Luong commune, Dong Hung
district, Thai Binh province, Vietnam. In the course of the study, a LCA survey that included activities in the
upstream processes, the agricultural process, and the post-farm stage was conducted based on interviews with
three groups of 30 farmer households that apply the conventional practice of rice production, the system of rice
intensification (SRI), or the wide-narrow row method. These cultivation practices are applied for both the winterspring crop and summer-autumn crop seasons. The emissions were calculated by multiplying the activity data
by the default emission factors in GL 2006 or in other relevant studies. The emission factors of methane (CH4)
from rice cultivation and nitrous oxide (N2O) from agricultural soil were adjusted using actual measurement
results from the Institute of Agricultural Environment (IAE) in 2016. The results of the calculations show that
the main sources of the emissions that constitute the carbon footprint of rice include: (i) CH4 emissions from
rice cultivation; (ii) electricity generation for irrigation; (iii) diesel combustion for the operation of agricultural
machinery, and (iv) fertiliser production. Emissions from other activities were negligible. The carbon footprint
of spring rice is 2.69 kgCO2e/kg of rice grown using the conventional paddy cultivation method, 2.35 kgCO2e/
kg for rice grown using the SRI method, and 2.29 kgCO2e/kg for rice grown using the wide-narrow row method.
In summer, the carbon footprint for rice grown using the conventional method is 3.72 kgCO2e/kg of rice, 3.56
kgCO2e/kg of rice using SRI, and 3.3 kgCO2e/kg of rice using the wide-narrow row method. Three mitigation
options are proposed: integrated crop management for rice; alternate wetting and drying; and the substitution of
urea fertiliser (CO(NH2)2) with ammonium sulphate ((NH4)2SO4).
Keywords: carbon footprint, greenhouse gas, LCA, mitigation, rice.
Classification number: 5.2
Introduction
The term carbon footprint is defined as “the quantity
of GHGs (greenhouse gases) expressed in terms of CO2e,
emitted into the atmosphere by an individual, organization,
process, product, or event from within a specified
boundary” [1]. The scope of a carbon footprint depends on
the range of activities to be taken into account, including
Tier 1 (on-site emissions), Tier 2 (emissions embodied in
purchased energy), and Tier 3 (all other indirect emissions
not covered under Tier 2) [2, 3]. The choice of direct or
indirect emissions is incompatible across the different
studies. In most cases, including all indirect emissions in
the calculation is very complex; therefore, many studies of
carbon footprints calculate only direct emissions or indirect
emissions at Tier 2 but not include indirect emissions at Tier
3. However, indirect emissions may account for the majority
of the carbon footprints of many activities and products.
Carbon-footprint calculations can be undertaken based
on a product-based approach or an activity-based approach,
that is, GHG emissions from the activities of individuals,
groups, or organisations. The carbon footprints of activities
are the annual GHG emission inventories of individuals,
* Corresponding author: Email:
84
Vietnam Journal of Science,
Technology and Engineering
JUne 2019 • Vol.61 Number 2
Environmental Sciences | Climatology
groups, organisations, companies, and governments.
National GHG inventories are based on emissions from
activities within the territories of countries. This means
that production, transport, and other activities occurring
in countries, such as international transport and emissions
from imported products, are excluded. However, the product
carbon footprint (PCF) refers to the LCA of the whole or part
of the product or the service life cycle; this means that all
GHG emissions from every activity involved in providing
a product or service to consumers should be included.
This is the more comprehensive and fairer approach, since
consumers would be made “responsible” for emissions. For
example, in this study, the GHG emissions from imported
fertiliser or pesticides that are used in rice cultivation
must become part of the life-cycle analysis, though such
emissions should not be included in the national inventory.
One of the guidelines for calculating GHG emissions
using the activity-based approach is the GL 2006 of the
Intergovernmental Panel on Climate Change (IPCC). Since
2009, government agencies and international organisations
have made significant strides in developing standards and
guidelines for calculating PCFs [4]. At present, three PCF
calculation guidelines are universally accepted: PAS 2050
of the British Standards Institute [2], the GHG Protocol
of the World Resources Institute and the World Business
Council for Sustainable Development [1], and ISO 14067
[5]. All these standards are based on the LCA method
specified in ISO 14040 and ISO 14044. Apart from those
of the IPCC, most publications on LCA in Vietnam are also
based on the Vietnamese Standard TCVN ISO 14040:2009
on environmental management, life-cycle assessment, and
principles and framework. In 2017, the Food and Agriculture
Organization (FAO) developed guidelines for calculating
GHG emissions from major agricultural products such as
corn, wheat, barley, cassava, and soybeans [6].
Study area
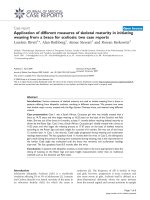
Phu Luong commune is located in the northwest of Dong
Hung district in Thai Binh province (Fig. 1). It comprises
4.77 km2. Most rural households in Phu Luong commune
depend on agriculture. It includes five villages: Duyen
Tuc, Duyen Giang, Duyen Phu, Duyen Trang Dong, and
Duyen Trang Tay. In 2017, Phu Luong commune had 2,608
households with 8,202 inhabitants [7].
According to IAE (2016) [7], Phu Luong has a total
planted paddy rice area of 299.04 ha; the winter crop covers
137.9 ha; the spring, summer, and autumn cereals cover
23.25 ha. The spring rice yield reaches 7.3 tons/ha, and the
summer yield reaches 6.3 tons/ha.
Fig. 1. Geographical location of Phu Luong commune.
Material and methodology
Data collection
Activity data such as cultivated land area, crop variety,
the growth duration of rice, the capacity and frequency of
the use of agricultural machinery, the amount of fertiliser
and pesticide used, crop productivity, and the method
used to treat straw (burying or burning) are taken from
the results of interviews with 90 farmer households in Phu
Luong commune. Three types of cultivation are used: the
conventional one, the wide-narrow row method, and the
system of rice intensification (SRI) for the spring and season
crops. Emission factors are taken from GL 2006 [8], FAO
[6], and other relevant studies.
JUne 2019 • Vol.61 Number 2
Vietnam Journal of Science,
Technology and Engineering
85
Environmental Sciences | Climatology
Methodology
Table 1. Summary of formulas used to compute the carbon
intensification (SRI) for the spring and season crops. Emission factors are takenfootprint of rice.
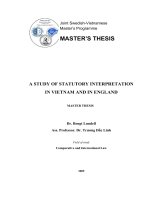
The methodology of this study is based on combining
LCA and GL 2006 [8] and other studies (Fig. 2).
from GL (2006) [8], FAO [6], and other relevant studies.
Stage
Activity
Source
Tier
Upstream
processes
1. Electricity generation for
the operation of agricultural
machinery
Formula 2.1, Vol. 2, GL
2006 [8], p.2.11
Tier 2
2. Fertiliser production
FAO [6], p.13
Tier 1
3. Lime production
Formula 2.8, Vol. 3,
GL2006 [8] p.2.22
Tier 1
4. Pesticide production
FAO [6], p.13
Tier 1
5. Methane emissions from
rice cultivation
Formula 5.1, Vol. 4, GL
2006 [8], p.5.45
Tier 2
6. Diesel combustion for
the operation of agricultural
machinery
Formula 2.1, Vol. 2, GL
2006 [8], p.2.11
Tier 1
7. Lime application
Formula 11.12, GL
2006 [8], p. 11.27
Tier 1
8. CO2 emissions from urea
application
Formula 11.12, GL
2006 [8], p.11.27
Tier 1
9.1. Direct N2O emissions
from agricultural soil
Formula 11.1, Vol. 4,
GL 2006 [8]
Tier 2
9.2 N2O indirect emission
from agricultural soil
Formula 11.9, Vol. 4,
GL 2006 [8]
Tier 1
Seeds, feriliser
[8] and other studies (Fig.
2).
pesticides,
electricty
Rice
production
Fig. 2. Methodology for the calculation of the carbon footprint
for rice.
Fig. 2. Methodology for the calculation of the carbon footprint for rice.
The procedure for calculating the carbon footprint for
The procedure
calculating the carbon footprint for rice involves five
rice involves
fivefor
steps:
Post-farm
10. Transport rice from farms
soil
to agricultural
houses
Computer programme
Tier 1
[8]
to calculate2006
emissions
Computer programme to Tier 1
from road transport
calculate
(COPERT 4)
of the emissions from
10. Transport rice from farms to houses
European road transport (COPERT
steps:
Step 1: select the GHGs in terms of the regulations of
Step 1: select
the GHGs
in terms ofCO
the regulations
the Kyoto
the Kyoto
Protocol,
including
, nitrous ofoxide
(N2Protocol,
O),
2
including
CO2, nitrous
and methane
(CH4oxide
). (N2O), and methane (CH4).
FAO [6], Nemecek and
Kagi [9]
Post-farm 11. On-site straw burning
11. On-site straw burning
4) ofGL
the2006
European Tier 1
Formula 2.27,
[8], p.2.42 Formula 2.27, GL 2006 Tier 1
[8],2009
p.2.42
Gadde, et al.
[10]
Step 2:
2: determine
the the
scope
of theofcalculation:
GHG emissions
Step
determine
scope
the calculation:
GHGfrom
Gadde, et al. 2009 [10]
upstream
processes
(electricity
generation
and
the
production
of
fertiliser,
emissions from upstream processes (electricity generationlime, Calculating the carbon footprint:
andpesticides);
the production
of fertiliser,
lime, anddiesel
pesticides);
and
rice production
(rice cultivation,
combustionrice
for the The Calculating
the carbonpotential
footprint (GWP) of all tiers is
global warming
production
(rice cultivation,
combustion
for and
thelime),calculated
individually using the IPCC’s conversion factor.
operation
of agricultural
machinery, anddiesel
the application
of fertiliser
The global warming potential (GWP) of all tiers is calculated individually
to the IPCC’s Fifth Assessment Report (AR5)
operation of agricultural machinery, and the application According
using the IPCC‟s conversion factor. According to the IPCC‟s Fifth Assessment
[11],
the
GWP
value of CH4 is 28 and that of N2O is 265.
5
of fertiliser and lime), and the post-production of rice
Report (AR5) [11], the GWP value
of CH is 28 and that of N O is 265. The
The
formula
for
calculating the GWP4of tieri (i = 1, 2, 2or 3)
(transporting rice from farms to households and on-site
formula
for
calculating
the
GWP
of
tier
i (i = 1, 2, or 3) is as follows:
is as follows:
straw burning).
= emission/removal of CH4 x 28 + emission/removal of N2O
) =i)emission/removal
of CH4 x 28 + emission/
GWPGWP
(tier(tier
i
Step 3: collect activity data.
x
265
+
emission/removal
CO2
removal of N2O x 265 + ofemission/removal
of CO2
Activity data were collected by means of questionnaires where
where
GWPis
is measured
measured in kg
GWP
in CO
kg2e/ha.
CO2e/ha.
provided to 90 farmer households in Phu Luong commune.
The carbon footprint is calculated by summing the GWP of all tiers; its
The carbon footprint is calculated by summing the GWP
The households interviewed were selected based on
value
can be
as spatial
or yield-scaled
carbon footprints,
of all
tiers;
itspresented
value can
be presented
as spatial
or yield-which are
stratified random sampling.
calculated
as follows:
scaled
carbon
footprints, which are calculated as follows:
Step 4: calculate the carbon footprint.
Calculation of GHG emissions/removals:
Table 1 presents the formulas used for the calculation in
the study.
∑[
]
where CFs is the spatial carbon footprint (kg CO2e/ha) and CFy is the yieldscaled carbon footprint (kg CO2e/yield).
86
Vietnam Journal of Science,
Technology and Engineering
JUne 2019 • Vol.61 Number 2
This study uses the carbon footprint by both yield and spatial unit, that is,
kg CO2e/kg rice and kg CO2e/ha.
7
Environmental Sciences | Climatology
where CFs is the spatial carbon footprint (kg CO2e/ha) and
CFy is the yield-scaled carbon footprint (kg CO2e/yield).
This study uses the carbon footprint by both yield and
spatial unit, that is, kg CO2e/kg rice and kg CO2e/ha.
Step 5: analysis of uncertainty (optional).
Uncertainty regarding the results of the calculation
usually stems from uncertainty regarding the model and of
the data. The results of GHG-emission calculations cannot
avoid uncertainty.
Results and discussion
The GHG emissions for each activity in life cycle of rice
in the spring and summer seasons are presented in Table 2.
It can be seen from Table 2 that the carbon footprint of
spring rice is 2.69 kg CO2e/kg of rice for the conventional
practice, 2.35 kg CO2e/kg of rice for the SRI method, and
2.29 kg CO2e/kg of rice for the wide-narrow row method.
In the summer season, the carbon footprint of rice is 3.72
kg CO2e/kg of rice for thee conventional practice, 3.56 kg
Table 2. Carbon footprint of rice in Phu Luong commune.
GHG emissions (kg CO2e/ha)
No.
Sources of GHG emissions
GHG
Spring rice
Summer rice
Conventional
SRI
Wide-narrow row
Conventional
SRI
Wide-narrow row
3,143.10
3,143.09
3,143.09
2,619.25
2,619.25
2,619.25
1
Electricity generation for the operation of
agricultural machinery
2
Fertiliser production
CO2
1,842.77
1,718.23
1,735.17
1,777.48
1,709.03
1,674.15
2.1
N-fertiliser
CO2
526.35
457.68
655.14
513.77
450.21
640.20
2.2
P-fertiliser
CO2
8.08
13.27
14.10
7.94
13.27
13.52
2.3
K-fertiliser
CO2
57.66
63.57
63.50
54.14
61.84
63.13
2.4
NPK
CO2
1,250.68
1,183.70
1,002.44
1,201.64
1,183.70
957.30
3
Lime production
CO2
23.15
0.00
12.76
23.15
0.00
12.76
4
Pesticide production
CO2
3.83
3.83
3.83
3.83
3.83
3.83
5
Methane emissions from rice cultivation
CH4
7,870.93
5,765.76
5,556.19
10,646.16
10,110.0
8,990.94
6
Fertiliser application
506.58
414.20
497.65
548.42
431.31
538.53
6.1
CO2 emissions from urea application
CO2
81.55
63.39
78.44
81.55
88.31
85.75
6.2
Direct N2O emissions from agricultural soil
N2O
425.04
350.81
419.21
466.87
343.00
452.77
7
Lime application
CO2
3.70
0.00
2.04
3.70
0.00
2.04
8
Diesel combustion for the operation of agricultural
machinery
2,642.20
2,816.43
2,717.66
2,688.90
2,816.43
2,662.07
8.1
Tractor
CO2
1,940.87
1,940.87
1,940.87
1,940.87
1,940.87
1,940.87
N 2O
4.68
4.97
8.42
4.79
4.97
8.32
CO2
694.97
852.44
750.46
694.97
852.44
694.97
N 2O
1.68
2.06
1.81
1.68
2.06
1.81
8.2
Combine harvester
9
Transporting rice from farm to house
CO2
3.46
5.37
3.72
3.46
5.85
3.67
10
On-site straw burning
CH4
49.59
0.00
106.69
689.47
516.09
602.22
N 2O
3.43
0.00
7.37
47.63
35.65
41.60
Total (kg CO2e/ha)
16,092.74
13,866.90
13,786.17
19,051.44
18,247.45
17,151.04
Carbon footprint of rice (kg CO2e/kg of rice)
2.69
2.35
2.29
3.72
3.56
3.3
JUne 2019 • Vol.61 Number 2
Vietnam Journal of Science,
Technology and Engineering
87
Environmental Sciences | Climatology
CO2e/kg of rice for the SRI method, and 3.3 kg CO2e/kg of
rice for the wide-narrow row method.
Table 3. Mitigation costs and co-benefits of mitigation options
for rice production in Phu Luong commune.
Proposal for mitigation options
Selection criteria
Vietnam submitted its Nationally Determined
Contribution (NDC) to the United Nations Framework
Convention on Climate Change (UNFCCC) on 29
September in 2015. In its NDC, Vietnam committed that
with domestic resources, by 2030 Vietnam will reduce its
GHG emissions by 8% compared to the Business-As-Usual
(BAU scenario). The above-mentioned 8% contribution
could be increased to 25% given receiving international
support. The implementation of NDC will contribute to the
global efforts to achieve the Paris Agreement, reaching the
goal of limiting the average temperature increase less than
20C in 2100.
Based on the criteria for selecting the preferred GHGemission mitigation options in Vietnam’s NDC [12], the
criteria that are developed include:
- Harmony with strategies and planning for agricultural
and rural development.
- Mitigation cost (USD/ton CO2e).
Option
Mitigation cost
($/t.CO2e)
Co-benefit
A1. Reuse of agricultural
residues
63.0
- Increase organic
content in soil
A2. Alternate wetting and
drying
88.0
- Reduce water
volume for
irrigation
A3. Introduction of biochar
75.0
- Reduce GHG
emissions
A4. Integrated crop
management (ICM) for rice
20.0
- Reduce cost of
seeds and fertiliser
A5. Substitution of urea
(CO(NH2)2) fertiliser
by ammonium sulphate
((NH4)2SO4)
30.0
- Reduce costs of
seeds and fertiliser
Source: MONRE [12].
Mitigation options were assessed based on the criteria
by scoring them from 1 to 5 (1 being the lowest, 5 being
the highest). For farmers, mitigation costs and co-benefits
are two most important factors and hence these two criteria
have greater weight than the others. The results of the
evaluation are presented in Table 4.
Table 4. Prioritised mitigation options for rice production.
- Mitigation potential.
Criteria
- Mitigation potential according to the results of the
calculation of the carbon footprint of rice.
- Availability of technology.
- And co-benefits: bringing benefits to the economy,
society, and environment and climate-change adaptation.
Selection of prioritised mitigation options
Based on the results of the calculations, it can be
observed that the largest source of GHG emissions is from
methane from rice cultivation in both the spring and summer
seasons and in all three forms of cultivation; followed by
electricity production for operating agricultural machinery;
burning diesel for operating farm machinery; and fertiliser
production.
According to Vietnam’s NDC [12], 15 mitigation
options in the agricultural sector have been developed based
on agriculture and land use software. Of the 15 mitigation
options for agriculture, five are selected in this study for rice
production (Table 3). The option of ‘biogas development’
was not selected as farmers in Phu Luong commune mostly
apply chemical fertilisers and very little farmyard manure.
88
Vietnam Journal of Science,
Technology and Engineering
Mitigation
potential based
on rice carbon
footprint (x1)
Harmony
with
policies
(x1)
Mitigation
cost (x2)
Technology
availability
(x1)
Cobenefits
(x2)
Total
Rank of
priority
A1
1
4
3
3
3
20
5
A2
5
5
1
3
5
25
2
A3
4
4
2
2
4
22
4
A4
5
4
5
3
3
28
1
A5
3
3
5
2
3
24
3
Option
Based on the evaluation results, the study proposes
that ICM receive the highest priority for GHG-emission
reduction for rice production. The second priority options
are alternate wetting and drying and the substitution of urea
fertiliser by (NH4)2SO4.
Conclusions
This study developed a methodological framework and
conducted a pilot calculation of carbon footprints in the
life cycle of rice for Phu Luong commune. The results are
quite similar to those reported in earlier studies around the
world, such as 2.9 kgCO2e/kg of rice in Italy [13], 2.92
kg CO2e/kg of rice in Thailand [14], and ranging from 1.5
JUne 2019 • Vol.61 Number 2
Environmental Sciences | Climatology
to 2.5 kg CO2e/kg of rice in China [15]. According to the
results of the calculations, GHG emissions from operating
agricultural machinery account for a large proportion of
emissions; however, thus far, there has not been much
research on mitigation potential as this concerns the use of
agricultural machinery. Therefore, this research direction
should be considered in future.
The authors declare that there is no conflict of interest
regarding the publication of this article.
REFERENCES
[1] D. Pandey, M. Agrawal, J.S. Pandey (2011), “Carbon footprints:
Current methods of estimation”, Environmental Monitoring and
Assessment, 178, pp.135-160.
[2] BSI (2008), PAS 2050:2008: Specification for the assessment
of the life cycle greenhouse gas emissions of goods and services,
United Kingdom.
[3] Carbon Trust (2007), Carbon footprint measurement
methodology, V1.1, The Carbon Trust, London, UK.
[4] Cong Khanh Doan, Thi Thanh Huyen Truong, Huy Hoan
Tran, Thi Kim Tuyen Vo, Van Thang Tran, Hong Thom Nguyen,
Trung Thanh Ho, Ngoc Thinh Tran and Huu Lam Son Nguyen (2014),
Assessment of the current status and development trends of the market
for low-carbon commodities in Vietnam and on the world and propose
solutions to promote, Summary report 04.14/CC, Ministry of Industry
and Trade.
[7] Institute of Agricultural Environment (2016), Developing
a comprehensive pilot Measurement-Reporting-Verification (MRV)
framework for NAMAs on a selected agricultural sub-system
comprised of rice cultivation and improved cookstoves.
[8] IPCC (2006), IPPC Guidelines for National Greenhouse Gas
Inventories, IGES, Japan.
[9] T. Nemecek and T. Kagi (2007), Life cycle inventories of
agricultural systems, 46pp.
[10] B. Gadde, S. Bonnet, C. Menke and S. Garivate (2009),
“Air pollutant emissions from rice straw open field burning in India,
Thailand and the Philippines”, Journal of Environmental Pollution,
157, pp.1554-1558.
[11] IPCC (2014), Climate Change 2014: Synthesis Report:
Contribution of Working Group I, II and III to the Fifth Assessment
Report of the Intergovernmental Panel of Climate Change, Geneva,
Switzerland, 151pp.
[12] Ministry of Natural Resources and Environment (2015),
Technical report: Vietnam’s Intended Nationally Determined
Contribution.
[13] S. Kasmaprapruet, W. Paengjuntuek, P. Saikhwan, H.
Phungrassami (2009), “Life Cycle Assessment of Milled Rice
Production: Case Study in Thailand”, European Journal of Scientific
Research, 30(2), pp.95-203.
[5] ISO (2013), ISO/TS 14067: Greenhouse gases - Carbon
footprint of products-Requirements and guidelines for quantification
and communication.
[14] G.A. Blengini and M. Busto (2009), “The life cycle of rice:
Life Cycle Assessment of alternative agri-food chain management
systems in Vercelli (Italy)”, Journal of Environmental Management,
90, pp.1512-1522.
[6] FAO (2017), Global database of GHG emissions related to
feed crops: Methodology, V1, Livestock Environmental Assessment
and Performance Partnership. FAO, Rome, Italy.
[15] X. Xu, B. Zhang, Y. Liu, Y. Xue, B. Di (2013), “Carbon
footprints of rice production in five typical rice districts in China”,
Acta Ecologica Sinica, 33, pp.227-232.
JUne 2019 • Vol.61 Number 2
Vietnam Journal of Science,
Technology and Engineering
89