Báo cáo khoa học: Spectroscopic characterization of the oxyferrous complex of prostacyclin synthase in solution and in trapped sol–gel matrix doc
Bạn đang xem bản rút gọn của tài liệu. Xem và tải ngay bản đầy đủ của tài liệu tại đây (307.15 KB, 10 trang )
Spectroscopic characterization of the oxyferrous complex
of prostacyclin synthase in solution and in trapped sol–gel
matrix
Hui-Chun Yeh, Pei-Yung Hsu, Ah-Lim Tsai and Lee-Ho Wang
Division of Hematology, Department of Internal Medicine, University of Texas Health Science Center, Houston, TX, USA
Cytochrome P450 (P450) contains a thiolate-ligated
heme and catalyzes the hydroxylation, epoxidation,
dealkylation, C–C bond scission, dehalogenation and
isomerization of a plethora of organic compounds.
Typical P450 catalysis involves an oxyferrous interme-
diate [Fe(II)O
2
or Fe(III)O
2
)
•] that is derived from the
di-oxygen binding to the reduced heme iron to initiate
the catalytic cycle. The resultant oxyferrous complex is
very labile, accepting an electron to elicit the di-oxygen
bond scission and producing the iron-oxo species for
ensuing reactions, or auto-oxidizing to form the ferric
hemoprotein and superoxide anion radical [1]. A
method for capturing the intermediate oxyferrous com-
plex is needed to understand P450 di-oxygen activia-
tion in greater detail. Researchers have sought to
characterize the thermodynamic and kinetic aspects of
this intermediate [2], with the subzero temperature
technique being the most widely used approach [3–6].
This procedure slows reaction rates to trap the inter-
mediate within the multiple-step reaction system. For
example, Eisenstein et al. stabilized the oxyferrous
complex of P450cam below )30 °C using a mixed
organic solvent system [4]. In the presence and absence
of the substrate, the half-life of the oxyferrous complex
was 48 and 2.5 h, respectively. Buffer system selection
is crucial for this method. Bec et al. obtained the oxy-
ferrous complex of P450BM3 under an argon atmo-
sphere at )25 °C in the presence of 50% glycerol [7].
Perera et al. also reported the oxyferrous complex of
P450BM3 at )55 °C using a glycerol ⁄ buffer (70 : 30,
v ⁄ v) cryosolvent [8]. This low-temperature method can
also be used to study subsequent reactions by slowly
Keywords
cytochrome P450; eicosanoid;
encapsulation; intermediate trapping
Correspondence
L H. Wang, Division of Hematology,
Department of Internal Medicine, 6431
Fannin, Houston, TX 77030, USA
Fax: +1 713 500 6810
Tel: +1 713 500 6794
E-mail:
(Received 11 December 2007, revised 5
February 2008, accepted 6 March 2008)
doi:10.1111/j.1742-4658.2008.06385.x
Prostacyclin synthase (PGIS) is a member of the cytochrome P450 family
in which the oxyferrous complexes are generally labile in the absence of
substrate. At 4 °C, the on-rate constants and off-rate constants of oxygen
binding to PGIS in solution are 5.9 · 10
5
m
)1
Æs
)1
and 29 s
)1
, respectively.
The oxyferrous complex decays to a ferric form at a rate of 12 s
)1
.We
report, for the first time, a stable oxyferrous complex of PGIS in a trans-
parent sol–gel monolith. The encapsulated ferric PGIS retained the same
spectroscopic features as in solution. The binding capabilities of the encap-
sulated PGIS were demonstrated by spectral changes upon the addition of
O-based, N-based and C-based ligands. The peroxidase activity of PGIS in
sol–gel was three orders of magnitude slower than that in solution owing
to the restricted diffusion of the substrate in sol–gel. The oxyferrous com-
plex in sol–gel was observable for 24 h at room temperature and displayed
a much red-shifted Soret peak. Stabilization of the ferrous–carbon monox-
ide complex in sol–gel was observed as an enrichment of the 450-nm
species over the 420-nm species. This result suggests that the sol–gel
method may be applied to other P450s to generate a stable intermediate in
the di-oxygen activation.
Abbreviations
P450, cytochrome P450; PGIS, prostaglandin I
2
synthase or prostacyclin synthase; TMOS, tetramethyl orthosilicate.
FEBS Journal 275 (2008) 2305–2314 ª 2008 The Authors Journal compilation ª 2008 FEBS 2305
increasing the temperature [9]. Although the formation
of stable oxyferrous complexes can be accomplished by
cryotechnique, it is uncertain whether the enzyme
behaves in the same manner in the cryosolvent as in
an aqueous environment. Additionally, cryotechnique
is difficult and sometimes cumbersome.
Proteins encapsulated in transparent sol–gel-derived
silica glasses have been shown to retain their spectro-
scopic properties and to undergo characteristic reac-
tions, making them suitable for optical spectroscopic
studies [10]. The sol–gel technique has been applied to
many hemoproteins, such as myoglobin [11–14], hemo-
globin [11,15–18], cytochrome c [11,19,20] and horse-
radish peroxidase [21,22]. These entrapped proteins
were remarkably stable at room temperature and
maintained their protein structures, functional activi-
ties and spectroscopic properties. The reaction chemis-
try of the encapsulated enzymes was analogous to that
in solution except that the observed rate constant was
markedly impeded as a result of diffusional limitation
of the reactant. Some transient conformers of the
encapsulated hemoglobin and myoglobin were trapped
[12,16,23,24]. The reaction intermediates of the encap-
sulated horseradish peroxidase were characterized at
ambient temperature [21]. Although the diffusional
limitation inside the porous network (in the case of
monoliths) remains an intrinsic obstacle to studying
enzymatic intermediates, future developments, such as
sol–gel-derived thin films, may allow the use of this
technique for broader applications [25]. To date, how-
ever, the sol–gel technique has been rarely applied to
the study of P450.
Prostacyclin synthase (also known as prostaglandin
I
2
synthase; PGIS; EC 5.3.99.4) is located in the mem-
brane of the endoplasmic reticulum and is a down-
stream enzyme in the prostaglandin synthesis pathway.
Unlike other microsomal P450s, PGIS needs neither
an oxygen molecule nor an external electron donor for
catalysis. In contrast, it catalyzes an isomerization
reaction that converts prostaglandin H
2
to prostacy-
clin, a potent regulator of antiplatelet aggregation and
vasodilation. Although PGIS is an atypical P450 with
respect to the catalytic reaction, it retains the P450
characteristics of electronic absorption, EPR and mag-
netic CD spectra [26]. The resting enzyme has a typical
low-spin heme with a hydrophobic active site and uses
peroxides to bypass the di-oxygen requirement in the
‘peroxide shunt’ reaction [27]. Its crystal structure
closely resembles those of other P450s, exhibiting the
typical triangular prism-shaped tertiary architecture
[28]. Unlike most microsomal P450s, which bind vari-
ous sizes and shapes of ligands, PGIS has only a few
known heme ligands [29]. We have previously devel-
oped a heterologous expression system for human
PGIS [26]. The availability of a large quantity of
homogeneous recombinant PGIS makes it a suitable
tool for using to study general P450 features. We chose
PGIS for developing the sol–gel method to study P450
enzymes, not only because it has many soluble P450
features but also because it is a membrane-bound
P450 and thus may represent microsomal P450s, which
are involved in the clearance of most drugs and toxins
in humans [30]. In this study, we applied a sol–gel
method and demonstrated that entrapped PGIS main-
tained its spectral features, ligand-binding capabilities
and functionality. We also showed that the oxyferrous
complex of PGIS in a wet transparent porous silica
glass was greatly stabilized in comparison with that in
solution, thus establishing the potential of this tech-
nique for stabilizing otherwise transient intermediates
in the P450 reaction.
Results and Discussion
Formation and decay of oxyferrous PGIS complex
in solution
Upon reduction of the ferric PGIS heme by dithionite,
the Soret peak was blue-shifted from 418 to 412 nm,
accompanied by a decrease in intensity, whereas the
Q band (a collective term for the a and b bands), with
an a-band peak at 570 nm and a b-band peak at
537 nm, was replaced with a broad peak at around
550 nm [26]. When the reduced sample was exposed to
oxygen, an absorption spectrum of the re-oxidized
sample showed the features of the resting enzyme (i.e.
a Soret peak at 418 nm and discrete a bands and
b bands at 570 and 537 nm, respectively (data not
shown), whereas loss of < 5% of the original heme
was observed. However, the reduction ⁄ oxidation cycle
caused no significant loss of enzymatic activity, indi-
cating that the reduction ⁄ oxidation cycle of PGIS is a
reversible process. This finding is commonly observed
in P450s, in which the oxyferrous complex is transient.
To examine whether the oxyferrous complex of PGIS
is also transient, rapid-scan stopped-flow spectroscopy
was performed by mixing ferrous PGIS with air-satu-
rated buffer at 23 °C. The first spectrum recorded after
mixing ( 2.5 ms) had the Soret peak at 420 nm and
the Q band exhibiting the maximum at 556 nm and
the shoulder at 530 nm (data not shown), similar to
most oxyferrous complexes of P450s (Table 1). The
420-nm species then transformed to a species similar to
the resting enzyme with the Soret peak at 418 nm and
the Q band absorption maxima at 570 and 537 nm.
These data also indicated that oxygen binding to
Oxyferrous complex of PGIS H C. Yeh et al.
2306 FEBS Journal 275 (2008) 2305–2314 ª 2008 The Authors Journal compilation ª 2008 FEBS
ferrous PGIS is a rapid step and is completed within
the dead time of the stopped-flow apparatus (i.e.
1.5 ms). In the absence of substrate, the oxyferrous
complex of P450 is labile and undergoes auto-oxida-
tion to release superoxide radical and re-establish the
resting enzyme [1]. This is probably the case for PGIS.
The increase in the absorbance (A) at 420 nm, an indi-
cation of auto-oxidation, was fit to a single exponential
function and a rate constant of 24.8 ± 0.5 s
)1
was
calculated.
Owing to the difficulty of observing the transition of
the ferrous PGIS to oxyferrous PGIS at 23 °C, we per-
formed rapid-scan stopped-flow experiments at 4 °C
by reacting 5 lm ferrous PGIS with a fourfold dilution
of air-saturated buffer (containing a concentration of
100 lm dissolved oxygen; Fig. 1A). Use of singular
value decomposition and global analysis for the model
A M B fi C, with k
1
(forward rate constant of
A fi B) equal to 70 ± 9 s
)1
,k
2
(backward rate
constant of A ‹ B) equal to 30 ± 6 s
)1
, and k
3
(forward rate constant of B fi C) equal to 20 ± 2 s
)1
,
yielded the spectra of individual intermediates shown
in Fig. 1B. The conversion of species A to species B
resulted in a slight increase of the Soret peak that was
accompanied by a peak shift from 416 to 422 nm.
Table 1. Spectral properties of the oxyferrous complexes of PGIS
in comparison with other P450s. Temp., temperature.
Soret b ⁄ a band
Temp.
(°C) Reference
PGIS (sol–gel) 425 530 ⁄ 558 23 This study
PGIS (solution) 420 530 ⁄ 556 23 This study
PGIS (solution) 422 530 ⁄ 556 4 This study
P450BM3 + arachidonic acid 423 560 )55 [8]
P450cam
+ camphor 418 555 4 [34]
+ camphor 418 552 )20 [4]
+ camphor 420 553 )40 [35]
) camphor 418 552 )40 [4]
P4503A4
) testosterone 418 552 6 [31]
+ testosterone 424 6 [31]
Adrenal cortex mitochondria P450scc
+ cholesterol 423 553 )17 [36]
+ cholesterol 422 555 )30 [6]
) cholesterol 420 555 )17 [36]
Hepatic microsomes
P450
LM2
422 557–558 )30 [5]
P450
LM3b
418 555 10 [37]
P450
LM4
418 555 10 [37]
Rhizobium [38]
P450a 417 4
P450b 419 4
P450c 421 4
Caldariomyces fumago
Chloroperoxidase 428 553 ⁄ 587 < )103 [39]
Chloroperoxidase 428 555 ⁄ 588 25 [40]
Nitric oxide synthase
+ arginine 428 560 4 [32]
) arginine 418 560 4 [32]
400 440 480
Absorbance
0.2
0.4
Wavelength (nm)
400 440 480
0.2
0.4
550 600 650
0.05
0.10
550 600 650
0.05
0.10
[O
2
] (µM)
0 50 100 150 200
Rate (s
-1
)
0
60
120
180
1
2
1
2
A
B
C
A
B
C
A
B
C
Absorbance
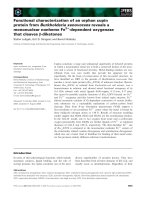
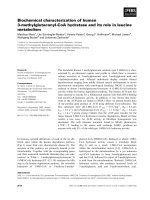
Fig. 1. Stopped-flow study of ferrous PGIS reaction with oxygen.
(A) Rapid scan absorbance spectral changes for the reaction of fer-
rous PGIS (5 l
M) with oxygenated buffer (100 lM)at4°C. Spectra
were recorded at 0.0013, 0.0064, 0.014 and 0.0127 s, and then at
increments of 0.026-s intervals until 1 s of reaction time had been
monitored. Arrows show the directions of spectral changes with
increasing time, and numbers indicate the orders of the signal
change. (B) Spectral intermediates resolved by global analysis using
the sequential model of A M BfiC (species A, solid line; species B,
dotted line; species C, dashed line). (C) Plots of the observed rate
constants for the first phase (filled circles) and the second phase
(open circles) versus oxygen concentration. Experiments were
carried out by mixing ferrous PGIS (5.0 l
M) with various concentra-
tions of oxygenated buffer (25–200 l
M).
H C. Yeh et al. Oxyferrous complex of PGIS
FEBS Journal 275 (2008) 2305–2314 ª 2008 The Authors Journal compilation ª 2008 FEBS 2307
Moreover, in species B the intensity of the a band
(556 nm) was greater than that of the b band
(530 nm). This spectral feature is similar to that of
oxyferrous complexes of P450s, particularly at the
Q band region in which the a band has a slightly
higher intensity than the b band. Species C is the
re-oxidized ferric PGIS. To characterize kinetically the
binding step, a series of stopped-flow experiments was
carried out at 4 °C in which the ferrous PGIS was
mixed with varying ratios of air-saturated and nitro-
gen-saturated buffer. The oxygen-binding and subse-
quent decay steps were monitored at 430 nm and
420 nm, respectively. The slope of the observed
pseudo-first-order rate constants versus the oxygen
concentration gives a second-order rate constant of
5.9 ± 0.2 · 10
5
m
)1
Æs
)1
(Fig. 1C). A dissociation rate
constant of 29 ± 3 s
)1
was obtained from the ordinate
intercept. The oxyferrous PGIS, however, was unstable
and readily oxidized to the resting PGIS at a decay
rate of 12 ± 2 s
)1
(t
1 ⁄ 2
0.06 s) at 4 °C in an oxygen
concentration-independent manner. The concentration-
independent slow phase was consistent with the auto-
oxidation step that leads to the production of the
superoxide radical and resting enzyme. It should be
noted that our knowledge about the oxyferrous inter-
mediate in microsomal P450 catalysis is generally
hampered by heterogeneous kinetic properties, partly
as a result of the presence of heterogeneous popula-
tions of aggregated P450 forms. Using the monomeric
and monodispersive PGIS [28], we provided clear
information for the oxyferrous intermediate of a
microsomal P450 enzyme. All our data fit well to the
simple scheme of Fe
2+
+O
2
M [oxyferrous] fi Fe
3+
+
O
2
)
•. Taken together, the binding of oxygen to ferrous
PGIS is similar to that of other P450s with respect to
the transient formation of the oxyferrous form, fol-
lowed by restoration of the resting enzyme and super-
oxide radical anion formation.
Table 2 shows the second-order rate constants of
oxygen binding to the ferrous P450s as well as the dis-
sociation constants and auto-oxidation rates of their
oxyferrous complexes. The oxyferrous complex was
much less stable and readily auto-oxidized in the
absence of substrate. In P450 hydroxylation, binding of
the substrate generally induces a five-coordinate ⁄ high-
spin heme. Lacking the knowledge of such a substrate
for PGIS, we only examined the complex in the sub-
strate-free form. The second-order rate constant of oxy-
gen binding to PGIS at 4 °C was 5.9 · 10
5
m
)1
Æs
)1
and
the auto-oxidation rate constant was 12 s
)1
. These val-
ues are comparable to those obtained from the micro-
somal CYP3A4 assembled in a lipid bilayer of 10-nm
Table 2. Kinetic constants of the formation and decay of the oxyferrous complexes for the reaction of oxygen with various ferrous P450s
a
.
Temp., temperature.
k
on
(M
)1
Æs
)1
)k
off
(s
)1
) K
d
(lM)k
decay
(s
)1
) Temp. (°C)
PGIS (this study) 5.9 · 10
5
29 49 12 4
P4503A4 [31]
+ testosterone 5.0 · 10
5
0.37 6
) testosterone 20 5
Rhizobium [38]
P450a 5 · 10
5
2.2 4
P450b 7 · 10
5
1.6 4
P450c 7 · 10
5
4.8 4
Pseudomonas putida P450cam [4,34]
+ camphor 7.7 · 10
5
(4 °C) 1.4 0.55 · 10
)3
2
) camphor Very fast 1.8 · 10
)3
2
Adrenal cortex mitochondria P450scc [36,41,42]
+ cholesterol 3.8 · 10
5
4.7 12 6.3 4
+ cholesterol 1.3 · 10
6
(8 °C) 23 6.1 · 10
)3
2
) cholesterol Very fast 4.0 · 10
)3
)17
Hepatic microsomes [37,43,44]
P450
LM2
4.4 · 10
6
(25 °C) 3.7 2
P450
LM3
10
6
(25 °C) 4.3 10
P450
LM4
5.0 · 10
5
0.7 0.9 10
Caldariomyces fumago [40]
Chloroperoxidase (pH 2.8–6.8) 5.5 · 10
5
8–32 10–70 25
Nitric oxide synthase [32]
+ arginine 4 · 10
5
5.5 13.8 1.4 4
) arginine 1.4 · 10
5
60 43 5–30 4
a
Unless otherwise indicated, the experiments were carried out at a pH of 7.1–7.5.
Oxyferrous complex of PGIS H C. Yeh et al.
2308 FEBS Journal 275 (2008) 2305–2314 ª 2008 The Authors Journal compilation ª 2008 FEBS
diameter (Nanodiscs) as a soluble and monomeric
entity [31]. CYP3A4 in Nanodiscs is monodisperse and
kinetically homogeneous. Upon oxygen binding, fer-
rous CYP3A4 in the substrate-free form showed a red-
shift of the Soret peak to 418 nm with a fused Q band
peak near 552 nm, whereas in the presence of testoster-
one the Soret peak was further red-shifted to around
424 nm. In the presence of substrate, the second-
order rate constant of oxygen binding at 6 °C was
5 · 10
5
m
)1
Æs
)1
, and the auto-oxidation rate of the oxy-
ferrous complex was 0.37 s
)1
. In the absence of sub-
strate, the auto-oxidation rate was 20 s
)1
at 5 °C.
Compared with bacterial P450s, such as P450cam and
P450BM3, the auto-oxidation of PGIS and CYP3A4
occurred approximately three to four orders of magni-
tude faster. This may explain why bacterial P450s gen-
erally use their redox equivalents more efficiently than
do microsomal P450s, which exhibit a higher degree of
uncoupling and a greater production of superoxide
radical anion or hydrogen peroxide. Although PGIS
does not need an oxygen molecule for catalysis, it may
serve as a model for studying oxyferrous intermediates
of microsomal P450s.
UV
⁄
VIS spectra of ligand binding of PGIS in
solution and in sol–gel monolith
In an attempt to stabilize the oxyferrous complex of
PGIS for further studies, we adopted a method that
immobilized the protein in sol–gel-derived silica
glasses. The encapsulated PGIS has a Soret peak at
418 nm and a and b bands at 571 and 537 nm,
respectively, which are similar to PGIS in solution
(Fig. 3A, solid line). Spectral perturbation was then
used to examine whether the encapsulated PGIS
interacted with the heme ligands. We chose U46619
(an O-based ligand; a substrate analog whose oxygen
atom at the C9 position is replaced with a carbon
atom), NaCN (a C-based ligand) and clotrimazole
(an N-based ligand) as the probes because they
induced distinct patterns of spectral changes [26].
Figure 2A shows the difference spectra of U46619
binding to PGIS in solution and in sol–gel. In solu-
tion, U46619 binding caused a blue shift of the
Soret peak (upper left panel). The difference spec-
trum shows the peak at 410 nm and the trough at
428 nm (bottom left panel). Similarly, binding of
U46619 to the encapsulated PGIS caused a blue shift
of the Soret band, although to a lesser extent (upper
right panel), and generated a difference spectrum
with the peak at 406 nm and the trough at 426 nm
(lower right panel). Results of the binding of NaCN
and clotrimazole to PGIS in solution and in sol–gel
are shown in Figs 2B,C. NaCN induced a red shift
of the Soret peak in both aqueous and encapsulated
PGIS (Fig. 2B, upper panels). Spectral perturbation
by NaCN in solution produced a peak at 443 nm
and a trough at 416 nm, and in sol–gel, a peak at
444 nm and a trough at 416 nm (Fig. 2B, bottom
panels). Binding of clotrimazole to aqueous PGIS
produced spectral changes identical to those of
0.0
0.3
0.6
36 04 00 44 04 80
–0.06
0.00
0.06
A
B
C
Wavelength (nm)
Wavelength (nm)
Wavelength (nm)
Absorbance
Abs
0.0
0.4
0.8
36 04 00 44 04 80
–0.03
0.00
0.03
0.0
0.1
0.2
0.3
360 400 44 04 80
Abs
–0.1
0.0
0.1
0.0
0.4
0.8
360 40 04 40 480
–0.1
0.0
0.1
0.0
0.1
0.2
0.3
360 400 440 480
–0.08
0.00
Absorbance Absorbance
Abs
0.5
1.0
360 400 440 480
–0.1
0.0
0.1
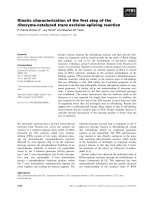
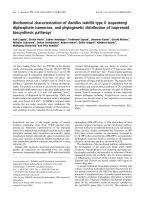
Fig. 2. Absorption spectra of PGIS and its ligand complexes in
solution and in sol–gel. Binding with (A) U46619, (B) NaCN and (C)
clotrimazole. Spectra were recorded before (solid lines) and after
(dashed lines) addition of the exogeneous ligands into the aqueous
PGIS (left panels) and encapsulated PGIS (right panels). For each
ligand, the absolute absorption spectrum is shown in the top panel
and the difference spectra in the bottom panel.
H C. Yeh et al. Oxyferrous complex of PGIS
FEBS Journal 275 (2008) 2305–2314 ª 2008 The Authors Journal compilation ª 2008 FEBS 2309
encapsulated PGIS, with a peak at 433 nm and a
trough at 414 nm (Fig. 2C). These results indicate
that the substrate access channel, active site and
heme structure of PGIS in solution are preserved in
the sol–gel matrix.
Peroxidase reactivity of PGIS in solution and
sol–gel
Similarly to other P450s, PGIS possesses peroxidase
activity that uses peroxides as the substrate [26].
Because prostaglandin H
2
is unstable in aqueous solu-
tion, we tested the enzymatic activity of encapsulated
PGIS using peracetic acid as the substrate and guaia-
col as the cosubstrate. Enzymatic activity was followed
by absorbance changes at 470 nm that monitored the
oxidation of guaiacol. Upon the addition of peracetic
acid to encapsulated PGIS, the orange product first
appeared at the outer face of the monolith and gradu-
ally disappeared, accompanied by the formation of
fresh orange product in the inner layer during the
30-min incubation. This result indicates not only that
encapsulated PGIS was active but also that activity
was limited by diffusion of the substrate. We also esti-
mated the enzyme activities of aqueous PGIS and
encapsulated PGIS using the same concentration of
guaiacol and peracetic acid. The initial rates of the
aqueous and encapsulated PGIS were 59.4 and 0.06
mole product⁄ mole PGIS⁄ min, respectively, indicating
a difference of three orders of magnitude in the cata-
lytic activity of the two forms of PGIS. It should be
noted that because only a small fraction of encapsu-
lated PGIS is involved in the catalysis, the catalytic
rate determined is substantially decreased.
Binding of O
2
to PGIS in the sol–gel monolith
We further studied O
2
binding to encapsulated PGIS.
After adding dithionite to buffer containing encapsu-
lated PGIS, we anticipated fully reduced PGIS with
the Soret peak at 412 nm, as in solution [26]. However,
in contrast, the Soret peak gradually shifted over a 4-h
incubation time from 418 to 425 nm with the forma-
tion of well-defined a bands and b bands at 558 and
530 nm, respectively (Fig. 3A). This spectral feature is
somewhat similar to the oxyferrous complex resolved
by stopped-flow spectroscopy (Fig. 1B, dotted line),
except that the Soret peak is further red-shifted. We
speculated that the oxyferrous complex was formed
upon the reduction of PGIS because certain amounts
of oxygen were cotrapped with PGIS in sol–gel. To
test this, we first bubbled N
2
gas into the gel-contain-
ing solution for 2 h to remove trapped oxygen prior to
the addition of dithionite. The spectrum of reduced
PGIS in sol–gel with the Soret peak at 413 nm and the
fused Q band (Fig. 3B, right panel, dashed line) is very
similar to that of reduced PGIS in solution (Fig. 3B,
left panel, dotted line). Reduced PGIS in sol–gel was
then soaked in an air-saturated buffer overnight. Con-
sequently, the encapsulated PGIS displayed a Soret
peak at 417 nm with separated a bands and b bands
(Fig. 3B, right panel, dash-dotted line), indicating that
PGIS was re-oxidized to the ferric form. Notably, the
re-oxidized PGIS lost approximately 10% of the inten-
Wavelength (nm)
Wavelength (nm)
390 420 450 480
Absorbance
0.4
0.8
1.2
A
B
510 540 570 600
0.2
0.3
0.4
558 nm
530 nm
425
418
537 nm
571 nm
380 400 420 440 460 480
Absorbance
0.0
0.2
0.4
0.6
500 550 600
0.00
0.04
0.08
400 450 500 550 600 650
0.25
0.50
0.75
520 560 600
0.2
0.3
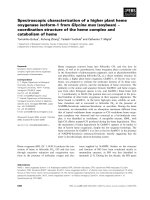
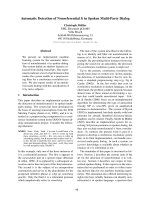
Fig. 3. Comparison of oxyferrous PGIS
complexes in solution and in sol–gel. (A)
Absorption spectra of PGIS (solid line) and
its oxyferrous complex formed at 1.5 h (dot-
ted line), 2.5 h (dashed line) and 4 h (dot–
dot–dash line) in the sol–gel. (B) Left panel,
absorption spectra of 4.6 l
M ferric PGIS
(solid line) and ferrous PGIS (dotted line) in
solution. Right panel, ferric PGIS (thin solid
line), ferrous PGIS (dashed line), re-oxidized
PGIS (dash-dot-dot line) and oxyferrous
PGIS (thick solid line) in sol–gel.
Oxyferrous complex of PGIS H C. Yeh et al.
2310 FEBS Journal 275 (2008) 2305–2314 ª 2008 The Authors Journal compilation ª 2008 FEBS
sity of the Soret peak, suggesting that the redox pro-
cess may cause bleaching of the enzyme. We then
added a small amount of dithionite to the solution
containing re-oxidized PGIS and sealed the cuvette
with parafilm. Again, the Soret peak was gradually
red-shifted and after 4 h of incubation it reached
422 nm, whereas the a bands and b bands were 557
and 528 nm, respectively (Fig. 3B, right panel, thick
solid line). This spectral feature is similar to the oxy-
ferrous PGIS in sol–gel shown in Fig. 3A, suggesting
that oxygen trapped in the sol–gel is capable of form-
ing the oxyferrous PGIS complex. Incomplete red-shift
of the Soret peak may be caused by the presence of a
ferric form that was not reduced as a result of the
smaller amount of trapped oxygen. This result also
suggests that the redox process in the encapsulated
PGIS is reversible. The oxyferrous complex was stable
for more than 24 h at room temperature, indicating
that the rate of auto-oxidation in sol–gel is about
six orders of magnitude slower than that observed in
solution.
The Soret peak of the oxyferrous PGIS determined
in this study varied from 420 nm at 23 °C to 422 nm
at 4 °C in solution and to 425 nm in sol–gel at 23 °C.
However, all values fell within the range of Soret
peaks reported for the other oxyferrous P450s (i.e.
417–428 nm; Table 1). The transient nature of the
complex may make it difficult to obtain the spectrum
of the pure oxyferrous form [32]. As a result, the
resolved oxyferrous spectrum obtained by global anal-
ysis contains a mixture of the ferrous, oxyferrous and
ferric forms. Interestingly, a more long-lived oxyfer-
rous complex, such as that in the presence of the sub-
strate or at lower temperature, tends to have a more
red-shifted Soret peak (Table 1). This trend suggests
that the Soret peak of the oxyferrous complex is prob-
ably at a higher wavelength, as the peaks for the ferric
and ferrous heme are located at shorter wavelengths.
Our results also support this idea and thus demon-
strate that the oxyferrous complex of PGIS is more
stable in sol–gel than in solution. Although the associ-
ation rate of oxygen and ferrous PGIS was decreased
in sol–gel, the two processes that dissipate the oxyfer-
rous intermediate (i.e. back dissociation to ferrous
heme and chemical decay to ferric heme) must be
slowed considerably in the sol–gel environment to
allow more accumulation of the oxyferrous intermedi-
ate, thus maximizing the red-shift of the Soret peak.
Binding of CO to PGIS in sol–gel monolith
To test whether this technique can be applied to other
gaseous ligands, we bubbled carbon monoxide into
buffer containing encapsulated PGIS for 1 h and then
added dithionite to the solution. The spectrum showed
Soret peaks at 422 and 450 nm (Fig. 4), similar to
those observed in solution [26]. Our previous study has
shown that while the formation rate of the ferrous–CO
complex of PGIS (5.6 · 10
5
m
)1
Æs
)1
) falls within the
ranges of most P450s, the complex is surprisingly
unstable, converting to a 422-nm species at a rate of
0.7 s
)1
. In sol–gel, we observed a slower formation of
the complex, requiring 20 min to reach k
450
maximum.
Furthermore, the complex was stable in sol–gel for at
least 2.5 h, indicating that the ferrous–CO complex is
greatly stabilized in sol–gel, a trend similar to that
observed for the ferrous–O
2
complex.
In conclusion, transient intermediates that are diffi-
cult to achieve in aqueous solution were produced and
stabilized using this technique. PGIS was encapsulated
in a silica matrix with minimal changes to its spectro-
scopic properties, allowing us to study trapped inter-
mediates. The spectral data obtained in this study
demonstrated, for the first time, the existence of the
oxyferrous PGIS complex and evidence for its similar-
ity to other P450s. This method can be applied to
other spectroscopy, such as resonance Raman and
magnetic CD, for characterization of the oxyferrous
and reduced–CO complexes and, potentially, for other
intermediates in the P450 reaction cycle.
Experimental procedures
Materials
Purified recombinant PGIS, modified to be soluble by dele-
tion of the amino-terminal membrane-binding domain, was
prepared as previously described [28]. Tetramethyl orthosili-
Wavelength (nm)
380 400 420 440 460 480
Absorbance
0.4
0.8
1.2
1.6
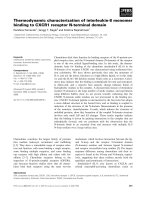
Fig. 4. Progression of ferrous–CO complex formation in sol–gel.
Ferric PGIS (solid line), a ferrous–CO complex of 20 min of incuba-
tion (dotted line) and a ferrous–CO complex of 2.5 h of incubation
(dashed line) in sol–gel.
H C. Yeh et al. Oxyferrous complex of PGIS
FEBS Journal 275 (2008) 2305–2314 ª 2008 The Authors Journal compilation ª 2008 FEBS 2311
cate (TMOS), sodium cyanide, clotrimazole and sodium
dithionite were purchased from Sigma-Aldrich (St Louis,
MO, USA) and used without further purification.
UV-grade polymethyl methacrylate disposable cuvettes
(10 mm · 4mm· 45 mm; 1.5 mL; 280–800 nm) were pur-
chased from VWR (West Chest, PA, USA). U46619 (15-
hydroxy-9,11-[methanoepoxy] prosta-5,13-dienoic acid) was
obtained from Cayman (Ann Arbor, MI, USA).
Preparation of sol–gel-encapsulated PGIS
TMOS sol was prepared by the sonication of 1.5 mL of
TMOS, 0.35 mL of water and 0.01 mL of 0.1 m HCl for
30 min [10]. TMOS-derived monoliths were prepared as
described previously, with slight modifications [21]. Briefly,
0.24 mL of TMOS sol was mixed with 0.39 mL of buffer
(20 mm Na ⁄ P
i
, pH 7.5, and 10% glycerol) containing
approximately 20 lm PGIS. The mixture was placed in a
polymethyl methacrylate cuvette, and the monoliths formed
within 60 min. For 2 weeks following gelation, TMOS-
derived monoliths (2 mm · 7mm· 14 mm) were rinsed
three times daily with 1 mL of buffer to remove methanol
produced during gelation and were stored in buffer at 4 °C.
The lifetime of encapsulated PGIS was more than 6 months.
Ligand binding
U46619, NaCN and clotrimazole were prepared as stock
solutions in 20 mm Na ⁄ P
i
(pH 7.5) and 10% glycerol.
Aliquots of the ligand stock were added in 1 mL of buffer
containing either aqueous PGIS or encapsulated PGIS.
Spectra were taken before and after ligand addition.
Because of the slow diffusion rate, a 20 min incubation of
the PGIS monolith was required. Spectra were recorded
using a Shimadzu UV-2501PC spectrophotometer (Kyoto,
Japan). Difference spectra were generated by subtraction of
the spectrum of PGIS from each ligand-bound spectrum.
Stopped-flow kinetic measurements
PGIS (10 lm)in20mm Na ⁄ P
i
(pH 7.4) and 10% glycerol
was introduced in a tonometer. The tonometer was pro-
cessed by five cycles of alternating vacuum (30 s) and argon
replacement (5 min) through a glass valve connected to an
anaerobic train. PGIS was then reduced with the stepwise
addition of dithionite through a gas-tight Hamilton syringe
attached to the tonometer. Absorption spectra were
recorded after each addition of dithionite to ensure com-
plete conversion from the ferric form to the ferrous form.
O
2
-saturated solution (400 lm at 4 °C) was prepared by
continuous bubbling with O
2
for more than 20 min and
bubbling between each measurement. The O
2
solutions were
prepared by diluting O
2
-saturated buffer into nitrogen-
saturated buffer with a gas-tight syringe through a rubber
septum. The PGIS-containing tonometer and O
2
solution
syringe were loaded on a Bio-Sequential DX-18MV
stopped-flow apparatus (Applied Photophysics, Leather-
head, UK) equipped with a temperature-controlled cir-
culator. Heme spectral changes upon O
2
binding were
monitored at 4 °C with either photodiode array detection
or single wavelength measurement. For single wavelength
kinetic data, the built-in software was used for rate analy-
sis. The rapid-scan data were analyzed using the pro-k soft-
ware package (Applied Photophysics).
Preparation of O
2
-bound ferrous PGIS monoliths
TMOS-derived PGIS monoliths were placed in a quartz
cuvette containing 1 mL of buffer. The cuvette was sealed
with parafilm after adding 10 lL of 0.1 mgÆmL
)1
sodium
dithionite stock solution. Spectra were taken before and
after the addition of sodium dithionite.
Peroxidase activity
The peroxidase reaction was initiated by adding peracetic
acid (100 lm) into the guaiacol solution (1.78 m in 20 mm
Na ⁄ P
i
, pH 7.5, with 10% glycerol) containing either aque-
ous PGIS (0.5 lm) or encapsulated PGIS. To reach equilib-
rium, guaiacol and PGIS monoliths were incubated for
30 min before adding peracetic acid. Guaiacol oxidation
was monitored by measuring the change in absorbance at
470 nm at a temperature of 23 °C(e = 26.6 mm
)1
Æcm
)1
)
[33]. Control experiments without PGIS were used to cor-
rect for noncatalytic background oxidation.
Acknowledgements
This work was supported by Grants HL60625 (to
L H. W.) and GM44911 (to A L. T.) from the
National Institutes of Health. We thank Dr Wann-Yin
Lin at the National Taiwan University for encourage-
ment and helpful discussion in sol–gel preparation and
Dr Jinn-Shyan Wang of the Fu Jen Catholic Univer-
sity for assistance in the stopped-flow experiments
during his sabbatical leave.
References
1 Sligar SG, Lipscomb JD, Debrunner PG & Gunsalus
IC (1974) Superoxide anion production by the autoxida-
tion of cytochrome P450cam. Biochem Biophys Res
Commun 61, 290–296.
2 Guengerich FP, Ballou DP & Coon MJ (1976) Spectral
intermediates in the reaction of oxygen with purified
liver microsomal cytochrome P-450. Biochem Biophys
Res Commun 70, 951–956.
Oxyferrous complex of PGIS H C. Yeh et al.
2312 FEBS Journal 275 (2008) 2305–2314 ª 2008 The Authors Journal compilation ª 2008 FEBS
3 Begard E, Debey P & Douzou P (1977) Sub-zero tem-
perature studies of microsomal cytochrome P-450: inter-
action of Fe2+ with oxygen. FEBS Lett 75, 52–54.
4 Eisenstein L, Debey P & Douzou P (1977) P450cam:
oxygenated complexes stabilized at low temperature.
Biochem Biophys Res Commun 77, 1377–1383.
5 Bonfils C, Debey P & Maurel P (1979) Highly purified
microsomal P-450: the oxyferro intermediate stabilized
at low temperature. Biochem Biophys Res Commun 88,
1301–1307.
6 Larroque C & Van Lier JE (1980) The subzero temper-
ature stabilized oxyferro complex of purified cyto-
chrome P450scc. FEBS Lett 115, 175–177.
7 Bec N, Anzenbacher P, Anzenbacherova E, Gorren AC,
Munro AW & Lange R (1999) Spectral properties of
the oxyferrous complex of the heme domain of cyto-
chrome P450 BM-3 (CYP102). Biochem Biophys Res
Commun 266, 187–189.
8 Perera R, Sono M, Raner GM & Dawson JH (2005)
Subzero-temperature stabilization and spectroscopic
characterization of homogeneous oxyferrous complexes
of the cytochrome P450 BM3 (CYP102) oxygenase
domain and holoenzyme. Biochem Biophys Res Commun
338, 365–371.
9 Davydov R, Makris TM, Kofman V, Werst DE, Sligar
SG & Hoffman BM (2001) Hydroxylation of camphor
by reduced oxy-cytochrome P450cam: mechanistic
implications of EPR and ENDOR studies of catalytic
intermediates in native and mutant enzymes. JAm
Chem Soc 123, 1403–1415.
10 Ellerby LM, Nishida CR, Nishida F, Yamanaka SA,
Dunn B, Valentine JS & Zink JI (1992) Encapsula-
tion of proteins in transparent porous silicate glasses
prepared by the sol-gel method. Science 255, 1113–
1115.
11 Wu S, Lin J & Chan SI (1994) Oxidation of dibenzothi-
ophene catalyzed by heme-containing enzymes encapsu-
lated in sol-gel glass. A new form of biocatalysts. Appl
Biochem Biotechnol 47, 11–20.
12 Shibayama N & Saigo S (2003) Oxygen equilibrium
properties of myoglobin locked in the liganded and
unliganded conformations. J Am Chem Soc 125, 3780–
3783.
13 Ray A, Feng M & Tachikawa H (2005) Direct electro-
chemistry and Raman spectroscopy of sol-gel-encapsu-
lated myoglobin. Langmuir 21, 7456–7460.
14 Dantsker D, Samuni U, Friedman JM & Agmon N
(2005) A hierarchy of functionally important relaxations
within myoglobin based on solvent effects, mutations
and kinetic model. Biochim Biophys Acta 1749, 234–
251.
15 Juszczak LJ & Friedman JM (1999) UV resonance
Raman spectra of ligand binding intermediates of sol-
gel encapsulated hemoglobin. J Biol Chem 274, 30357–
30360.
16 Samuni U, Dantsker D, Khan I, Friedman AJ, Peterson
E & Friedman JM (2002) Spectroscopically and kineti-
cally distinct conformational populations of sol-gel-
encapsulated carbonmonoxy myoglobin. A comparison
with hemoglobin. J Biol Chem 277, 25783–25790.
17 Samuni U & Friedman JM (2005) Proteins in motion:
resonance Raman spectroscopy as a probe of functional
intermediates. Methods Mol Biol 305, 287–300.
18 Shibayama N & Saigo S (1995) Fixation of the quater-
nary structures of human adult haemoglobin by encap-
sulation in transparent porous silica gels. J Mol Biol
251, 203–209.
19 Fiandaca G, Vitrano E & Cupane A (2004) Ferricyto-
chrome c encapsulated in silica nanoparticles: structural
stability and functional properties. Biopolymers 74,
55–59.
20 Droghetti E & Smulevich G (2005) Effect of sol-gel
encapsulation on the unfolding of ferric horse heart
cytochrome c. J Biol Inorg Chem 10, 696–703.
21 Smith K, Silvernail NJ, Rodgers KR, Elgren TE, Cas-
tro M & Parker RM (2002) Sol-gel encapsulated horse-
radish peroxidase: a catalytic material for peroxidation.
J Am Chem Soc 124, 4247–4252.
22 Hungerford G, Rei A, Ferreira MI, Suhling K & Tre-
gidgo C (2007) Diffusion in a sol-gel-derived medium
with a view toward biosensor applications. J Phys Chem
B 111, 3558–3562.
23 Shibayama N (1999) Functional analysis of hemoglobin
molecules locked in doubly liganded conformations.
J Mol Biol 285, 1383–1388.
24 Shibayama N & Saigo S (2001) Direct observation of
two distinct affinity conformations in the T state human
deoxyhemoglobin. FEBS Lett 492, 50–53.
25 Gupta R & Chaudhury NK (2007) Entrapment of bio-
molecules in sol-gel matrix for applications in biosen-
sors: problems and future prospects. Biosens Bioelectron
22, 2387–2399.
26 Yeh HC, Hsu PY, Wang JS, Tsai AL & Wang LH
(2005) Characterization of heme environment and
mechanism of peroxide bond cleavage in human prosta-
cyclin synthase. Biochim Biophys Acta 1738, 121–132.
27 Yeh H-C, Tsai A-L & Wang L-H (2007) Reaction
mechanisms of 15-hydroperoxyeicosatetraenoic acid cat-
alyzed by human prostacyclin and thromboxane synth-
ases. Arch Biochem Biophys 461, 159–168.
28 Chiang CW, Yeh HC, Wang LH & Chan NL (2006)
Crystal structure of the human prostacyclin synthase.
J Mol Biol 364, 266–274.
29 Ullrich V & Brugger R (1994) Prostacyclin and throm-
boxane synthase: new aspects of hemethiolate catalysis.
Angew Chem Int Ed Engl 33, 1911–1919.
30 Johnson EF (2003) The 2002 Bernard B. Brodie Award
lecture: deciphering substrate recognition by drug-
metabolizing cytochromes P450. Drug Metab Dispos 31,
1532–1540.
H C. Yeh et al. Oxyferrous complex of PGIS
FEBS Journal 275 (2008) 2305–2314 ª 2008 The Authors Journal compilation ª 2008 FEBS 2313
31 Denisov IG, Grinkova YV, Baas BJ & Sligar SG (2006)
The ferrous-dioxygen intermediate in human cyto-
chrome P450 3A4. Substrate dependence of formation
and decay kinetics. J Biol Chem 281, 23313–23318.
32 Berka V, Yeh HC, Gao D, Kiran F & Tsai AL (2004)
Redox function of tetrahydrobiopterin and effect of
L-arginine on oxygen binding in endothelial nitric oxide
synthase. Biochemistry 43, 13137–13148.
33 Baldwin DA, Marques HM & Pratt JM (1987) Hemes
and hemoproteins. 5: Kinetics of the peroxidatic activity
of microperoxidase-8: model for the peroxidase
enzymes. J Inorg Biochem 30, 203–217.
34 Peterson JA, Ishimura Y & Griffin BW (1972) Pseudo-
monas putida cytochrome P-450: characterization of an
oxygenated form of the hemoprotein. Arch Biochem
Biophys 149, 197–208.
35 Sono M, Perera R, Jin S, Makris TM, Sligar SG, Bry-
son TA & Dawson JH (2005) The influence of substrate
on the spectral properties of oxyferrous wild-type and
T252A cytochrome P450-CAM. Arch Biochem Biophys
436, 40–49.
36 Tuckey RC & Kamin H (1982) The oxyferro complex
of adrenal cytochrome P-450scc. Effect of cholesterol
and intermediates on its stability and optical character-
istics. J Biol Chem 257, 9309–9314.
37 Oprian DD, Gorsky LD & Coon MJ (1983) Properties
of the oxygenated form of liver microsomal cytochrome
P-450. J Biol Chem 258, 8684–8691.
38 Lambeir A-M, Appleby CA & Dunford HB (1985)
The formation and decay of the oxyferrous forms of
the cytochromes P450 isolated from Rhizobium japoni-
cum. Rapid spectral scan and stopped-flow studies.
Biochem Biophys Acta 828, 144–150.
39 Denisov IG, Dawson JH, Hager LP & Sligar SG (2007)
The ferric-hydroperoxo complex of chloroperoxidase.
Biochem Biophys Res Commun 363, 954–958.
40 Lambeir AM & Dunford HB (1985) Oxygen binding to
dithionite-reduced chloroperoxidase. Eur J Biochem
147, 93–96.
41 Tuckey RC & Kamin H (1983) Kinetics of O
2
and CO
Binding to adrenal cytochrome P-450scc. Effect of cho-
lesterol, intermediates, and phosphatidylcholine vesicles.
J Biol Chem 258, 4232–4237.
42 Kashem MA & Dunford HB (1987) The formation
and decay of the oxyferrous complex of beef
adrenocortical cytochrome P-450scc. Rapid-scan
and stopped-flow studies. Biochem Cell Biol 65,
486–492.
43 Bonfils C, Balny C & Maurel P (1981) Direct
evidence for electron transfer from ferrous cyto-
chrome b5 to the oxyferrous intermediate of liver
microsomal cytochrome P-450 LM2. J Biol Chem
256, 9457–9465.
44 Rosen P & Stier A (1973) Kinetics of CO and O
2
com-
plexes of rabbit liver microsomal cytochrome P 450.
Biochem Biophys Res Commun 51, 603–611.
Oxyferrous complex of PGIS H C. Yeh et al.
2314 FEBS Journal 275 (2008) 2305–2314 ª 2008 The Authors Journal compilation ª 2008 FEBS