Morphotectonic analysis of the East Anatolian Fault, Turkey
Bạn đang xem bản rút gọn của tài liệu. Xem và tải ngay bản đầy đủ của tài liệu tại đây (13.3 MB, 17 trang )
Turkish Journal of Earth Sciences
Turkish J Earth Sci
(2018) 27: 110-126
© TÜBİTAK
doi:10.3906/yer-1707-16
/>
Research Article
Morphotectonic analysis of the East Anatolian Fault, Turkey
1,2,
1
2
3
Abdelrahman KHALIFA *, Ziyadin ÇAKIR , Lewis A. OWEN , Şinasi KAYA
Department of Geological Engineering, Faculty of Mines, İstanbul Technical University, İstanbul, Turkey
2
Department of Geology, University of Cincinnati, Cincinnati, Ohio, USA
3
Department of Geomatics, Faculty of Civil Engineering, İstanbul Technical University, İstanbul, Turkey
1
Received: 21.07.2017
Accepted/Published Online: 29.01.2018
Final Version: 19.03.2018
Abstract: The East Anatolian Fault (EAF) is a morphologically distinct and seismically active left-lateral strike-slip fault that extends
for ~400 km and forms the Arabian/Anatolian plate boundary in southeastern Turkey. The EAF together with its conjugate fault,
the North Anatolian Fault, help accommodate the westward escape of the Anatolian plate from the Arabian/Eurasian collision zone.
Morphotectonic features along the EAF provide insights into the nature of landscape development and aid in understanding variations
in tectonic activity and fault evolution. Several geomorphic indices, namely stream length-gradient index, mountain-front sinuosity,
valley width to valley height ratio, basin asymmetry factor, and drainage density, and hypsometric analysis were examined using digital
elevation models. The EAF can be divided into five segments based on its tectonic geomorphology. The stream length-gradient index
values are between 50 and 350 along the five segments. Mountain-front sinuosity varies from 1.01 to 1.46 on the five segments. The
mean ratio of valley floor width to valley height along the studied segments ranges from 0.11 to 1.32, which is well correlated with
the mountain-front sinuosity values. Basin asymmetry factors for 18 catchments range from 1.88 to 26.25 along the study fault zone.
Drainage density values for the studied catchments range from 3.5 to 5.6. Finally, the hypsometric analysis index of the 18 catchments
indicates high, intermediate, and low relative tectonic activity. The results show that all geomorphic indices are remarkably uniform
along the entire length of the fault, thus indicating that fault development was essentially coeval along its length, which supports the
view that the present-day Arabian/Anatolian plate boundary (delimited by the EAF) jumped eastwards from the Malatya-Ovacık Fault
at ~3 Ma. This is in good agreement with the nearly uniform geological offsets and the GPS-determined present-day slip rate of ~10
mm/year along the entire fault.
Key words: Geomorphic indices, morphometric analysis, tectonic geomorphology, East Anatolian Fault
1. Introduction
Analysis of drainage systems and landforms along active
faults provides important insights into fault evolution
and present-day tectonic activity. Numerous field and
laboratory studies have been conducted to examine how
drainage systems evolve along strike-slip faults, uplifting
blocks, and evolving thrusts and folds (Azor et al., 2002; El
Hamdouni et al., 2008; Castelltort et al., 2012; Özkaymak
and Sözbilir, 2012; Ul-Hadi et al., 2013; Yıldırım, 2014;
Tari and Tüysüz, 2015; Topal et al., 2016; Khalifa et al.,
2017; Tepe and Sözbilir, 2017). The distinction between
active and inactive faults can be inferred through detailed
studies of geomorphic indices, including stream lengthgradient index (SL), mountain-front sinuosity (Smf ), valley
floor width to height ratios (Vf ), drainage density (Dd), and
hypsometric integral (Hi) (Owen et al., 1999; Keller and
DeVecchio, 2013). Studies on tectonic geomorphology,
mountain uplift, and drainage development along
*Correspondence:
110
continental-scale strike-slip faults are scarce (e.g., Michael
and Frank, 2013).
The East Anatolian Fault (EAF), a morphologically
distinct and seismically active left-lateral strike-slip fault
that extends for ~400 km, forming a plate boundary
between the Arabian and Anatolian plates in southeastern
Turkey, provides an excellent natural laboratory for the
study of continental-scale strike-slip fault systems (Figure
1). We examined the tectonic geomorphology along
the entire EAF using a number of geomorphic indices
to gain insights into the recent evolution of this plate
boundary and to expand our understanding of the tectonic
geomorphology of continental-scale strike-slip faults. We
determine, e.g., if there is a direction in fault propagation
similar to the North Anatolian Fault (NAF) (which is
from east to west according to Şengör et al., 2014), reveal
along-strike variation in the fault activity, and discuss the
implications for tectonic evolution of the region.
KHALIFA et al. / Turkish J Earth Sci
34˚
34˚E
36˚
38˚
40˚
42˚
N
Nor
th A Eurasia
nato
lian
Faul
t
DF
N
40˚
KTJ
F
Anatolia
MO
EF
40˚
Turkey
SF
lt
au
F
n
lia
o
t
na
A
t
s
Ea
38˚
10 mm/year
35˚
Africa
36˚
MTJ
Dead S
ea Fau
lt
.2
Fig
35˚
38˚
Black Sea
36˚
Turkey
Syria
Cyprus
34˚
Arabia
Bitlis Suture
36˚
38˚
40˚
42˚
35˚
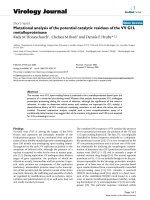
Figure 1. Shaded relief image (data from SRTM-30; Farr et al., 2007) of eastern Turkey showing the African, Arabian, Anatolian, and
Eurasian plates and major active faults (thick black and red lines). Red and blue arrows indicate GPS velocities with respect to a fixed
Arabian plate, with blue and red circles indicating GPS measurements errors, according to Reilinger et al. (2006) and Aktuğ et al. (2016),
respectively. MTJ, Maraş triple junction; KTJ, Karlıova triple junction; DF, Deliler fault; EF, Ecemiş fault; SF, Savrun fault; MOF, MalatyaOvacık fault. The inset map and box with white dashed lines show location of the study area and Figure 2, respectively.
2. Seismotectonic setting
The left-lateral strike-slip EAF extends between the
Karlıova and Maraş triple junctions and connects the NAF
and the Dead Sea Fault in southeastern Turkey to form the
boundary between the Anatolian and Arabian lithospheric
plates (Şengör, 1979; Reilinger et al., 2006), (Figure 1).
Together with the right-lateral conjugate NAF, the EAF
accommodates the westward escape of the Anatolian plate
from the collisional Arabian/Eurasian plate boundary
(McKenzie, 1972; Şengör, 1979). The EAF transform
behavior was first recognized and described by Allen
(1969), and it was mapped by Arpat and Şaroğlu (1972).
The EAF dominated the regional tectonics and seismicity
during the Quaternary in central Turkey and has been
examined by many researchers (Arpat and Şaroğlu, 1975;
McKenzie, 1976, 1978; Jackson and McKenzie, 1984;
Dewey et al., 1986; Muehlberger and Gordon, 1987;
Westaway, 1994; Westaway and Arger, 1996; Reilinger et
al., 2006; Duman and Emre, 2013; Aktuğ et al., 2016; Yönlü
et al., 2017). Fault-controlled catchments along the EAF
contain Pliocene lignite. The age of the lignite brackets
the onset of fault activity to between the late Miocene
and earliest Pliocene (Arpat and Şaroğlu, 1972; Hempton,
1985; Şengör et al., 1985; Dewey et al., 1986).
111
KHALIFA et al. / Turkish J Earth Sci
The estimates of the accumulated overall offset along
the EAF vary between an upper range of 27–33 km that
is recorded by geological features and the length of the
Gölbaşı strike-slip basin (Westaway and Arger, 1996; Bulut
et al., 2012) and a lower range of 15–22 km that is defined
by drainage channel offsets on individual fault segments
(Hempton, 1987; Bulut et al., 2012). Studies based on the
geologic and geomorphic data along the EAF provide slip
rates of between 6 and 11 mm/year (Arpat and Şaroğlu,
1975; Kiratzi, 1993; Westaway, 1994; Yürür and Chorowicz,
1998; Çetin et al., 2003; Aksoy et al., 2007; Herece, 2008;
Duman and Emre, 2013, Yönlü et al., 2013), whereas GPS
studies provide a constant slip rate of ~10 mm/year along
the whole EAF (Reilinger et al., 2006; Mahmoud et al.,
2013; Aktuğ et al., 2016).
The Malatya and Ovacık faults located to the north of
the EAF are secondary structures with left-lateral sense
of slip within the study region. Koçyiğit and Beyhan
(1998) and Kaymakcı et al. (2006) considered the different
segments of the Malatya and Ovacık fault to be part of the
Malatya-Ovacık Fault Zone (MOFZ) (Figure 1), whose
present-day activity is debated by Jackson and McKenzie
(1984), Westaway and Arger (1996, 2001), Koçyiğit and
Beyhan (1998), and Kaymakcı et al. (2006). Westaway
and Arger (2001) interpreted the SW- and SSW-trending
segments of the MOFZ as transform faults and argued for
~240 km left-lateral along the MOFZ, making it one of the
major fault zones in eastern Turkey. Based on the geometry
of the former Erzincan triple junction, which differs from
the modern Karlıova triple junction, Westaway and Arger
(2001) suggested that the MOFZ is no longer active.
Some researchers, e.g., Jackson and McKenzie (1984) and
Westaway and Arger (1996, 2001), stated that the EAF was
initiated and at the same time the significant movement of
the MOFZ ceased at the end of the Early Pliocene (~3 Ma).
In contrast, Koçyiğit and Beyhan (1998) and Kaymakcı et
al. (2006) claimed that the MOFZ is still active.
The evolution of the Euphrates River, offset by the
EAF, can be summarized as follows. After activity along
the MOFZ ceased, lacustrine sedimentation smoothed
out the surface relief, leaving a subdued topographic low
along the line of the MOFZ. Then drainage started to
develop along the length of the MOFZ to form the modern
Euphrates gorge that crosses the EAF, which now provides
the outlet from the Malatya basin (Westaway and Arger,
2001). The Euphrates River was then offset ~13 km by the
EAF. However, the total slip on this strand is debated, with
estimates up to ~30 km (Westaway, 1994; Westaway and
Arger, 2001). Westaway and Arger (2001) argued that the
modern Euphrates River began to form at ~1.3–3 Ma, with
the assumption that the majority of the gorge development
occurred in the last 1 Ma. Thus, a long-term slip-rate for
the EAF of ~8.3 mm/year is based on the offset of the
Euphrates River for the past 3 Ma (Herece and Akay, 1992).
112
Movement of the EAF produces large earthquakes,
which seem to occur along the fault every few hundred
years in various places, within relatively short paroxysmal
periods of large events (Ambraseys, 1988). Recently, the
most significant and destructive earthquake occurred on
22 May 1971 near Bingöl with Mw of 6.6 and focal depth of
~10 km (Taymaz et al., 1991).
Recent seismicity was studied by Bulut et al. (2012),
who identified normal and thrust faulting events in all
segments of the EAF and stated that the orientations of
the nodal planes of the focal mechanisms of these events
indicate off-fault subsidiary fault segments that fit to the
overall EAF kinematics. Bulut et al. (2012) suggested that
the mechanisms of the EAF are compatible with thrust
and normal faulting events, depending on the trend of the
respective earthquakes hypocenters.
3. Segmentation of the East Anatolian Fault
Segmentation of the EAF has been examined by many
researchers. Hempton et al. (1981), e.g., classified the EAF
into 5 segments according to the variations in trend and
geometry of the fault. Barka and Kadinsky-Code (1988)
suggested 14 segments between Karlıova and Türkoğlu
based on geometric discontinuities, surface ruptures, and
seismicity. Şaroğlu et al. (1992a) recorded six segments
based on changes in strike of the fault trace. Duman and
Emre (2013) divided the main strand of the EAF into 13
segments based on fault jogs and abrupt changes in the
strike of the fault trace. According to Duman and Emre
(2013), the EAF can be divided into five segments between
Karlıova and Türkoğlu, which from east to west are named
Karlıova (Karlıova–Bingöl), Palu (Palu–Sivrice), Pütürge
(Sivrice–Çelikhan), Erkenek (Çelikhan–Gölbaşı), and
Pazarcık (Gölbaşı–Türkoğlu), which we call segments 1
through 5 (Figure 2).
Left-lateral faulted landforms, such as displaced
streams, are common along segment 1 (Karlıova). In two
areas, north of Sakaören and south of Serpmekaya (Figure
3a), the fault traverses alluvial plains and fans, and fresh
fault scarps are evident along its length (Duman and
Emre, 2013). In this segment, streams are left-laterally
offset by several to a few hundred meters (Herece, 2008).
This includes a 3.5-m-horizontal left-lateral offset of the
fault trace recorded by Ambraseys and Jackson (1998)
some 1 km southeast of Boncukgöze (Figure 3a). This is
probably a surface rupture of the Mw 7.1 1866 earthquake.
The Karlıova segment contains the Gökdere bend, which
is a large right step within the EAF zone that has produced
a push-up hill. The eastern and western parts of the step
have NE-SW and E-W trending folds, thrusts, and strikeslip faults (Duman and Emre, 2013). A series of thrust
faults occur in the southern part of the push-up structure
(Duman and Emre, 2013).
KHALIFA et al. / Turkish J Earth Sci
Figure 2. Segmentation of the East Anatolian Fault following Duman and Emre (2013); active faults are from Emre et al. (2013). Purple
hexagons indicate the location of the Karlıova and Maraş triple junctions. Blue lines show the main rivers and streams (e.g., Euphrates
River).
Segment 2 (Palu) stretches for 77 km. The last historical
earthquake on this segment occurred on 3 May 1874 with
Mw of 7.1 (Ambraseys, 1988; Ambraseys and Jackson, 1998)
(Figure 3b). The human damage was greatest between Lake
Hazar and Palu (Ambraseys, 1988). East of Lake Hazar,
Herece (2008) reported a 2.6-m-lateral offset along the
rupture zone, and Duman and Emre (2013) suggested the
average displacement of the 1874 earthquake to be 3.5 ± 0.5
m in the central part of the Palu segment. The Lake Hazar
basin sits astride the active trace of the EAF, and the basin is
bounded by normal faults to the north and south (Moreno
et al., 2010).
The EAF traverses mountains terrain and follows linear
valleys along segment 3 (Pütürge; Figure 3c), where it cuts
Paleozoic-Mesozoic metamorphic and Mesozoic ophiolite
mélange and volcanosedimentary rocks (Hempton,
1985; Herece and Akay, 1992; Herece, 2008). Ambraseys
(1988) suggested that the 1875 (Mw 6.8) and 1905 (Mw 6.9)
earthquakes were generated along this segment.
Segment 4 (Erkenek) extends northwards from Lake
Gölbaşı. This segment is characterized by late Pleistocene
and Holocene left-lateral displaced streams with offsets
ranging from several meters to 500 m (Duman and Emre,
2013). One particular stream, the Göksu River, is offset by
~13 km (Şaroğlu et al., 1992a, 1992b) (Figure 3d), which
yields a Quaternary slip rate of ~6.5–8.3 mm/year (Herece,
2008; Duman and Emre, 2013). The northern margin of the
Gölbaşı basin is bounded by normal faults. These faults are
relatively short (3–10 km in length), discontinuous, and
slightly curved and dip to the south trending N72°E within
a 3-km-wide zone (Duman and Emre, 2013). Varying
geologic offsets have been recorded that range from 19 to 26
km. Several fault-related basins, e.g., the Hazar and Gölbaşı
basins, are present along segment 4. The Gölbaşı basin is the
largest basin along the EAF (Yönlü et al., 2013). Yönlü et al.
(2013) examined the geology and geomorphology around
the Gölbaşı basin and argued that there was a wide river
valley in which the Aksu River flowed and was later blocked
by a landslide at 31.6 ± 0.5 ka. They concluded that as a result
of this obstacle, the Aksu River changed its course and was
left laterally offset by the EAF by ~16.5 ± 0.5 km. This is the
largest recorded geomorphic offset along the EAF.
A Holocene slip rate of 9 mm/year has been determined
using tectonics and GPS measurements along segment 5
(Pazarcık) (Yalçın, 1979; Meghraoui et al., 2006; Westaway
et al., 2006; Herece, 2008; Karabacak et al., 2011) (Figure
3e). Yönlü et al. (2012) suggested a 5 ± 0.5 mm/year slip rate
for the Pazarcık segment based on the paleoseismological
data. Duman and Emre (2013) suggested that the surface
ruptures on segment 5 are due to the AD 1114 and 1513
earthquakes. This segment of the EAF includes the Gölbaşı
basin that formed in a releasing step-over and is marked by
a 15° change in the dominant fault trace.
4. Methodology
ArcGIS software and a 30-m resolution digital elevation
model (DEM) extracted from a Shuttle Radar Topography
Mission (SRTM) were used for topographic analysis along
the entire length of the EAF (Farr et al., 2007). Geomorphic
indices were applied along the EAF within a zone of ~30
km on both sides of the fault trace. The hill-shade option in
ArcGIS was used to analyze the mountain-front sinuosity.
Hydrology and raster calculation tools were used to construct
and classify catchments that had stream greater than the
fourth order using the stream order scheme of Strahler
(1952) (Figure 4). The catchments, watershed delineation,
catchments sizes, and river drainage pattern were extracted
from the digital elevation data using algorithms available
in the hydrology toolbox of ArcGIS. The catchments were
numbered from 1 to 18 from east to west (Figure 4). The
resolution of the DEM limited the degree of uncertainty
associated with the geomorphic indices. We do not assign an
uncertainty to our geomorphic indices as in other studies
(e.g., El Hamdouni et al., 2008; Tari and Tüysüz, 2015).
113
KHALIFA et al. / Turkish J Earth Sci
N
0
Karataş H.
5Km
NA
a
F
BİNĞÖL
KARLIOVA
Y
Alatepe
Sudurağı
Kartaledere
Gökçe M.
Sakaören
ekaya
Hasanova
Ziyaret H.
N
5Km
Serpm
0
Boncukgöze
Ulu Ova
b
GÖYNÜK
Hacılar X
Halil M.
Kıraçtepe
ILICA
Sarıcan
Payamlı
Uzunova
KartaldereKumyazı Örencik
Lake Hazar
Yaylım M.
Hazar
Ulu Ova
Bey M.
s
rate
h
Eup
Şakşak M.
Y
Yazıca
Medan M.
X
Soğukpınar
USLU
Hazar M.
0
Boruk M.
0
5Km
Kartaldere
Lake Hazar
tes R.
TEPEHAN
SİNCIK
d
PÜTÜRGE
ra
Euph
Koçali
Kalaba
Örmeli
DOĞANYOL
Arıkonak
YARPUZLU
Gözeli
Kamışlık M.
R.
Karlık M.
Burun M.
Gözeler
Akdağ
Küp M.
Uluköy
ÇELİKHAN
BİNGÖL Ekinyolu
Karaömer M.
GÖKDERE
Genç
Keklik M.
c
ILICA
Palu
Orta H.
Gezin
Soğukpınar
Gökdere M.
Yamaçova
Kayalık H.
Mastar M.
SIVRICE
Gezin
Hazar
Yaylım M.
N
5Km
N
Kalecik
Kapıdere
Y
Arık M.ERKENEK
GÖKSU R.
X
HARMANLI Cankara
Balker GÖLBAŞI
Burun M.
Akdağ M.
Tut
.
Bozlar
Tevekkelli
Çiğli
Çamlıca
Kartal
Abbaslar
PAZARCIK
Narlı
Emirler
0
Akpınar
Soku X
Belören
Kısı
Yeniyurt
Nogaylar
Y
GÖLBAŞI
Sakarkaya
k C.
Kuyumcular
k C.
TÜRKOĞLU
Kısı
Ardıç M.
Gökçay
Beşenli
RR
Altınova
YARPUZLU
Uzunköy
AK
SU
e
ÇELİKHAN
Kuruçova
R.
Beşkoz
Güzelköy
Tucak M.
GÖKSU
Çelikköy
Aksa
Karlık M.
5Km
N
Haydarlı
Taşdemir
Göl M.
Eyerli
left lateral strike-slip fault
reverse or thrust fault
syncline
normal fault
East Anatolian Fault
anticline
Figure 3. Details of segments 1 through 5 along the EAF: (a) 1- Karlıova, (b) 2- Palu, (c) 3- Pütürge, (d) 4- Erkenek, and (e) 5- Pazarcık
segments of the East Anatolian Fault modified after Duman and Emre (2013). NAF, North Anatolian Fault; M, mountain; H, hill; C,
creek; ʻxʼ and ʻyʼ denote piercing points.
114
KHALIFA et al. / Turkish J Earth Sci
Figure 4. Studied catchments along the East Anatolian Fault Zone.
4.1. Geomorphic indices
4.1.1. Rock strength
The aim of our study was to evaluate the morphotectonic
indices of the fault depending on the rocks’ strength along
the mountain front of the fault deformation zone and
recognize the rock resistance based on geological maps, field
observations, and similar papers (e.g., El Hamdouni et al.,
2008; Alipoor et al., 2011; Selçuk, 2016). We consider rock
hardness as Selby (1980) did, with strength related to the
constituent material and cement assisting in the resistance
to weathering and erosion processing. Rock strength is
classified as very low (silt, sand, marl, alluvium, limestone),
low (conglomerate, sandstone, shale with interbedded
limestone), medium (sandy limestone), high (basalt), or
very high (gneiss, schist, gabbro, marble, quartzite).
4.1.2. Stream length-gradient index (SL)
The SL index is sensitive to channel slope, which, in turn,
can be used as a proxy for tectonic activity, stream power,
and/or rock resistance. Erosional resistance of rocks and
relative intensity of active tectonics can be evaluated
using SL by calculating changes of stream gradients along
drainage catchments (Hack, 1973; Keller and Pinter, 2002).
The SL index is defined as:
(1)
SL = (ΔH / ΔL) × L ,
where ΔH/ΔL is the channel gradient for a stretch of the
stream (ΔH is the elevation change for a particular channel
reach with respect to ΔL, i.e. the length of the reach) and
the total channel length L from the midpoint of the reach
where the index is calculated upstream of the drainage
divide. The SL index is generally calculated for a large
number of reaches along major streams within a study area
(Azor et al., 2002). SL values were calculated every 100 m
along the length of the main stream channels of the EAF.
4.1.3. Mountain-front sinuosity (Smf )
Smf helps define the relationship between the total length
and the straight-line distance along a mountain front (Bull,
1977; Azor et al., 2002; Keller and Pinter, 2002). This index
helps explore links between tectonics and erosion, and it is
defined as:
(2)
Smf = Lmf / Ls ,
where Lmf is the length of the mountain front and Ls is
its straight-line length. Smf values were calculated for 18
mountain fronts along the 5 segments of the EAF from the
SRTM 30-m pixel-resolution DEM. Smf values approaching
1 suggest a more active tectonic setting.
4.1.4. Valley width to height ratio (Vf )
Vf defines the differences in valley shape and may reflect
the degree of active uplift and/or base level fall, and it is
defined as:
Vf = 2Vfw / [(Eld ̶ Esc) + (Erd ̶ Esc)],(3)
where Vfw is the width of the valley floor, Erd and Eld are
respectively the elevations of the right and left valley
divides, and Esc is the average elevation of the valley floor
(Keller and Pinter, 2002).
Azor et al. (2002) suggested that high values of Vf
usually indicate low tectonic activity, whereas low values
115
KHALIFA et al. / Turkish J Earth Sci
indicate areas of high tectonic activity with relatively
rapid uplift and valley incision. Vf values were calculated
at a prescribed distance (1 to 3 km) from the mountain
front based on the size of the drainage regions (Silva et al.,
2003). Vf values were determined for 77 streams aligned
along the mountain fronts of the EAF.
4.1.5. Basin asymmetry factor (AF)
AF may be utilized to help detect tectonic tilting from
drainages that transverse a structure and is defined as:
AF = 100 (Ar / At),
(4)
where Ar is the area of the drainage basin to the right of
the main stream and At is the total area of the basin. AF is
sensitive to tilting perpendicular to the trend of the main
stream. An AF of 50 represents a tectonically stable setting,
while values smaller or greater than 50 suggest tilting
and indicate that a basin is tectonically active (Keller
and Pinter, 2002). Values of AF include the AF-50, which
is the difference amount between the neutral value of 50
and the observed value (El Hamdouni, 2008). An absolute
difference (difference from an AF of 50) is necessary to
evaluate the relative tectonic activity. We categorize the
absolute values of AF into class 1 (│AF-50│> 15), class
2 (│AF-50│: 7–15), and class 3 (│AF-50│< 7) following
the method of El Hamdouni (2008). El Hamdouni (2008)
classified the average of the different classes into four
activity levels, where level 1 is very high relative tectonic
activity (1 to 1.5), level 2 indicates highly relative tectonic
activity (>1.5 to ≤2), level 3 is moderately relative active
tectonics (>2 to ≤2.5), and level 4 is the lowest level of
relative tectonics (>2.5). AF values were calculated for the
18 catchments along the EAF.
4.1.6. Drainage density (Dd)
Azor et al. (2002) and Keller and Pinter (2002) introduced
Dd as the ratio of total channel length versus catchment
area. Greater values of Dd suggest more extensively
developed regions for a relatively long time, while regions
experiencing the most recent tectonic activity have lower
Dd values (Keller and Pinter, 2002). Dd is defined as:
Dd = L / A ,
(5)
where L is the length of the channel and A is the catchment
area. Dd was defined along the EAF throughout 18
catchments.
4.1.7. Hypsometry
The hypsometric integral (Hi) is a quantitative measure
of the distribution of elevation within a catchment
(Langbein, 1947; Strahler, 1952). This index serves to
compare catchments and is an expression of the volume of
the catchment that has not been eroded. Simply expressed,
the Hi index (Pike and Wilson, 1971; Mayer, 1990) is
defined as:
Hi = (Emean – Emin) / (Emax – Emin),(6)
116
where Emean is the mean elevation, Emax is the maximum
elevation, and Emin is the minimum elevation.
The hypsometric curve of a catchment is the
cumulative area versus elevation plot, which likely reflects
the dominant geomorphic processes operating in the
catchment. A convex curve indicates uplift with dominant
hillslope processes, such as sliding and soil creep, while a
concave curve indicates channelized/linear/fluvial/alluvial
processes. In essence, young catchments (tectonically
active) have Hi values of ≥0.45 and convex hypsometric
curves, whereas low Hi values (≤0.3) and concave
hypsometric curves indicate old catchments (tectonically
quiescent). Hi values were calculated for 18 catchments
along the EAF.
5. Results
5.1. Rock strength
The mountain front along the EAF consists of large varieties
of rocks. The geological units of the studied catchments
comprise basalt, volcanic rocks, gabbro-diabase, carbonate
rocks, marble, gneiss and schist, neritic limestone, and
undifferentiated Quaternary rock and sediment (Figure
5a) that imply the presence of all rock strength levels. This,
in turn, minimizes the effect of lithology on the calculated
morphometric indices. Very high and low strength rocks
mostly are exposed along segment 3. Segments 1 and 4
include high and moderate rock strengths. The mountain
fronts along segments 1, 2, and 5 are made up of moderate,
low, and very low strength of rocks. In the central part of
the EAF, segments 3 and 4 comprise rocks with high rock
strengths (Figure 5b).
5.2. Stream length-gradient index (SL)
SL values range from 50 to 350 along the stream channels
of the fault zone (Figure 5b). The lowest index values are
along the upstream reaches of the drainage catchments,
while the highest values are located across the mountain
fronts. The SL values show some low values when flowing
parallel to the valleys that were likely produced by the fault.
SL values increase toward the mountain fronts (Figure
5b). The highest values of the index are also recorded in
most catchments that are not associated with particularly
resistant rocks. Anomalous values of the SL index are
noticed along the five segments.
5.3. Mountain-front sinuosity (Smf )
The five segments, from east to west, have Smf values of
1.07–1.17, 1.05–1.46, 1.06–1.09, 1.01–1.09, and 1.07–1.28
(Figure 6; Table 1). The lowest Smf values are associated
with segments 3 and 4, while the highest values are for
segment 2. The Smf values show that each segment reflects
topographic signals of active uplift and all fault segments
are active along the EAF. On the basis of the similar Smf
values there is no obvious change in tectonic activity along
the EAF.
KHALIFA et al. / Turkish J Earth Sci
Figure 5. (a) Geological map of the EAF (extracted from the geological maps catalogue of the General Directorate of Mineral Research
and Exploration of Turkey), (b) SL index along the channels and rock strength level (according to El Hamdouni, 2008) of the studied
fault. Yellow stars indicate the distribution of the SL index anomalies.
5.4. Valley width to valley height ratio (Vf )
The Vf index is calculated for the main valleys and streams
that cross and run parallel to the mountain fronts of the
studied zone (Figure 6). Vf values vary depending on rock
type, stream discharge, and catchments sizes. From east to
west, mean Vf values are 0.47–0.75, 0.61–1.32, 0.24–0.61,
0.11–0.37, and 0.54–0.80 for the five segments (Figure 6;
Table 1). The lowest mean values are for segment 4, while
the highest values are for segment 2. The results suggest a
general similarity between Smf and mean Vf values of the
five segments. The Vf values’ consistency with Smf might
give a good signal to evaluate the tectonic activity of the
segments.
5.5. Basin asymmetry factor (AF)
AF-50 values range from 1.88 to 26.25, which indicates
the differences between the observed value of 50 and the
neutral value (Table 2). The results show that catchments
7, 4, and 17 have values close to 50 and the catchments
that have the highest values away from 50 are 2 and 15
(Table 2). Within the study area, AF index classes were
applied to record class 1 of the relative tectonic activity for
catchments 2, 8, 9, 11, 13, 15, and 16; class 2 was examined
for catchments 3, 6, 10, 12, 14, and 18; and relative tectonic
activity class 3 was measured for catchments 1, 4, 5, 7, and
17 (Table 2).
5.6. Drainage density (Dd)
Dd varies from 3.5 to 5.6 km/km2 (Table 2). Catchment
4 has the highest Dd, while the lowest values are for
catchments 11 and 13. The catchments in general have
a remarkably low Dd, and most drainages reflect deep
incision. The average Dd of the catchments is low in
segments 3 and 4.
5.7. Hypsometry (Hi)
Hi values range from 0.25 to 0.58. High values of the
Hi index are recorded for catchments 8 and 7, which
generally indicate that not as much of the uplands have
been eroded and suggests younger catchments and
landscape, most probably created under active tectonics
conditions. Catchment 2 has the lowest Hi values, which
is probably due to a relatively older landscape with more
erosion and less subjected by recent active uplifting. The
hypsometric index data suggest that the middle part of
the EAF is slightly more active than the rest of the fault
and has the youngest catchments, albeit only slightly
younger. Similarly, Hi curves recorded (1) convex curves
in catchments 11, 12, 13, and 16; (2) concave-convex or
slight curves in catchments 1, 2, 3, 5, 6, 7, 9, 10, 14, 15,
17, and 18; and (3) concave curves for catchments 2 and
5 (Figure 7).
5.8. Average of the geomorphic indices
The mean Smf, Vf, and Dd values gradually increase from
segment 4, 3, 1, and 5 to 2 (Table 3). Segments 3 and 4 have
level 1 relative tectonic activity, while segments 1 and 5 have
level 2 relative tectonic activity and segment 2 has a relative
tectonic activity level of 4 (Table 3). Hi values gradually
decrease from segment 4, 3, 5, and 1 to 2 (Table 3).
117
40° 20' E
40° 40' E
41° 00' E
Karlıova
39° 10' N
NAF : North Anatolian Fault
EAF : East Anatolian Fault
Vf locations
39° 00' N
39° 00' E
S1b
S1c
C3
d
S1
±
m
C1
38° 50' N
Bingöl
0
38° 30' E
c
39° 00' E
10
2830
982
20
Km
C7
ar
Haz
e
Lak
Sivrice
F
C10
Çelikhane
S3b
40° 00' E
40° 30' E
C4
C5
AF
E
C7
Sivrice
S2b
S2d
zar
Palu
S2a
m
S2c
e Ha
Lak
2575
±
C6
0
787
10 20
Km
38° 00' E
37° 30' E
C11
C6
S3a
C8
±
m
2598
C11
S3c
0
Çelikhane
S4b
C13
Gölbaşı
S4a
m
S4c
0
37° 00' E
±
10
20
Km
2598
497
37° 30' EGölbaşı
F
37° 40' N
EA
C14
S5a
37° 30' N
37° 20' N
EAF
C12
495
10 20
Km
e
37° 10' N
38° 30' E
d
38° 00' N
C9
EA
39° 30' E
b
39° 30' E
37° 50' N
38° 00' N 38° 10' N 38° 20' N 38° 30' N 38° 40' N
S1a
F
EA
C2
NAF
38° 20' N 38° 30' N 38° 40' N 38° 50' N
a
38° 10' N
39° 20' N
KHALIFA et al. / Turkish J Earth Sci
C15
S5b
C17
S5c
o
rk
Tü
S5d
ğlu
±
m
C16
2464
C18
0
10
416
20
Km
Figure 6. (a) Karlıova (b), Palu (c), Pütürge (d) Erkenek, (e) Pazarcık segments on top of colored shaded elevation image.
6. Discussion
6.1. Relative tectonic activity based on geomorphic
indices
Many studies have used the combination of indices Smf
and Vf to present a preliminary overview of the relative
tectonic activity of the fault mountain fronts (Bull and
McFadden, 1977; Silva et al., 2003; Yıldırım, 2014). In our
study, there is general uniformity between Smf values and
Vf mean values of the five fault segments along the EAF.
Our Smf values suggest that all fault segments are young
and active along the fault, and that each segment is likely
undergoing tectonic uplift. The highest value of Smf (low
tectonic activity) is associated with segment 2, while the
lowest values are for segments 4 and 3 (high tectonic
activity), which indicates a straighter mountain front than
118
the others. The highest degree of tectonic uplift occurs in
segment 4 and this is consistent with the view of Yönlü
et al. (2013), who discussed the presence of the largest
morphological offset of the EAF along the same segment.
Vf values suggest continued and comparatively high
uplift rates along the EAF. Lower values in the central
valleys suggest a higher uplift and incision rate than in the
southern and northern parts of the EAF. Keller and Pinter
(2002) suggested that Smf values of 1.0–1.6 are indicative
of active range-bounding fault zones. Some studies, e.g.,
those of Bull and McFadden (1977) and Rockwell et al.
(1984), constructed a diagram for the Smf and Vf values,
showing the distribution of these index values along
streams and mountain fronts (Figure 8). They plotted the
Smf with Vf values in the same diagram to classify relative
KHALIFA et al. / Turkish J Earth Sci
Table 1. Values of the mountain-front sinuosity and valley floor
width to height ratio of measurements (see locations in Figure 4).
Mountain front
Smf
Vf (mean)
S1a
1.08
0.74
S1b
1.17
0.75
S1c
1.07
0.47
S1d
1.13
0.65
S2a
1.39
0.61
S2b
1.44
1.32
S2c
1.46
0.64
S2d
1.05
0.64
S3a
1.08
0.30
S3b
1.09
0.61
S3c
1.06
0.24
S4a
1.09
0.11
S4b
1.01
0.21
S4c
1.03
0.14
S4d
1.04
0.37
S5a
1.28
0.80
S5b
1.15
0.54
S5c
1.07
0.75
S5d
1.08
0.67
tectonic activity into 3 classes and detect a relative tectonic
activity degree. Smf versus Vf plots show that all segments
are indicative of the highest tectonic activity, i.e. Class I
(Figure 8). Class 1 is commonly associated with uplift
rates between 0.05 and 0.5 mm/year (e.g., Rockwell et al.,
1984; Yıldırım, 2014). Although all the EAF segments are
plotted as a higher activity class, they reveal differences in
relative tectonic activity values. From high to low, these are
segment 4, 3, 1, 5, and 2. The results show slight differences
and nearly uniform values of Smf along the entire fault,
implying that the tectonic activity along the whole EAF
zone is nearly the same. This is also consistent with the
published uniform slip rate of ~10 mm/year along the
whole EAF based on GPS measurements (Reilinger et al.,
2006; Mahmoud et al., 2013; Aktuğ et al., 2016). The SL
values over the study region calculated from the DEM and
GIS software are shown in Figure 5b, which illustrates the
relationship between SL values and the underlying geology.
Over most of the studied catchments rivers, the SL values
increase abruptly in the same rock type (Figure 5b), except
rivers over catchment 5. Over this catchment the rock
strength changes alternately from very low to moderate,
where SL values of catchment streams increase. In such
a case, Yıldırım (2014) argued that the effect of the rock
strength is small on the increase of values of SL in the same
rock strength along the rivers. El Homdouni et al. (2008),
Alipoor et al. (2011), and Azañón et al. (2012) presented
anomalous values of the SL index for the high SL values that
are not associated with resistant rocks and they interpreted
these anomalous values as tectonic signals. Within our
study zone, anomalous measurements are recorded along
nearly all segments, which reflects high uplifting activities.
The SL results are also greater on both sides of the fault,
which indicates recent and continued uplift along the EAF.
In our study, SL values increase abruptly in the same rock
units and we detected many anomalous spots along all
segments that likely reflect tectonic signals. In addition to
the previous remarks, we found that nearly all catchments
have the same varieties of rock strength types. Based on
these conditions, we assume that the impact of the geology
is negligible and tectonic impact is prevailing. Based on the
uniformity of the climatic conditions along the whole fault
zone, the SL index results that generally reflect both rock
strength and climate and drainage development and local
geomorphology that are affected by the tectonic uplifting
and regional deformation suggest that climate does not
have a highly significant impact on the studied deformation
zone.
The AF factor is sensitive to change in catchment
inclination perpendicular to the mean channel direction (El
Hamdouni et al., 2008). Structural control of the bedding
orientation may play a great role in the development of basin
asymmetry (Alipoor et al., 2011). Except for catchments 1,
4, 5, 7, and 17 (tectonically more stable), the AF values for
all catchments indicate tilting and relative active tilting/
uplifting. Catchments 2, 5, and 12 are located in the studied
deformation zone but they are still away from the EAF fault
trace. According to El Hamdouni (2008), the mean values
of AF differentiate the segments into three levels of tectonic
activity. Segments 3 and 4 were defined by the first level
of the relative tectonic uplifting that reflects the highest
tectonic activity, segments 1 and 5 show the second level of
uplifting, and the third level that reflects the lowest degree
of tectonic uplifting was recorded for only segment 2.
Values of Dd help define the degree to which drainage
development has dissected a structural landform
(Melosh and Keller, 2013). Topal et al. (2016) assumed
that low Dd values characterize drainages that are nearly
straight and have steep channels that characterized the
catchments with recent movement activity. Catchments
4, 5, 14, and 15 are located away from the fault trace and
likely have less tectonic uplift than the other catchments
that have lower Dd values. Overall, segment 4 has the
lowest Dd value and reflects relatively higher uplift than
segment 2 that has the highest Dd value. Hi does not
relate directly to relative active tectonics (El Hamdouni
et al., 2008). Hi values are affected by the rock strength
119
KHALIFA et al. / Turkish J Earth Sci
Table 2. Asymmetry factor (AF), drainage density (Dd), and hypsometric integral (Hi) of the different catchments of the
study area.
Catchments
AF
AF-50
AF (Class)
Dd
Hi
C1
C2
C3
C4
C5
C6
C7
C8
C9
C10
C11
C12
C13
C14
C15
C16
C17
C18
44.76
76.25
59.93
47.73
54.29
57.82
48.12
66.83
67.88
58.67
66.39
44.14
28.04
59.90
70.00
32.28
53.80
37.85
–5.24
26.25
9.93
–2.27
4.29
7.82
–1.88
16.83
17.88
8.67
16.39
–5.86
–21.96
9.90
20.00
–17.72
3.80
–12.15
3
1
2
3
3
2
3
1
1
2
1
2
1
2
1
1
3
2
4.1
4.5
4.7
5.6
4.9
4.8
4.6
4.2
3.9
4.1
3.5
4.3
3.8
5.0
4.9
4.3
4.1
4.0
0.45
0.48
0.47
0.27
0.33
0.36
0.25
0.54
0.45
0.48
0.56
0.51
0.58
0.41
0.45
0.53
0.40
0.46
0.9
a
C11
C12
C13
C16
0.8
0.7
0.7
0.5
0.4
0.3
0.2
0.1
b
C9
C10
C14
C15
C17
C18
Height
0.6
Height
0.4
C1
C2
C3
C5
C6
C7
0.8
0.6
0.5
0.9
0.3
0.2
a
0.1
0.2
0.3
Cumulative area
0.4
0.5
0.6
0.7
0.8
0.9
0.1
b
0.1
0.2
0.3
Cumulative area
0.4
0.5
0.6
0.7
0.8
0.9
c
0.9
0.8
C4
C7
0.7
0.5
0.4
Height
0.6
0.3
0.2
0.1
c
0.1
0.2
0.3
Cumulative area
0.4
0.5
0.6
0.7
0.8
0.9
Figure 7. Hypsometry curves of 18 catchments along the EAF shown in Figure 4. (a) Convex hypsometric catchments (weakly eroded
catchments), (b) convex-concave hypsometric catchments (moderately eroded catchments), and (c) concave hypsometric catchments
highly eroded catchments).
120
KHALIFA et al. / Turkish J Earth Sci
Table 3. Mean morphometric parameters of the studied segments and catchments.
Segments
Smf
Vf
Catchments
Mean AF
(class)
AF activity
degree
Mean Dd
Mean Hi
Segment 1
1.11
0.67
C1, C2, and C3
2.00
2
4.43
0.46
Segment 2
1.34
0.75
C4, C5, C6, and C7
2.75
4
4.97
0.31
Segment 3
1.07
0.38
C6, C8, C9, C10, and C11
1.40
1
4.12
0.48
Segment 4
1.04
0.21
C11, C12, and C13
1.30
1
3.86
0.55
Segment 5
1.15
0.74
C14, C15, C16, C17, and C18
1.80
2
4.47
0.45
0.5
3
Class II
Moderate
2.5
0.05 U(mm/a)
Class III
Low
2
1.5
S4
0.5
S3
S5
S1
S2
1
Class I
High
0
0.5
1
2.5
1.5
2
Mountain-front sinousity (Smf ) values
3
Figure 8. Plot of Smf versus Vf for the mountain fronts of each
segment and inferred activity classes. Vertical bars show the
standard deviation for Vf values. Numbers at the top indicate
inferred uplift rates U (mm/year) from Rockwell et al. (1984).
(El Hamdouni et al., 2008). Hi index values that indicate
high tectonic uplift rates and are characterized by convex
curves are evident for catchments in segments 3 and 4,
while Hi values show a low rate of tectonic uplifting with
concave curves in catchments 4 and 7, which are located
away from the fault trace (Figure 7; Table 2).
Average values of Hi decrease gradually from segments
4, 3, 1, and 5 to 2 (Table 3). The results suggest that all
the catchments along segments 4 and 3 are young and
have relatively high rates of uplift compare to the other
segments.
In conclusion, the geomorphic indices suggest that
all the segments along the EAF are highly active (class 1)
and have similar uplift rates. The catchments that are away
from the EAF show intermediate to low degrees of tectonic
activity and that reflects the rate of uplifting and tectonic
decreases away from the fault trace.
6.2. Implications of long-term deformation patterns
The EAF accommodates most of the relative movement
of the Arabian and Anatolian plates (Duman and Emre,
2013). Variations of the Smf and Vf, indices (Figures 8 and
9a) and values of the SL, AF, Dd, and Hi indices (Table 3)
provide a means to help examine variations of tectonic
uplifting activity along the fault (Yıldırım, 2014).
Although values for all geomorphic indices along the
fault segments are different, they are mostly of the same
activity zone (Figures 9a–9c), implying that all the segments
have comparable tectonic activity and have undergone
similar amounts of erosion over time. The uniform
variation in geomorphic indices might also indicate that
either all the fault segments were initiated at the same
time and underwent similar morphological evolution or
some fault segments formed later, but experienced higher
erosional rates. The former possibility of geomorphic
indices’ uniformity appears to be more likely considering
the relatively uniform total offset of 13–30 km and the
uniform and constant slip rate of ~10 mm/year along the
entire fault (Reilinger et al., 2006; Mahmoud et al., 2013;
Aktuğ et al., 2016). In contrast, the cumulative offset along
the NAF becomes smaller and the width of the shear zone
gets wider from east to west (Şengör et al., 2014). This is
because the NAF becomes younger to the west as it has
propagated westward at a rate of ~11 cm/year (Şengör et
al., 2004).
Dewey et al. (1986) and Westaway and Arger (1996)
suggested that the EAF is a root of the distributed
deformation and is oblique to the assumed Anatolian/
Arabian plate motion, and as such the EAF is not a true
transform fault. In contrast, Westaway (1994a) concluded
that the Anatolian/Arabian plate boundary is a real
transform fault system since it initiation at ~5 Ma. He
121
0
1: Karlıova
1.0
(a)
Vf
Smf
1.0
0.5
0.0
5.0
2: Palu
(b)
Valley width to valley
height ratios
(Vf)
3: Pütürge
50 km
0.5
0.0
5.0
4.0
4.0
3.0
0.6
3.0
0.6
(c)
0.5
0.5
0.4
0.4
0.3
0.3
Drainage density
(Dd)
Mountain front
sinuosity (Smf)
1.5
4: Erkenek
39˚
Hypsometric integral
(Hi)
5: Pazarcık
2.0
41˚
38˚
40˚
39˚
38˚
37˚
KHALIFA et al. / Turkish J Earth Sci
Figure 9. Morphometric indices (a–c) along the East Anatolian Fault. Smf, Mountain front sinuosity; Vf, valley width to valley height
ratios; (Dd) drainage density; Hi, hypsometric integral.
argued that since ~5 Ma, the MOFZ that is subparallel
to the EAF has taken up part of the Anatolian/Arabian
plate movement. Arger et al. (1996) and Westaway
and Arger (1996) recorded evidence that the MOFZ is
presently inactive and proposed instead a scheme where
the Anatolian/Arabian plate boundary was formed by
the MOFZ from ~5 to 3 Ma and the EAF has created
this boundary since ~3 Ma (Figure 10). Westaway
(1994) argued that the MOFZ and EAF are tectonically
equivalent, and both have taken up the ~70 km of the
estimated Anatolian/Arabian boundary since ~5 Ma.
In contrast, Westaway and Arger (1996) argued that the
MOFZ created the African/Anatolian plate boundary
since 3–5 Ma and no significant slip has occurred since
that time. This is based on: (1) the lack of recorded
seismicity, (2) the field work of Westaway and Arger
(1996) that does not show any geomorphic evidence for
recent slip, and (3) the fact that if the western and eastern
areas of Erzincan and the MOFZ are active at the same
time, very intense deformation would be recorded around
their intersection region, which has not been recognized.
Westaway and Arger (1996), therefore, concluded that
the MOFZ was the Anatolian/Arabian plate boundary
122
at ~5 Ma and later. This boundary moved southeast
to occupy its modern location at ~3 Ma. In contrast,
some researchers, e.g., Koçyiğit and Beyhan (1998) and
Kaymakcı et al. (2006), suggested a different hypothesis
for activity along the MOFZ. They argued that the MOFZ
is tectonically active at present and it is a part of the
present motion between the Anatolian/Arabian plates.
Westaway and Arger (2001) argued against the view of
Koçyiğit and Beyhan (1998) because they did not offer any
quantitative examinations of the kinematics of the MOFZ
to support their different scenarios. As discussed above,
our geomorphic analysis suggests coeval development
along the different segments of the EAF and supports the
view of an eastward jump of the proto-EAF (~110 km)
from what is now the MOFZ to its present-day EAF at
~3 Ma (Figure 10; Arger et al., 1996; Hubert-Ferrari et al,
2009). Westaway (1994a) calculated a convergence rate of
14 ± 2 mm/a for the Anatolian/Arabian plate, which since
initiation of slip on the EAF zone has accommodated
~30 km of convergence, with all the 14 ± 2 mm/a slip
occurring on the MOFZ. Before initiation of slip on the
EAF, the NAF ended at Erzincan and its present eastern
stretch did not exist (Figure 10).
KHALIFA et al. / Turkish J Earth Sci
Black Sea
F
Anatolian
Eurasian
E
Arabian
A
F
OTJ
KTJ
Er
El
A
D S F
Z
N
A
O
F
F
D
100
Km
3 Ma to Present day (a)
D S
F Z
A
D S F
Z
N
5 to 3 Ma (b)
Before 5 Ma (c)
Figure 10. Summary of the evolution of the triple junction between the Arabian, Eurasian, and
Anatolian plates (from Arger et al., 1996; Westaway and Arger, 1996, 2001; Hubert-Ferrari et al.,
2009). OTJ, Ovacık triple junction; KTJ, Karlıova triple junction; OF, Ovacık Fault; Er, Erzincan;
El, Elazığ; D, Diyarbakır; A, Adıyaman. (a) Present day. (b) Immediately before the modern fault
geometry developed between 3 and 5 Ma. (c) Immediately before change in plate geometry at
5 Ma.
7. Conclusions
Geomorphic indices, including SL, Smf, Vf, AF, Dd, and Hi, are
used for the first time along the EAF to gain deeper insights
into morphotectonic evolution and activity of the EAF. Smf
versus Vf values are positively correlated and indicate a high
degree of tectonic and geomorphic activity, which is also
supported by the results from stream gradient analysis and
hypsometric analysis. This implies that each segment along
the fault is presently very active.
The similar values for geomorphic indices along the
entire length of the fault suggests that the development of
the EAF was essentially coeval along its length, supporting
the view that the present-day Anatolian/Arabian plate
boundary, i.e. the EAF, jumped eastward from the MOFZ
from the proto-EAF to its present-day location at ~3 Ma.
This is in good agreement with the nearly uniform geological
offsets and the present day slip rate of ~10 mm/year along
the entire fault that appears to have been constant since ~3
Ma.
This study illustrates that morphometric analysis
along the entire length of a major strike-slip fault provides
important insights into the fault’s tectonic evolution.
Calculations of multiple catchments’ geomorphic indices
and indices that are related to the trace of the faults can
provide us with valuable data on the tectonic behaviors
and landscape evolution. Thus, this can be applied to other
major faults elsewhere, especially to those whose tectonic
activity, cumulative offset, and slip rates are not well defined.
Acknowledgments
This work was supported by İstanbul Technical University
with a Scientific Research Projects Unit project. The PhD
scholarship to the first author by the Turkish Government
is acknowledged. The authors are thankful to Cengiz
Yıldırım, İstanbul Technical University, for his suggestions
and significant discussion to improve our work. We also
like to thank Elizabeth Orr, University of Cincinnati, for
critical reading of the manuscript. The authors are grateful
to manuscript editor Dr Taylan Sançar for his comments
and judicious evaluation that significantly improved
the manuscript. The considerable improvement of our
manuscript by Dr Savaş Topal and the other two anonymous
referees’ comments, remarks, and recommendations are
gratefully acknowledged.
References
Aksoy E, İnceöz M, Koçyiğit A (2007). Lake Hazar Basin: a negative
flower structure on the East Anatolian Fault System (EAFS), SE
Turkey. Turkish J Earth Sci 16: 319-338.
Alipoor R, Poorkermani M, Zare M, El Hamdouni R (2011). Active
tectonic assessment around Rudbar Lorestan dam site, High
Zagros Belt (SW of Iran). Geomorphology 128: 1-14.
Aktuğ B, Özener H, Dogru A, Sabuncu A, Turgut B, Halicioglu K,
Yilmaz O, Havazli E (2016). Slip rates and seismic potential
on the East Anatolian Fault System using an improved GPS
velocity field. J Geodynamics 94-95: 1-12.
Allen CR (1969). Active Faulting in Northern Turkey. Pasadena, CA,
USA: Division of Geological Sciences, California Institute of
Technology.
123
KHALIFA et al. / Turkish J Earth Sci
Ambraseys NN (1988). Temporary seismic quiescence: SE Turkey.
Geophys J Int 96: 311-331.
Ambraseys NN, Jackson JA (1998). Faulting associated with historical
and recent earthquakes in the Eastern Mediterranean region.
Geophys J Int 133: 390-406.
Arger J, Milcheli J, Westaway R (1996). Neogene and Quaternary
Volcanism of Eastern Turkey: Potassium-Argon Dating and
Its Tectonic Implications. Open-file Science Reports. 1996/1.
Newcastle upon Tyne, UK: Technoscience.
Arpat E, Şaroğlu F (1972). The East Anatolian Fault System: thoughts
on its development. Bulletin of the Mineral Research and
Exploration (MTA) 78: 33-39.
El Hamdouni R, Irigaray C, Fernandez T, Chacón J, Keller EA (2008).
Assessment of relative active tectonics, southwest border of
Sierra Nevada (southern Spain). Geomorphology 96: 150-173.
Emre Ö, Duman TY, Özalp S, Elmaci H, Olgun Ş, Şaroğlu F (2013).
Active Fault Map of Turkey with an Explanatory Text.
Ankara, Turkey: General Directorate of Mineral Research and
Exploration (MTA).
Farr TG, Rosen PA, Caro E, Crippen R, Duren R, Hensley S, Kobrick
M, Paller M, Rodrigue ZE, Roth L et al. (2007). The shuttle
radar topography mission. Rev Geophys 45: 1-33.
Hack JT (1973). Stream profile analysis and stream-gradient index. J
Res US Geol Surv 1: 421-429.
Arpat E, Şaroğlu F (1975). Recent tectonic activities in Turkey.
Bulletin of the Geological Society of Turkey 18: 91-101 (in
Turkish with English abstract).
Hempton MR (1985). Structure and deformation history of Bitlis
suture near Lake Hazar, southeastern Turkey. Bull Geo Soc Am
96: 233-243.
Azañón JM, Pérez-Peña JV, Giaconia F, Booth-Rea1 G, MartínezMartínez JM, Rodríguez-Peces MJ (2012). Active tectonics
in the central and eastern Betic Cordillera through
morphotectonic analysis: the case of Sierra Nevada and Sierra
Alhamilla. J Iber Geol 38: 225-238.
Hempton MR (1987). Constraints on Arabian plate motion and
extensional history of the Red Sea. Tectonics 6: 687-705.
Azor A, Keller EA, Yeats RS (2002). Geomorphic indicators of active
fold growth: South Mountain-Oak Ridge anticline, Ventura
basin, southern California. Geol Soc Am Bull 114: 745-753.
Herece E (2008). Atlas of the East Anatolian Fault. Ankara, Turkey:
General Directorate of Mineral Research and Exploration
(MTA), Special Publication Series.
Barka AA, Kadinsky-Cade K (1988). Strike-slip fault geometry in
Turkey and its influence on earthquake activity. Tectonics 7:
663-684.
Herece E, Akay E (1992). Karlıova-Çelikhan arasında Doğu Anadolu
Fayı, Turkiye. Petrol Kongresi Bildirileri. In: 9th Petroleum
Congress of Turkey Proceedings, 17–21 February 1992,
Ankara, Turkey, pp. 361-372 (in Turkish).
Bull WB (1977). The alluvial fan environment. Prog Phys Geog 1:
22-270.
Bull WB, McFadden LD (1977). Tectonic geomorphology north
and south of the Garlock fault, California. In: Doehering O,
editor. Geomorphology in Arid Regions. The 8th Annual
Geomorphology Symposium Proceedings. Binghamton, NY,
USA: State University of New York, pp. 115-138.
Bulut F, Bohnhoff M, Eken T, Janssen C, Kılıç T, Dresen G (2012).
The East Anatolian Fault Zone: Seismotectonic setting and
spatiotemporal characteristics of seismicity based on precise
earthquake locations. J Geophys Res 117: 1-16.
Castelltort S, Goren L, Willett S, Champagnac J, Herman F, Braun
J (2012). River drainage patterns in the New Zealand Alps
primarily controlled by plate tectonic strain. Nat Geosci 16:
1-5.
Çetin H, Güneyli H, Mayer L (2003). Paleosismology of the PaluLake Hazar segment of the East Anatolian Fault Zone, Turkey.
Tectonophysics 374: 163-197.
Dewey JF, Hempton MR, Kidd WSF, Şaroglu F, Şengör AMC (1986).
Shortening of continental lithosphere: the neotectonics of
Eastern Anatolia - a young collision zone. In: Coward MP,
Ries AC, editors. Collision Tectonics. London, UK: Geological
Society of London Special Publications, pp. 3-36.
Duman TY, Emre Ö (2013). The East Anatolian Fault: geometry
segmentation and jog characteristics. Geol Soc London Spec
Publ 372: 495-529.
124
Hempton MR, Dewey JF, Şaroğlu F (1981). The East Anatolian
transform fault: along strike variations in geometry and
behavior. EOS T AM Geophys UN 62: 393.
Hubert-Ferrari A, King G, Vander Woerd J, Villa I, Altunel E,
Armijo R (2009). Long-term evolution of the North Anatolian
Fault: new constrains from its eastern termination. In: Van
Hinsbergen DJJ, Edwards MA, Govers R, editors. Collision
and Collapse at the Africa-Arabia-Eurasia Subduction
Zone. London, UK: Geological Society of London Special
Publication, pp. 133-154.
Jackson J, McKenzie DP (1984). Active tectonics of the AlpineHimalayan belt between western Turkey and Pakistan.
Geophys J Roy Astr S 77: 185-264.
Karabacak V, Önder Y, Altunel E, Yalçıner CC, Akyüz HS, Kıyak NG
(2011). Doğu Anadolu Fay Zonunun güney batı uzanımının
paleosismolojisi ve ilk kayma hızı. In: Proceedings of Aktif
Tektonik Araştırma Grubu Onbeşinci Çalıştayı, 19–22 October
2011, Adana, Turkey (in Turkish).
Kaymakcı N, İnceöz M Ertepınar P (2006). 3D-Architecture and
Neogene evolution of the Malatya Basin: inferences for the
kinematics of the Malatya and Ovacık Fault zones. Turkish J
Earth Sci 15:123-154.
Keller EA, DeVecchio DE (2013). Tectonic geomorphology of active
folding and development of transverse drainage. In: Shroder
J, Owen LA, editors. Treatise on Geomorphology. 5th ed. San
Diego, CA, USA: Academic Press, pp. 129-147.
Keller EA, Pinter N, editors (2002). Active Tectonics: Earthquakes,
Uplift and Landscapes. 2nd ed. Upper Saddle River, NJ, USA:
Prentice Hall.
KHALIFA et al. / Turkish J Earth Sci
Khalifa A, Çakır Z, Owen LA, Kaya Ş (2017). Evaluation of the
relative tectonic activity of the Adıyaman Fault in Eastern
Turkey. Conference abstract. In: International Symposium
on GIS Applications in Geography and Geosciences, 18–21
October 2017, Çanakkale, Turkey, p. 293.
Kiratzi A (1993). A study on the active crustal deformation of the
North and East Anatolian Fault Zones. Tectonophysics 225:
191-203.
Koçyiğit A, Beyhan A (1998). A new intracontinental transcurrent
structure: the Central Anatolian Fault Zone, Turkey.
Tectonophysics 284: 317-336.
Langbein WB (1947). Topographic Characteristics of Drainage
Basins. Water Supply Paper 968-C. Washington, DC, USA: US
Geological Survey.
Mahmoud Y, Masson F, Meghraoui M, Cakir Z, Alchalbi A, Yavasoglu
H, Yönlü Ö, Daoud M, Ergintav S, Inan S (2013). Kinematic
study at the junction of the East Anatolian fault and the Dead
Sea fault from GPS measurements. J Geodyn 67: 30-39.
Mayer L, editor (1990). Introduction to Quantitative Geomorphology:
An Exercise Manual. Englewood Cliffs, NJ, USA: Prentice Hall.
McKenzie DP (1972). Active tectonics of the Mediterranean region.
Geophys J Int 30: 109-185.
McKenzie DP (1976). The East Anatolian fault: a major structure in
eastern Turkey. Earth Planet Sc Lett 29: 189-193.
McKenzie DP (1978). Active tectonics of the Alpine- Himalayan belt:
The Aegean Sea and surrounding regions (tectonic of Aegean
region). Geophys J Roy Astr S 55: 217-254.
Meghraoui M, Bertrand S, Karabacak V, Ferry M, Çakir Z, Altunel E
(2006). Surface ruptures along the Maras segment of the East
Anatolian Fault (SE Turkey) and kinematic modelling from
Tectonic and GPS data. Geophysical Research Abstracts 8:
10006.
Melosh B, Keller EA (2013). Effects of active folding and reverse
faulting on stream channel evolution, Santa Barbara Fold Belt,
California. Geomorphology 186: 119-135.
Michael K, Frank L (2013). Geomorphology of the Tsetseg Nuur basin,
Mongolian Altai-lake development, fluvial sedimentation and
aeolian transport in a semi-arid environment. J Maps 9: 361366.
Moreno DG, Hubert-Ferrari A, Moernaut J, Fraser JG, Boes X, Van
Daele M, Avsar U, Çağatay N, De Batist M (2010). Structure
and recent evolution of the Hazar Basin: a strike-slip basin on
the East Anatolian Fault, Eastern Turkey. Basin Res 23: 191207.
Muehlberger WR, Gordon MB (1987). Observations on the
complexity of the East Anatolian Fault, Turkey. J Struct Geol
9: 899-903.
Owen LA, Cunningham WD, Brian FW, Badamgarov J, Dorjnamjaa
D (1999). The landscape evolution of Nemegt Uul: a late
Cenozoic transpressional uplift in the Gobi Altai, southern
Mongolia. Geol Soc London Spec Publ 162: 201-218.
Özkaymak C, Sözbilir H (2012). Tectonic geomorphology of the
Spreader High Ranges, Western Anatolia. Geomorphology.
173-174: 128-140.
Pike RJ, Wilson SE (1971). Elevation-relief ratio, hypsometric
integral and geomorphic area-altitude analysis. Geol Soc Am
Bull 82: 1079-1084.
Reilinger R, McClusky S, Vernant P, Lawrence S, Ergintav S, Cakmak
R, Ozener H, Kadirov F, Guliev I, Stepanyan R et al. (2006).
GPS constraints on continental deformation in the AfricaArabia–Eurasia continental collision zone and implications for
dynamics of plate interactions. J Geophys Res 111: 1-26.
Rockwell TK, Keller EA, Johnson DL (1984). Tectonic geomorphology
of alluvial fans and mountain fronts near Ventura, California.
In: Morisawa M, Hack JT, editors. Tectonic Geomorphology.
The 15th Annual Geomorphology Symposium Proceedings.
Boston, MA, USA: Allen and Unwin, pp. 183-207.
Şaroğlu F, Emre Ö, Kuşçu I (1992a). Active fault map of Turkey.
Ankara, Turkey: General Directorate of Mineral and Research
Exploration of Turkey Publication (MTA).
Şaroğlu F, Emre Ö, Kuşçu I (1992b). The East Anatolian fault zone of
Turkey. Annales Tectonicae 6: 99-125.
Selby MJ (1980). A rock strength classification for geomorphic
purposes: with tests from Antarctica and New Zealand. Z
Geomorphol 24: 31-51.
Selçuk AS (2016). Evaluation of the relative tectonic activity in the
eastern Lake Van basin, East Turkey. Geomorphology 270:
9-21.
Şengör AMC (1979). The North Anatolian Transform Fault: its age,
offset and tectonic significance. Geol Soc London Spec Publ
136: 269-282.
Şengör AMC, Görür N, Şaroğlu F (1985). Strike slip faulting and
related basin formation in zones of tectonic escape: Turkey as a
case study. In: Biddle KT, Christie-Blick N, editors. Strike-Slip
Deformation, Basin Formation and Sedimentation. Tulsa, OK,
USA: Society of Economic Paleontologists and Mineralogists,
pp. 227-264.
Şengör AMC, Grall C, Imren C, Le Pichon X, Görür N, Henery
P, Karabulut H, Siyako S (2014). The geometry of the North
Anatolian transform fault in the Sea of Marmara and its
temporal evolution: implications for the development of
intracontinental transform faults. Can J Earth Sci 51: 222-242.
Silva PG, Goy JL, Zazo C, Bardaji T (2003). Fault-generated mountain
fronts in southeast Spain: geomorphologic assessment of
tectonic and seismic activity. Geomorphology 50: 203-225.
Strahler AN (1952). Hypsometric (area-altitude curve) analysis of
erosional topography. Geol Soc Am Bull 63: 1117-1141.
Tari U, Tüysüz O (2015). The effects of the North Anatolian Fault
on the geomorphology in the Eastern Marmara Region,
Northwestern Turkey. Geodin Acta 28: 139-159.
Taymaz T, Eyidoğan H, Jackson J (1991). Source parameters of
large earthquakes in the East Anatolian Fault Zone (Turkey).
Geophys J Int 106: 537-50.
125
KHALIFA et al. / Turkish J Earth Sci
Tepe Ç, Sözbilir H (2017). Tectonic geomorphology of the Kemalpaşa
Basin and surrounding horsts, southwestern part of the Gediz
Graben, Western Anatolia. Geodin Acta 29: 70-90.
Topal S, Keller E, Bufe A, Koçyiğit A (2016). Tectonic geomorphology
of a large normal fault: Akşehir fault, SW Turkey.
Geomorphology 259: 55-69.
Ul-Hadi S, Shuhab DK, Owen LA, Khan AS (2013). Geomorphic
response to an active transpressive regime: a case study along
the Chaman strike-slip fault, western Pakistan. Earth Surf Proc
Land 38: 250-264.
Westaway R (1994). Present-day kinematics of the Middle East and
eastern Mediterranean. J Geophys Res 99: 12071-12090.
Westaway R, Arger J (1996). The Gölbaşı basin, southeastern Turkey:
a complex discontinuity in a major strike-slip fault zone. Geol
Soc London Spec Publ 153: 729-743.
Westaway R, Arger J (2001). Kinematics of the Malatya-Ovacık Fault
Zone. Geodin Acta 14: 103-131.
Westaway R, Demir T, Seyrek A, Beck A (2006). Kinematics of active
left-lateral faulting in SE Turkey from offset Pleistocene river
gorges: improved constraint on the rate and history of relative
motion between the Turkish and Arabian plates. Geol Soc
London Spec Publ 163: 149-164.
126
Yalçın MN (1979). Dogu Anadolu yarılımının Türkoğlu-Karaağaç (K.
Maraş) arasındaki kesiminin özellikleri ve bölgedeki yerleşim
alanları. In: Türkiye Jeologi Kurumu Altınlı Simpozyumu, Özel
Sayı, pp. 49-55 (in Turkish).
Yıldırım C (2014). Relative tectonic activity assessment of the Tuz
Gölü Fault Zone; Central Anatolia, Turkey. Tectonophysics
630: 183-192.
Yönlü Ö, Altunel E, Karabacak V (2017). Geological and
geomorphological evidence for the southwestern extension
of the East Anatolian Fault Zone, Turkey. Earth Planet Sc Lett
469: 1-14.
Yönlü Ö, Altunel E, Karabacak V, Serdar Akyüz H (2013). Evolution
of the Gölbaşı basin and its implications for the long-term
offset on the East Anatolian Fault Zone, Turkey. J Geodyn 65:
272-281.
Yönlü Ö, Karabacak V, Altunel E, Akyüz HS (2012).
Paleoseismological slip rate on the East Anatolian fault zone
around Türkoğlu. Conference abstract. In: International Earth
Science Colloquium on the Aegean Region, 1–5 October 2012,
İzmir, Turkey, p. 104.
Yürür MT, Chorowicz J (1998). Recent volcanism, tectonics and
plate kinematics near the junction of the African, Arabian
and Anatolian plates in the Eastern Mediterranean. J Volcanol
Geotherm Res 85: 1-15.