The variations of heavy rainfall in the northern region of Vietnam under the global warming: A case study of heavy rainfall event from 30 october to 05 november, 2008
Bạn đang xem bản rút gọn của tài liệu. Xem và tải ngay bản đầy đủ của tài liệu tại đây (564.96 KB, 8 trang )
BÀI BÁO KHOA HỌC
THE VARIATIONS OF HEAVY RAINFALL IN THE NORTHERN REGION
OF VIETNAM UNDER THE GLOBAL WARMING: A CASE STUDY OF
HEAVY RAINFALL EVENT FROM 30 OCTOBER TO 05 NOVEMBER, 2008
Tran Quoc Lap1
Abstract: In this paper, a heavy rainfall event in the northern region of Vietnam in August 2008 was
selected for simulation, using a Weather Research and Forecast (WRF) model and combining with
ensemble simulation method. Rainfall variability in future climate scenarios was investigated using
numerical simulations based on pseudo global warming conditions, constructed using fifth-phase results
of Coupled Model Intercomparison Project multi-model global warming experiments. The simulation
results of maximum six-hourly rainfall in northern Vietnam will slightly decrease under the climate
change conditions, whereas, total precipitation would increase significantly in all three global climate
models in the future. The spatial distribution of heavy rain would tend to shift to the northern
mountainous regions of Vietnam. Simulation results suggest that global warming may correlate with a
significant increase in total rainfall.
Keywords: heavy rainfall, pseudo global warming, ensemble simulation,
1. INTRODUCTION *
The science of climatic extremes is important
and critical in terms of modeling, socioeconomic
impacts, damages, and adaptation. Occurrences of
rainfall extremes are expected to increase in
changing climate (Goswami B. N et al. 2006,
IPCC 2012) and hence, proper scientific
understanding of extremes is crucial. Though
there are significant research advancements in the
last two decades in the science of extremes
(Cavazos 2008, IPCC 2012, Wheater H.P 2002,
Young 2002) to minimize the impacts, hazards,
and losses,there are still a significant number of
extreme events resulting in huge human and
economic losses.
Heavy rains are the consequence of convective
instabilities in moist air in small spatial location
(Goswami B. N et al. 2006). Although the fraction
of extreme rain events is caused by synoptic
disturbances (Francis 2006), a large number of
extremes are caused by processes like
thunderstorms and are more uniformly distributed
1
Division of Water Resources Engineering, Thuyloi
University
with space and time. Extremely rainfall is difficult
to predict and continue to be a challenge to
operational and research community (Das 2008,
Li 2017).
Located along the east coast of the Indochina
Peninsula with a substantial latitudinal extent on
the northwest Pacific Ocean, Vietnam is one of
the countries heavily affected by climate change
in the world. Heavy rainfall is one of the major
severe weathers over the northern region of
Vietnam producing devastating flood in the delta
and flood flash in the mountainous areas, and
consequently having caused a number of fatalities
and a tremendous amount of property damage.
Heavy rainfall usually results from individual
mesoscale storms or mesoscale convective
systems (MCSs) embedded in synoptic-scale
disturbances (Lee 1998). We need high-resolution
observations and numerical modeling techniques
to better predict heavy rainfall events and
understand the evolution and development
mechanisms of mesoscale convection and storms
responsible for heavy rainfall.
In this study, the pseudo-global warming
(PGW) downscaling approach (Sato, Kimura, and
KHOA HỌC KỸ THUẬT THỦY LỢI VÀ MÔI TRƯỜNG - SỐ 66 (9/2019)
137
Kitoh 2007) was applied to investigate the future
variations in a heavy rainfall event in the northern
region of Vietnam. So, we selected the heavy rain
event from 30 October to 05 November 2008 and
made hindcast and PGW simulations to
investigate the changes in rainfall. The remainder
of this paper is organised as follows. Section 2
presents an overview of the dataset, and the design
of the dynamic downscaling (DDS) with PGW
forcing data are provided In Section 3, the
hindcast simulations of heavy rainfall are
discussed, and the simulations of rainfall changes
in future climate scenarios from the DDS are
investigated with PGW conditions. Finally, a
summary is given in the last section.
2. DATA AND METHODOLOGY
2.1 Data
2.1.1. Japanese 55-year Reanalysis (JRA-55)
The Japanese 55-year reanalysis product (JRA55) by the Japan Meteorological Agency (JMA)
was used for simulations of the heavy rain event
in 2008. JRA-55 is produced by a system based on
the low-resolution (TL319) version of JMA’s
operational data assimilation system, which has
been extensively improved since the previous
reanalysis (JRA-25). The atmospheric component
of JRA-55 is based on the incremental fourdimensional variational method. Newly available
and improved past observations are used for JRA55. Major problems in JRA-25 (cold bias in the
lower stratosphere and dry bias in the Amazon)
have been resolved in JRA-55; therefore, the
temporal consistency of temperature is improved.
Further details are available in Kobayashi et al.
(Kobayashi 2015).
2.1.2. Climate Model Intercomparision
Project (CMIP5)
Global
warming
experiments
Climate
projections of the fifth phase of the Climate Model
Intercomparison Project (CMIP5) were used for
the preparation of the PGW conditions. In CMIP5
(Taylor K.E. 2012), simulations of climate
projections are conducted according to several
greenhouse gas emission scenarios, i.e.,
representative concentration pathways (RCPs).
For example, in the RCP4.5 scenario, the radiative
forcing of the Earth becomes 4.5 W/m2 by the end
of the 21 st century. In this study, projections
based on the RCP4.5 scenario were used, details
of which are presented in Table 1.
Table 1. List of the CMIP5 models used in our research
CMIP5_ID
1 ACCES1-0
2 CNRM_CM5
3 GFDL-CM3
Institute
Commonwealth Scientific and Industrial Research and Organization.
Centre National de Recherches Meteorologiques / Centre Europeen de
Recherche et Formation Avancees en Calcul Scientifique
Geophysical Fluid Dynamics Laboratory, USA
2.1.3. The sea surface temperature (SST)
For SST in the simulations, we used the
National
Oceanic
and
Atmospheric
Administration Optimum Interpolation 1/4 Degree
Daily Sea Surface Temperature Analysis (NOAA
OI SST) (Reynolds 2007). The NOAA OI SST
data set has a grid resolution of 0.25° and a
temporal resolution of one day. The product uses
Advanced Very High-Resolution Radiometer
infrared satellite SST data. Advanced Microwave
Scanning Radiometer SST data were used after
June 2002. In situ data from ships and buoys were
138
Country
Australia
France
United
State
also used for large-scale adjustment of satellite
biases.
2.1.4. Land-surface Conditions
For the land-surface condition in the numerical
simulations (volumetric soil moisture, soil
temperature, soil type, and vegetation type), we used
National Centers for Environmental Prediction
(NCEP) Final Operational Global Analysis (NCEP
FNL) data. NCEP FNL data are produced on a 6hourly basis by the NCEP global data analysis
system from July 1999 to the near present. Data
spatial resolution is 1.0° × 1.0° (NCEP 2000).
KHOA HỌC KỸ THUẬT THỦY LỢI VÀ MÔI TRƯỜNG - SỐ 66 (9/2019)
2.1.5. Rainfall Data for Verification
As rainfall data for verification of the heavy
rain event in 2008, we used in-situ observation
data from fourteen rain gauge stations in the
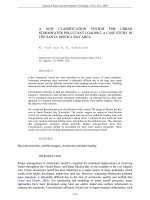
northern region of Vietnam. The locations of
weather stations are shown in Fig 1 (b). In
Vietnam, weather radar stations over the whole
territory are fairly sparse. Hence, to examine the
detailed spatial distribution of precipitation in the
northern region of Vietnam, simulated results
were compared with the spatial distribution of
heavy rainfall rate by Tropical Rainfall Measuring
Mission Microwave
Imager
(TRMM/TMI)
measured microwave energy emitted by the Earth
and its atmosphere to quantify the water vapor, the
cloud water, and the rainfall intensity in the
atmosphere. TRMM precipitation measurements
have made critical inputs to numerical weather
prediction, and precipitation climatologies.
2.1.6. Heavy rainfall event in 2008
From 30 October to 1 November 2008, the
extremely heavy rains are recorded with the total
amount of over 500 – 600 mm during the three
days in Hanoi area. The rain in Hanoi was
concentrated in a short period with the highest
intensity over the past 100 years.
2.2. Pseudo-Global Warming and dynamical
downscaling method
In recent years, there have been a number of
research works related to the affecting of global
warming and the climate sciences usually use the
simulation output from coupled atmosphere-ocean
global climate models (AOGCMs) for present and
future predicted (Lee 2006, Von Storch 2008).
However, the spatial resolution of AOGCM
models are usually too coarse (generally several
hundreds of kilometer per grid), so it is too
difficult to investigate future variations of localscale hydrologic, atmospheric and meteorological
conditions, and extreme weather events.
In this paper, control simulations of the heavy
rainfall events (CTL) from 30 October to 05
November 2008 were performed with initial and
boundary conditions prepared from JRA-55,
NCEP FNL and NOAA 0.25 interpolated OI SST.
In addition to CTL, we performed simulations
with pseudo global warming forcing prepared
using different CMIP5 data. Pseudo Global
Warming conditions of the heavy rainfall event
were calculated from future and present climate
conditions. The future weather conditions were
obtained from the 10-year monthly mean from
2091 to 2100. Present climatic conditions were
obtained from the 10-year monthly mean from
1991 to 2000 in 20C3M. Then, anomalies of
global warming were calculated as the difference
between future and present climatic conditions
and added to JRA-55. Thus, a set of PGW
conditions was constructed for the wind,
atmospheric temperature, geopotential height,
surface pressure, and specific humidity. For
relative humidity, the original values in JRA-55
were retained in three CMIP5 models conditions,
and specific humidity in these conditions was
defined from the relative humidity and the
modified atmospheric temperature of the future
climate. To prepare SST for the PGW condition,
the SST anomaly obtained from future and present
climate conditions in the CIMP5 output was added
to the NOAA SST.
Design of Numerical Simulations
In this study, weather research and forecasting
model (WRF) version 3.6.1 were adopted for the
CTL and PGW simulations. A two-way nesting
grid system was used, as shown in Figure 1 (a). The
coarsest domain (D01) had a 30-km horizontal
resolution and the higher resolution domain D02
had a 6-km horizontal resolution. The Betts–
Miller–Janjic microphysics and Lin ice cumulus
parameterization schemes (Lin 1983) were used to
calculate precipitation in the model. Planetary
boundary layer processes were calculated using the
Total Energy - Mass Flux (TEMF) scheme. For
longwave and shortwave radiation, the rapid
radiative transfer model with the New Goddard
scheme was used. For D01, a spectral nudging
method was used for atmospheric temperature,
zonal wind, meridional wind, and geopotential
height every six hours at altitudes above 6–7 km.
An outline of the model settings is given in Table 2
Errors in initial conditions and in model
physics result in forecast uncertainties. One
KHOA HỌC KỸ THUẬT THỦY LỢI VÀ MÔI TRƯỜNG - SỐ 66 (9/2019)
139
approach for reducing these uncertainties is the
use of ensemble forecasting Ensemble simulations
with different initial conditions were performed
for the CTL and each PGW condition. Ensemble
simulations enable stochastic analysis of
differences between CTL and PGW runs.
Therefore, it could be determined whether
differences were attributable to the effects of
global warming or chaotic behaviors in the
numerical weather model. For more details of this
methodology, refer to Tran and Taniguchi (2016)
(Tran and Taniguchi 2016).
3. RESULTS
3.1. Results of the CTL run
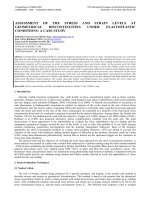
Figure 2 shows the results of total precipitation
at 14 rain gauge stations in the northern region of
Vietnam. From the results of total rainfall amount
from 06:00 UTC 30 October to 00:00 UTC 05
November 2008 we can see that the average heavy
rainfall from nineteen ensemble members at the
most of rain gauge stations is close with
observation data. Except for the results from Ha
Dong station, precipitation tends to be
underestimated in CTL runs, the mean simulation
result is approximately 500 mm when compared
with over 800 mm. The average simulation results
of nineteen ensemble members at Ba Vi, Hung
Yen, Van Ly, and Thai Binh rain gauge stations
are higher than the observed data.
The correlation coefficient (CC), and root
mean square errors (RMSE) between CTL runs
and observation data are 0.8 and 132 mm
respectively. It means that the simulation results
are good correlate with the observed data.
Figure 1. a) Two domains using in this study D01, D02 are coarse and fine domains respectively,
b) The open circles are the locations of 14 rain gauge stations.
Table 2. The settings in Weather Research and Forecasting model
Version of model
Number of domain
Horizontal grid distance
Cloud microphysics
Cumulus parameterization
Longwave radiation
Shortwave radiation
Sf_sfclay_physics
Land surface scheme
Planetary boundary layer scheme
Setting of spectral nudging
140
V 3.6.1
Two
30 km (coarse domain); 6 km (fine domain)
Lin et al. method (Lin, Farley,and Orville (1983, JCAM))
Betts-Miller-Janjic scheme cumulus parameterization
New Goddard scheme
New Goddard scheme
TEMF (ARW only)
unified Noah land-surface model
Total Energy - Mass Flux (TEMF) scheme
A spectral nudging method was used for atmospheric
temperature, zonal wind, meridional wind, and geopotential
height every six hours, at altitudes above 6-7 km.
KHOA HỌC KỸ THUẬT THỦY LỢI VÀ MÔI TRƯỜNG - SỐ 66 (9/2019)
Figure 2. Rainfall at 14 rain gauge stations. Large
blue solid circles and open small circles are average
rainfall simulation results and rainfall simulation
results for each ensemble member respectively.
Large red solid circles are observation rainfall data
at 14 rain gauge stations.
Figure 3 (a) and (b) show the spatial
distribution of rainfall from 03 UTC to 04 UTC
31 October 2008 of Tropical Rainfall Measuring
Mission Microwave Imager (TRMM/TMI), and
ensemble mean results of CTL runs. The
simulation result captures the heavy rain events
through the intensity and distribution of rainfall.
The simulation results seem to concentrate in the
Northwest region, spread from 20oN to 22oN
latitude and 103.5oE to 105oE longitude, the
heavy rainfall area is to move to the northern
area when compared with spatial distribution
rainfall of TRMM/TMI. The heavy rainfall area
in one hour greater than 30 (mm/h) is larger than
the results fromTRMM/TMI.
3.2. The variation of heavy rainfall under
the global warming
3.2.1. Maximum six-hourly rainfall amount
and total rainfall amount.
Figure 4 displays the relationship between the
maximum six hourly rainfall amount and total
rainfall amount of CTL runs and three CMIP5
models. The simulation results of six-hourly rainfall
from nineteen ensemble members of three CMIP5
models show slightly decrease when compared with
CTL runs. The mean six-hourly rainfall of nineteen
ensemble member of CTL runs is about 446 mm,
whereas the values simulated by three CMIP5
models are from 412 (mm) and 433 (mm). However,
when considering the results of total rainfall
simulated by three CMIP5 models, the all simulation
results of mean total rainfall from nineteen ensemble
members increase from 15% to 28 % in all
experiments. The highest increase in total
precipitation (the average from nineteen ensemble
members) is 1701 mm at ACCESS1-0 model,
followed by CNRM-CM5, and GFDL-CM3 models
with 1652.4 mm and 1527 mm, respectively when
compared with 1326.7 mm of CTL runs. The heavy
rainfall from each ensemble member is maximum
value were found from the spatial distribution of
rainfall in domain 2 with the simulated time of 6
hourly and total time (from 06UTC 30 October to
00UTC 05 November) respectively.
In this research, to assess the variation of total
rainfall in the future, the author used empirical
cumulative distribution curves (ECD). However,
other CDF may give better fitting. The results are
shown in Figure 5.
Figure 3. a) and b) the spatial distribution of
heavy rainfall rate by Tropical Rainfall
Measuring Mission Microwave Imager and the
average simulation results of nineteen ensemble
members from 03UTC to 04 UTC 31 October
2008 respectively.
KHOA HỌC KỸ THUẬT THỦY LỢI VÀ MÔI TRƯỜNG - SỐ 66 (9/2019)
Figure 4. Maximum six-hourly rainfall amount
and total rainfall amount (from 06UTC 30
October to 00UTC 05 November) for each
simulation and ensemble mean result.
141
Figure 5. The Empirical Cumulative distribution
curves of total rainfall simulated by three CMIP5
models and CTL runs
From Figure 5, it is clear that there is a
significant increase in the amount of total rainfall
in three models. For instance, an assumption that
the probability of total heavy rainfall is 10% (the
CDF is 90%), the highest increase in heavy
rainfall would be ACCESS1-0 model, next is
CNRM-CM5 and GFDL-CM3 models with
respectively when compared with CTL run. It
means that the total heavy rainfall similar to
precipitation events in 2008 would tend to
increase significantly in the future because of
global warming.
3.2.2. The spatial distribution of heavy
rainfall
1. Spatial distribution of Six-hourly rainfall
Figure 6 shows the spatial distribution of
maximum six-hourly rainfall from 06:00UTC 30
October to 00:00UTC 05 November and the
difference heavy rainfall between three CMIP5
models and CTL runs. The average spatial
distribution of heavy rainfall area from nineteen
ensemble members seems to increase and shift to
the north-northeast and the north central coast
regions of Vietnam. Especially in CNRM-CM5
the heavy rainfall area increases from 18oN to
22oN latitude, 104oE to 106oE longitude, but the
results of ACCESS1-0, the heavy rain band seems
to concentrate in the middle part of northern
Vietnam (104oE to 106oE longitude). The heavy
rain band in the coastal regions of northern
Vietnam would decrease in the future.
142
Figure 6. The spatial distribution of maximum sixhourly rainfall of CTL runs and the difference
between three CMIP5 models and CTL runs. Leftand right-hand color bars are for the maximum
six-hourly rainfall and the differences between
three CMIP5 models and CTL (mm), respectively
Figure 7. The spatial distribution of total rainfall
of CTL runs and the difference between three
CMIP5 models and CTL runs. Left and right-hand
colorbars are for the maximum total rainfall and
the differences between three CMIP5 models and
CTL (mm), respectively.
2. Spatial distribution of total rainfall.
Figure 7 displays the spatial distribution of
total rainfall of CTL runs and the difference
between three CMIP5 models and CTL run. The
simulation results of three models show an
increase heavy rainfall in the west-northeast
region of Vietnam, from longitude 104.5oN to
106.5oN, and 18oE to 23oE, especially in some
provinces such as Ha Giang, Tuyen Quang, Phu
Tho, Hoa Binh, and Thanh Hoa provinces. The
total mean rainfall simulated by 3 PGW
experiments increases to near 400 mm when
KHOA HỌC KỸ THUẬT THỦY LỢI VÀ MÔI TRƯỜNG - SỐ 66 (9/2019)
compared with CTL runs. Meanwhile, the total
rainfall seems to decrease to 200 mm in the Red
River Delta and the north-northeast regions of
Vietnam such as Hanoi, Ha Nam, Quang Ninh,
and Thai Binh… provinces.
4. CONCLUSIONS
This study aims to perform a hindcast of heavy
rainfall in the northern region of Vietnam from 30
October to 05 November 2008, and investigate the
variations in torrential rain under global warming
climate conditions using the PGW method. In the
hindcast and the simulations using the PGW
method, 19 ensemble members were prepared based
on the LAF method.
In the hindcast, the torrential rains were
underestimated in some regions when compared to
observation data. In the future simulations, the sixhourly heavy rainfall amount slightly decreases,
while, total rainfall increases significantly when
compared with control run values in all models. The
fluctuation of six-hourly and total rainfall was wide
among ensemble members of CTL runs and three
CMIP5 models. Torrential rains may occur over
short periods and larger areas in future climate
conditions. The spatial distribution of precipitation
in three CMIP5 models would be larger than in the
CTL runs. The cumulative distribution curves of the
maximum total precipitation showed clear
differences between current and future climate
conditions. The results indicate that under the
climate change condition, the heavy rainfall event
similar to 2008 would be expected to increase
significantly when compared with the current
climate. This is because, under the global warming,
saturated water vapour will increase and the warmer
SST will provide more water vapour.
Only one heavy rainfall event was examined and
the conclusions drawn about variations in heavy
rainfall due to future global warming may include
some uncertainty. It is thought that the results of this
study are the frst step in evaluating heavy rainfall,
and investigation of other rainfall event, as well as
the use of additional AOGCMs and climate change
scenarios, will be indispensable for assessing
changes in heavy rainfall due to climate change.
REFERENCES
Cavazos, T., Turrent, C., Lettenmaier, D.P. 2008. "Extreme precipitation trends associated with tropical
cyclones in the core of the North American monsoon." Geophys Res Lett no. 35:L21703.
Das, S., Ashrit, R., Iyengar, G. R., Mohandas, S., Gupta, M. D., George, J. P., Rajagopal, E., and Dutta,
S. K. 2008. "Skills of different mesoscale models over Indian region during monsoon season:
Forecast errors." J. Earth Syst. Sci no. 117:603-620.
Francis, P.A; Gadgil S. 2006. "Intense rainfall events over the west coast of India." Meteorol Atmos
Phys no. 94:27-42.
Goswami B. N, Venugopal V, Sengupta D, Madhusoodanan M. S, and Xavier P. K. 2006. "Increasing
trend of extreme rain events over India in a warming environment." Science no. 314 (5804):1442-5.
doi: 10.1126/science.1132027.
IPCC. 2012. "Managing the risks of extreme events and disasters to advance climate change
adaptation. A Special Report of Working Groups I and II of the Intergovernmental Panel on
Climate Change. In: Field CB, Barros V, Stocker TF, Qin D, Dokken DJ, Ebi KL, Mastrandrea
MD, Mach KJ, Plattner G-K, Allen SK, Tignor M, Midgley PM (eds)." Cambridge University
Press, Cambridge 582 pp.
Kobayashi, S., Y. Ota, Y. Harada, A. Ebita, M. Moriya, H. Onoda, K. Onogi, H. Kamahori, C.
Kobayashi, H. Endo, K. Miyaoka, and K. Takahashi. 2015. "The JRA-55 Reanalysis: General
specifications and basic characteristics." J. Meteor. Soc. Japan no. 93:5-48.
Lee, D. K., H. R. Kim, and S. Y. Hong. 1998. "Heavy rainfall over Korea during 1980–1990." Kor. J.
Atmos. Soc no. 1:32-50.
KHOA HỌC KỸ THUẬT THỦY LỢI VÀ MÔI TRƯỜNG - SỐ 66 (9/2019)
143
Lee, T. C. K., F. C. Zwiers., X. Zhang., M. Tsao. 2006. "Evidence of decadal prediction skill resulting
from changes in anthropogenic forcing." J. Climate no. 19:5305–5318.
Li, L., Gochis, D. J., Sobolowski, S., and Mesquita, M. D. 2017. "Evaluating the present annual water
budget of a Himalayan headwater river basin using a high‐resolution atmosphere‐hydrology
model." J. Geophys. Res. [Atmos.] no. 122:4786-4807.
Lin, Y.-L., Farley, R. D., and Orville, H. D. 1983. "Bulk parameterization of the snow field in a cloud
model." J. Climate Appl. Meteor no. 22:1065–1092.
NCEP. 2000. "NCEP FNL Operational model global tropospheric analyses, continuing from July
1999." Research Data Archive at the National Center for Atmospheric Research, Computational and
Information Systems Laboratory. Boulder, CO,. doi: />Reynolds, R. W., T. M. Smith, C. Liu, K. S. Casey, and M. G. Schlax. 2007. "Daily high-resolution
blended analysis for sea surface temperature." J. Climate no. 20:5473-5496.
Sato, T., F. Kimura, and A. Kitoh. 2007. "Projection of global warming onto regional precipitation over
Mongolia using a regional climate model." J. Hydrol no. 333:144-154.
Taylor K.E., Stouffer R.J., Meehl G.A. 2012. "An Overview of CMIP5 and the experiment design." Bull.
Amer. Meteor. Soc. no. 93:4.
Tran, L.Q, and K. Taniguchi. 2016. "Simulations of Heavy Rainfall from a Tropical Cyclone in Coastal Regions
of Vietnam under the Global Warming." Journal of Climate change no. 2 (2):25–34.
Von Storch, J-S. 2008. "Toward climate prediction: Interannual predictability due to an increase in
CO2 concentration as diagnosed from an ensemble of AO GCM integrations." J. Climate.
Wheater H.P. 2002. "Progress in and prospects for fluvial flood modelling." Philos Trans R Soc
London, Ser A no. 360:1409–1431.
Young, P. C. 2002. "Advances in real-time flood forecasting." Philos Trans A Math Phys Eng Sci no.
360 (1796):1433-50. doi: 10.1098/rsta.2002.1008.
Tóm tắt:
THAY ĐỔI CỦA MƯA LỚN TRONG KHU VỰC PHÍA BẮC CỦA VIỆT NAM DƯỚI
TÁC ĐỘNG CỦA SỰ NÓNG LÊN TOÀN CẦU: MỘT NGHIÊN CỨU CỦA TRẬN MƯA
TỪ 30 THÁNG 10 ĐẾN 05 THÁNG 11 NĂM 2008
Trong bài báo này, mưa lớn ở khu vực phía Bắc của Việt Nam từ ngày 30 tháng tới ngày 05 tháng 11
năm 2008 được lựa chọn để mô phỏng, dự báo, sử dụng mô hình nghiên cứu và dự báo thời tiết (WRF)
kết hợp với phương pháp mô phỏng tổ hợp. Dự báo sự thay đổi lượng mưa trong tương lai sử dụng mô
phỏng số học dựa trên các điều kiện giả định sự nóng lên toàn cầu dựa trên 3 mô hình khí tượng toàn
cầu GCM trong bộ mô hình CMIP5. Các kết quả mô phỏng lượng mưa 6 giờ lớn nhất cho thấy có sự
giảm nhẹ về cường độ trong vùng phía Bắc của Việt Nam, trong khi đó, tổng lượng mưa của trận mưa
tăng lên đáng kể trong tất cả 3 mô hình lựa chọn mô phỏng trong tương lai. Sự phân bố của mưa lớn có
xu hướng dịch chuyển lên vùng núi phía Bắc của Việt Nam. Kết quả mô phỏng chỉ ra rằng sự nóng lên
toàn cầu có tương quan lớn với sự gia tăng của lượng mưa trong tương lai.
Từ khoá: lượng mưa lớn, sự nóng lên toàn cầu, mô phỏng tổ hợp
Ngày nhận bài:
24/7/2019
Ngày chấp nhận đăng: 29/8/2019
144
KHOA HỌC KỸ THUẬT THỦY LỢI VÀ MÔI TRƯỜNG - SỐ 66 (9/2019)