Evaluation of air pollution tolerance index and anticipated performance index of plants and their role in development of green belt along national highway-22
Bạn đang xem bản rút gọn của tài liệu. Xem và tải ngay bản đầy đủ của tài liệu tại đây (231.86 KB, 11 trang )
Int.J.Curr.Microbiol.App.Sci (2019) 8(3): 2498-2508
International Journal of Current Microbiology and Applied Sciences
ISSN: 2319-7706 Volume 8 Number 03 (2019)
Journal homepage:
Original Research Article
/>
Evaluation of Air Pollution Tolerance Index and Anticipated Performance
Index of Plants and their Role in Development of Green Belt
along National Highway-22
Kashish Walia*, R.K. Aggrawal and S.K. Bhardwaj
Department of Environmental Science, Dr. Y S Parmar University of Horticulture and
Forestry, Nauni - 173 230 (Solan), India
*Corresponding author
ABSTRACT
Keywords
Bio indicators,
Biochemical
parameters, APTI, API
Article Info
Accepted:
18 February 2019
Available Online:
10 March 2019
Plants play an important role in mitigating air pollution. In such a scenario where problems
due to air pollution are faced worldwide screening of sensitive and tolerant plants which
acts as a bio indicator and sinks for air pollution is extremely significant. Therefore,
present study was designed to evaluate the Air Pollution Tolerance Index (APTI) of six
roadside plant species namely Cassia fistula, Grevillea robusta, Grewia optiva, Leucaena
leucocephela, Toona ciliate and Woodfordia floribunda growing alongside a selected
stretch of National Highway 22 (Datiyar to Solan) in Himachal Pradesh, India. The
Anticipated Performance Index (API) of these plant species was also calculated by
considering their APTI values with biological and socio-economic characters (plant height,
canopy structure, type of plant, laminar characteristics, texture, hardiness and economic
value). The study indicated that Cassia fistula with highest APTI value of 23.5 and highest
API score is best for green belt development.
Introduction
The blooming growth in Indian economy in
terms of industrialization, urbanization and
modernization has lead to increase in various
economic activities, where road development
has become an integral part, ameliorating the
efficient connectivity, financial and social
welfare of the people. But such activities go
hand in hand causing damage to the natural
assets of the environment to a greater or a
lesser extent by disturbing the existing
ecosystem. Air pollution due to expansion and
vehicular emissions has become one of the
most serious problems and has resulted in
huge threat to both the environment and the
health of living organisms like plants, animals
and humans (Kaur and Nagpal, 2017). The
combustion activities also adds toxic gases
like SOX, NOX, CO and particulate matter
into the air which includes soot particles as
well as smaller quantities of toxic metals,
organic molecules and radioactive isotopes
(Bhattacharya et al., 2013). Plants growing
along the roadsides get affected at the
maximum as they are the primary recipients to
different air pollutants and show varied levels
of tolerance and sensitivity and also plays an
important role in monitoring and maintaining
the
ecological
balance
by
actively
2498
Int.J.Curr.Microbiol.App.Sci (2019) 8(3): 2498-2508
participating in the cycling of nutrients and
gases like carbon dioxide and oxygen
(Mahecha et al., 2013). The air pollutant once
released into the atmosphere cannot be traced
or identified by any device chemically or
mechanically, only plants can absorb and
metabolise these pollutants from the
atmosphere. Therefore, the role of plants in
assessing the air pollution is being
increasingly recognised and is used in
evaluating the Air Pollution Tolerance Index
which is a species dependent plant attribute
and expresses the inherent ability of plant to
encounter stress arising from air pollution and
helps in identifying the tolerance levels of
plant species based on biochemical parameters
viz. ascorbic acid, pH of leaf extract, total
chlorophyll and relative water content
(Shannigrahi et al., 2003).
Plants with higher APTI value are tolerant to
air pollution and can be used to mitigate air
pollution while those with low index value
show less tolerance and can be used to signify
levels of air pollution (Madan and Chauhan,
2015). The APTI index evaluates the effect of
pollutants only on biochemical parameters, but
in order to combat air pollution using green
belt development, some biological and socioeconomic characteristics are also considered
and used to develop the anticipated
performance index (API) (Govindaraju et al.,
2012).
The expansion of NH-22 from Timber-Trail
resort in Datiyar to Solan has deteriorated the
air quality as being perceived by urban
dwellers because of developmental activity
and large vehicular density in the area, as the
road stretch being a part of tourist route and
connecting the cities of Chandigarh, Ambala,
Kalka, Parwanoo and Shimla the state capital
city of Himachal Pradesh carries a significant
heavy traffic to and fro from Shimla and other
parts of the State. Hence all these activities
have highly deteoriated the air quality.
Therefore, the present study can help in
screening out the air pollution tolerant plant
species and calculating their anticipated
performance index (API) which can be used as
an indicator to assess the capability of
predominant species for cleaning up of the
atmospheric pollutants and in development of
the green belt along the National Highway.
Materials and Methods
Study area
The entire study area extends on National
Highway-22 which connects Firozepur,
Punjab in the North end to Shipki La, SinoIndian border to the South end. The study area
covers a part of NH-22 of Solan district from
Timber-Trail resort in Datiyar to Solan
covering a distance of about 40 kms. The
Highway lies between North latitude of
30°44’53” to 31°22’01” and East longitude of
76°36’10” to 77°15’14”. The study area has
high vehicular density as it is a major part of
tourist route connecting the cities of
Chandigarh, Ambala, Kalka, Parwanoo and
Shimla, the capital city of Himachal Pradesh.
Survey of the study area
In order to study the distribution of plants
growing alongside the national highway and to
screen out the most tolerant plants species to
pollution a detail survey of National Highway22 was conducted from Datiyar to Solan. The
vegetation distribution study was carried by
using quadrat method and in order to maintain
the uniformity, plants of same age and spread
growing at iso-ecological conditions were
selected for the study.
The commonly occurring plant species
identified and selected were Cassia fistula,
Grevillea robusta, Grewia optiva, Leucaena
leucocephela, Toona ciliate and Woodfordia
floribunda.
2499
Int.J.Curr.Microbiol.App.Sci (2019) 8(3): 2498-2508
Experimental details
In order to conduct the present study the
National Highway 22 was divided into four
uniform segments based on distance and each
segment was considered as one replication.
The six commonly growing plant species viz.
Cassia fistula, Grevillea robusta, Grewia
optiva, Leucaena leucocephela, Toona ciliate
and Woodfordia floribunda were selected
from both the sides of the National Highway.
In total there were 24 treatment combinations
(6 x 4) which were replicated four times under
factorial Randomized Block Design. The data
for the two sides (left and right) of the national
highway was clubbed for statistical analysis
and the results were statistically analyzed and
interpreted by using Statistical Package
Software version 21.
Sample collection and analysis
To assess the APTI based on the four
parameters namely leaf ascorbic acid, leaf
extract pH, total chlorophyll, and relative
water content fully matured leaves of selected
plant species were collected randomly from
both sides of the road in the morning hours at
almost same diameter at breast height (DBH).
The leaf samples were then transported to the
laboratory in ice – box and washed with
normal water and then with 0.1N HCL
followed by washing with distilled water.
Further, the analysis of physiological and
biochemical parameters of leaf samples were
carried out as per the standard procedures as
mentioned below:
Analysis of biochemical parameter
volume of the filtrate was made to 100ml by
metaphosphoric acid (3%). The aliquot
measuring 10ml was taken and titrated against
standardized dye to an end point of pink
colour as per the standard procedure outlined
by Association of Official Agricultural
Chemists (1980). The ascorbic acid content
was expressed in milligrams per grams
(mg g-1).
Dye factor × Titre reading ×
Volume made × 100
Ascorbic acid (mg/100g) = ----------------------Weight of leaves taken ×
Volume taken for estimation
Leaf extract pH
Leaf extract pH of the sample was analyzed by
the method suggested by Barrs and Weatherly
(1962). Fresh leaf sample (10g) was
homogenized using deionised water (50ml)
and
the
supernatant
obtained
after
centrifugation was collected for the
determination of pH using a digital pH meter.
Total chlorophyll
For the estimation of total chlorophyll content
of the leaves, 10mg of the leaf sample was
homogenized with 7ml dimethyl-sulphoxide
and was kept in oven at a temperature of 6065ºC for 30-35mins.
The samples were filtered and volume was
made to 25ml by dimethyl-sulphoxide. The
absorbance was measured at 663nm and
645nm in spectrophotometer and chlorophyll
was estimated using the following equation
given by Hiscox and Istaelstam (1979)
Ascorbic acid
To estimate leaf ascorbic acid content of
selected plant species 10g of the sample was
taken. The sample was homogenized in
metaphosphoric acid (3%) and filtered. The
20.2 A645 + 8.02 A663
Total chlorophyll (mg g-1) = --------------- x V
a × 1000 × w
Where;
2500
Int.J.Curr.Microbiol.App.Sci (2019) 8(3): 2498-2508
V is volume of extract made
a is length of light path in cell (usually 1cm)
W is weight of sample
A645 is absorbance at 645nm
A663 is absorbance at 663nm
characters (plant height, canopy structure,
plant size texture, hardness and economic
value) the API was calculated for different
plant species. Based on these characters,
different grades (+ or -) are allotted to plants.
Different plants are scored according to their
grades as per the procedure outlined by
Mondal et al., (2011).
Relative water content
Relative water content of the samples was
estimated using the method proposed by Singh
(1977) and was computed by using following
equation
(FW – DW)
RWC = -------------------- × 100
(TW – DW)
Results and Discussion
Biochemical parameters
Leaf ascorbic acid content
Where;
RWC is relative water content (%)
FW is fresh weight of leaf sample
DW is dry weight of leaf sample
TW is turgid weight of leaf sample
Air pollution tolerance index (APTI)
The Air pollution tolerance index based on
leaf biochemical parameters was computed by
using the following formulae given by Singh
and Rao (1983).
[A (T +P)] + R
APTI = -------------------10
Where;
A is ascorbic acid (mg g-1) of leaf sample
T is total chlorophyll (mg g-1) of leaf sample
P is leaf extract pH of leaf sample
R is relative water content (%) of leaf sample
Anticipated Performance Index
By combining the resultant APTI values with
some relevant biological and socioeconomic
The different plant species growing along
National Highway -22 were found to exhibit
significant variations in leaf ascorbic acid
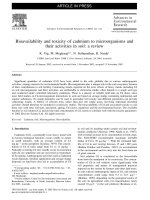
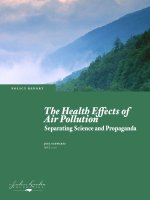
content Fig.1. The ascorbic acid content of
selected plant species varied from 2.85 to
10.22 mg g-1. Among the selected plant
species the highest ascorbic acid content was
recorded in Cassia fistula (10.22 mg g-1).
Whereas, lowest was observed in Grewiallia
robusta (2.85 mg g-1). The order of ascorbic
acid content in leaves of selected plant species
was Cassia fistula (10.22 mg g-1) > Leuceana
leucocephala (9.58 mg g-1) > Woodfordia
fruticosa (7.33 mg g-1) > Toona ciliata (5.26
mg g-1) > Grewia optiva (5.18 mg g-1) >
Grewiallia robusta (2.85 mg g-1). Ascorbic
acid is a natural antioxidant that influences the
resistance of plants against adverse
environmental conditions and helps in
pollution
tolerance
(Subramani
and
Devaanandan, 2015). Different developmental
activities and vehicular emissions leads to air
pollution especially in areas with high traffic
and higher commercial activities and enhances
production of more antioxidants in response to
stress conditions. The results are in conformity
with the findings of Prajapati and Tripathi
(2008). Higher ascorbic acid content in the
leaves of Cassia fistula may probably be due
to improvement in the defence mechanism of
the plants which has been reported to be
2501
Int.J.Curr.Microbiol.App.Sci (2019) 8(3): 2498-2508
different for different plant species by (Chen
et al., 2007). Trees under stress improve their
ascorbic acid content to improve their capacity
to fight against adverse conditions. The results
are in line with the findings of Yannawar and
Bhosle (2013) who have also reported higher
ascorbic acid content in the leaves of the
plants growing near roadside due to higher
pollution stress
could be attributed to their inherent capacity to
tolerate the pollution stress along roadside as
well as due to vehicular pollution in the
selected stretch of the National Highway. The
results are in line with the findings of Ninave
(2001). Higher the level of automobile
pollution higher is the decrease in leaf
chlorophyll content of plants near roadside
(Mir, 2008).
Total chlorophyll content
Leaf extract pH
The leaf Chlorophyll content of the different
plant species varied significantly from 9.18
mg g-1 to 1.36 mg g-1 along the National
Highway 22 Fig.1. In the selected stretch,
among the six selected plant species highest
leaf chlorophyll content was recorded in
Cassia fistula (9.18 mg g-1) whereas lowest
was recorded Woodfordia fruticosa (1.36 mg
g-1). The order of leaf chlorophyll content in
the leaves of selected species was Cassia
fistula > Leuceana leucocephala > Toona
ciliata > Grewiallia robusta> Grewia optiva >
Woodfordia fruticosa. The leaf Chlorophyll
content of plants signifies its photosynthetic
activity as well as the growth and
development of biomass. The chlorophyll
content varies from species to species and also
with the pollution level as well as with other
biotic and abiotic conditions (Begum and
Harikrishna, 2010). Higher the chlorophyll
contents higher the tolerance to pollution
(Joshi et al., 1993).
The different plant species along National
Highway 22 were found to exhibit significant
variations in leaf extract pH of selected plants
species. Figure 1 indicates that leaf extract pH
of different plant species along National
Highway varied from 5.82 - 6.77. Among the
selected species Cassia fistula was noticed to
have maximum leaf extract pH of 6.77.
Whereas, minimum was observed in
Grewiallia robusta (5.82). The order of leaf
extract pH of selected plant species was
Cassia fistula (6.77) followed by Leuceana
leucocephala (6.46), Grewia optiva (6.33),
Toona ciliata (6.20), Woodfordia fruticosa
(5.85), Grewiallia robusta (5.82). The
variations in leaf extract pH in selected plants
along National Highway could be attributed
due to the varied genetic composition of the
plant species. Higher level leaf extract pH in
Cassia fistula indicates the tolerance of plant
under polluted conditions. The results are in
line with (Gholami et al., 2016) who stated
that the reduction in pH value is more in
sensitive plants compared to those in tolerant
plants. Further, lower value of leaf extract pH
in selected plants species growing at traffic
and commercial areas may be ascribed due to
highest level of vehicular pollution and
developmental activities in these areas.
Similar results were also observed by Singare
and Talpade (2013) who also reported that the
leaf extract pH tend to decrease with the
increase in pollution with respect to nonpolluted site.
The chlorophyll content in all the plants varied
with the tolerance as well as sensitivity of the
plant species to pollution load i.e. higher the
sensitive nature of the plant species lower the
chlorophyll content. These results are
supported by the findings of Joshi et al.,
(1993). Further, automobile exhaust and other
anthropogenic activities at traffic site are
responsible for reduced concentration of
chlorophyll. The variation in chlorophyll
content in the leaves of selected plants species
2502
Int.J.Curr.Microbiol.App.Sci (2019) 8(3): 2498-2508
Table.1 Gradation of plant species based on air pollution tolerance index as well as
morphological parameters and socio-economic importance
Grading Character
Tolerance
APTI
Biological
and Plant habit
socio-economic
Canopy
Structure
Type of plant
Laminar structure
Leaf size
Texture
Hardiness
Economic
value
Pattern of assessment
9.0–12.0
12.1–15.0
15.1–18.0
18.1–21.0
21.1–24.0
Small
Grade allotted
+
++
+++
++++
+++++
-
Medium
Large
Sparse/irregular/globular
+
++
-
Spreading crown/open/semidense
Spreading dense
Deciduous
Evergreen
Small
Medium
Large
Smooth
Coriaceous
Delineate
Hardy
Less than three uses
+
++
+
+
++
+
+
-
Three or four uses
+
Table.2 Anticipated performance index (API) of plant species
Grade
0
1
2
3
4
5
6
7
Score
Up to 30
31-40
41-50
51-60
61-70
71-80
81-90
91-100
Assessment category
Not recommendation for plantation
Very poor
Poor
Moderate
Good
Very good
Excellent
Best
2503
Int.J.Curr.Microbiol.App.Sci (2019) 8(3): 2498-2508
Table.3 Evaluation of API of plant species based on their APTI values and some other biological
and socio-economic characters
Sr. No.
1.
2.
3.
4.
5.
6.
Plant species
Woodfordia fruticosa
Grewia optiva
Toona ciliata
Greviallia robusta
Leuceana leucocephela
Cassia fistula
Total grade allotted
3
8
10
8
8
10
% Score
18.75
50.00
62.50
50.00
50.00
62.50
API value
0
2
4
2
2
4
Assessment
Not recommended
Poor
Good
Poor
Poor
Good
Plant species
Assessment parameters
APTI
TREE HABIT
CANOPY
STUCTURE
TREE TYPE
SIZE
TEXTURE
HARDINESS
ECONOMIC
IMPORTANC
E
TOTAL PLUS
% SCORING
API GRADE
Table.4 Assessment based on anticipated performance index of selected plant species
laminar structure
Grade alloted
Woodfordia fruticosa
Grewia optiva
Toona ciliata
Grewiallia robusta
Leuceana leucocephela
Cassia fistula
+
+
++
+
+++
+++++
+
++
++
+
+
+
+
+
-
+
+
+
+
++
++
++
++
+
+
-
+
+
+
+
-
++
+
++
+
18.75
50.00
62.50
50.00
50.00
62.50
0
2
4
2
2
4
3
8
10
8
8
10
Fig.1 Variations in the biochemical parameters and APTI values of selected plant species
2504
Int.J.Curr.Microbiol.App.Sci (2019) 8(3): 2498-2508
Leaf relative water content
The relative water content varied significantly
among the different plant species growing
along the National Highway -22. The relative
water content of selected plant species varied
from 72.07-57.58% (Fig. 1). Among the six
selected species Toona ciliate was found to
have maximum (72.07%) relative water
content while the minimum of 57.58% was
observed in Woodfordia fruticosa. The order
of relative water content in the leaves of
selected plant species was Toona ciliate >
Cassia fistula> Leuceana leucocephala >
Grewia optiva> Grewiallia robusta>
Woodfordia fruticosa with the respective
values of 72.07%, 72.02%, 70.47%, 64.65%,
62.27%, 57.58%. The variation in RWC in
plants may be due to difference in plants
species (Nwadinigwe, 2014). The leaf relative
water content is the amount of moisture a
plant holds and is an indicator of hydration
condition in the leaf matrix. The highest value
of relative water content in Toona cilata may
be ascribed due to its higher resistant capacity
to stress conditions and maintenance of
relative water content under polluted
conditions by the plant may determine its
relative tolerance to pollution (Verma, 2003;
Gholami et al., 2016). Plants at polluted site
absorbed more water this could be a
physiological mechanism of the plants to
withstand the effect of pollution in its
environment (Tanee et al., 2014). The trend
of higher RWC in the plants growing
alongside the National Highway may be
ascribed to relatively lower rate of
transpiration at polluted sites which might
have resulted in the leaves of the plants. The
results are in line with Bora and Joshi (2014).
Air pollution tolerance index
The plant growing alongside the National
Highway-22 varied significantly in their
tolerance levels. Among the selected species
the highest APTI of 23.50 was recorded for
Cassia fistula which was followed by
Leuceana leucocephala (17.10), Toona ciliata
(11.61), Woodfordia fruticosa (11.04),
Grewia optiva (10.50) while the lowest value
of 8.50 was noted in Grewiallia robusta.
Fig.1. The variation in the tolerance of the
trees of a region to air pollution has also been
reported by Lakshmi et al., (2008); Agbaire
and Esiefarienrhe (2009). The higher value of
APTI in Cassia fistula may be due to
increased production of ascorbic acid and
higher relative water content during pollution
stress (Kuddus et al., 2011). The highest
APTI of the plants near the highway may be
ascribed to the reason that the trees in order to
adapt the stress due to auto exhaust pollution
improve their tolerance capacity. Tolerance to
air pollution alters from species to species
depending on plants capacity to endure the
effect of pollutants (Gholami et al., 2016).
The higher APTI adjacent to National
Highway showed higher tolerance of plant
species to air pollutants (Jyothi and Jaya,
2010). It has been reported that tolerance of
plant towards air pollutants is specific to a site
and depends on the type and level of pollution
(Noor et al., 2015).
Anticipated performance index
API is used as an indicator to assess the
capability of predominant species for the
abatement of the atmospheric pollutants and
in green belt development. The anticipated
performance index calculated by evaluation
and grading of tree species based on their
APTI and some biological and socioeconomic characters showed a variation from
not recommended category to the category
good. The highest values of API (4) were
calculated in Cassia fistula and Toona ciliata
and were considered as Good for Green belt
development and Leuceana leucocephala,
Grewia optiva and Grewiallia robusta with
API value of (2) were assessed as poor
2505
Int.J.Curr.Microbiol.App.Sci (2019) 8(3): 2498-2508
whereas Woodfordia with APII value of zero
was assessed as not recommended Table.4.
The highest API of Cassia fistula may be due
to its high APTI. API value is more for the
species with higher APTI having better plant
and leaf characteristics (Prajapati and
Tripathi, 2008). Among all the plant species
Cassia fistula was the most tolerant species
and also this species has the high economic
and aesthetic value. Hence it can be
recommended for the plantation in the
polluted areas. From the present investigation
it can be concluded that all the biochemical,
physiological, biological as well as
socioeconomic parameters of the plant species
play an important role in determining the
sensitivity and tolerance of plants to air
pollution with reference to their tolerance and
performance index. The study indicated that
Cassia fistula should be considered for
plantation alongside the National Highway 22
because of its highest tolerance capacity to
pollution and high anticipated performance
index among the commonly growing species.
Tsega and Deviprasad (2014) also concluded
that plant species with high API values should
be recommended for establishment of the
green belts.
Acknowledgment
The author is thankful to the Department of
Environmental Sciences, Dr. Y.S Parmar
UHF, Nauni, Solan for providing necessary
facilities and sincere gratitude is expressed to
Dean College of Forestry for providing
financial support to conduct the study.
References
A. O. A. C. 1980. Official methods of
analysis of the analytical chemist, 13th
ed. (W. Horwitz, ed.). Association of
Analytical Chemists. 83: 617-623.
Agbaire, P. O. and Esiefarienrhe, E. 2009. Air
Pollution Tolerance Indices (APTI) of
some plants around Otorogun gas plant
in Delta state, Nigeria. J. Applied Sci.
Environ. Manage. 13(1): 11-14.
Barrs, H. D. and Weatherly, P. E. 1962. A reexamination of the relative turbidity
technique for estimating water deficit in
leaves. Australian Journal of Biological
Sciences. 15: 413-42.
Begum, A. and Harikrishna, S. 2010.
Evaluation of some tree species to
absorb air pollutants in three industrial
locations of South Bengaluru, India.
Journal of Chemistry. 7(1): 151-156.
Bhattacharya, T., Kriplani, L., and
Chakraborty, S., 2013. Seasonal
Variation in Air Tolerance Index of
Various Plant Species of Baroda City,
Universal Journal of Environmental
Research and Technology. 3(2): 199208.
Bora Meha and Joshi Namita. 2014. A study
on variation in biochemical aspects of
different tree species with tolerance and
performance index. The Bioscan 9(1):
59-63.
Cheng F. Y., Burkey K. O., Robinson J. M.
and Booker F. L. 2007. Leaf
extracellular ascorbic in relation to O3
tolerance of two soybean cultivars.
Environmental Pollution 150: 355-362
Gholami, A., Mojiri, A. and Amini, H. 2016.
Investigation of the air pollution
tolerance index using some plant
species in Avhaz region. Journal of
Animal and Plant Sciences. 26 (2): 475480.
Govindaraju, M., Ganeshkumar, R. S.,
Muthukumaran, V. R. and Visvanathan,
P. 2012. Identification and evaluation of
air pollution tolerant plants around
lignite-based thermal power station for
greenbelt development. Environmental
Science and Pollution Research. 19 (4):
1210–1223.
Hiscox, J. D. and Israelstam G. F. 1979. A
method for the extraction of chlorophyll
2506
Int.J.Curr.Microbiol.App.Sci (2019) 8(3): 2498-2508
from leaf tissue without maceration.
Canadian Journal of Botany. 57: 13321334.
Joshi U. N., Rathore S. S and Arora S. K.
1993. Effect of chromium on growth
and development of cowpea (Vigna
unguiculata L). Indian Journal of
Environment Protection. 19: 745-749
Jyothi, J. S. and Jaya, D. S. 2010. Evaluation
of air pollution tolerance index of
selected plant species along roadsides in
Thiruvanthapuram, Kerala. Journal of
Environmental Biology. 31: 379-386.
Kaur, M. and Nagpal, A.K., 2017. Evaluation
of air pollution tolerance index and
anticipated performance index of plants
and their application in development of
green space along the urban areas.
Environmental Science and Pollution
Research. 24(23): 18881-18895.
Kuddus, M., Kumari, R. and Ramteke, P. W.
2011. Studies on air pollution tolerance
of selected plants in Allahabad city,
India. J. Environmental Research and
Management. 2(3): 042-046.
Lakshmi, P. S., Sravanti, K. L. and Srinivas,
L. 2008. Air pollution tolerance index
of various plant species growing in
industrial areas. The Ecoscan. 2(2):
203-206.
Madan, S. and Chauhan, S. 2015. Air
pollution
tolerance
index
and
anticipated performance index of
selected plant species in Haridwar City,
India. Report and Opinion. 7 (6): 32-37.
Mahecha G.S., Bamniya, B.R., Nair, Neelima
and Saini D. 2013. Air pollution
tolerance index of certain plant speciesA study of Madri Industrial Area,
Udaipur (Raj.), India, Int. J. Innovative
Res. Sci. Engg. Tech. 2(12): 7927-7929.
Mir, Q. A. 2008. Vehicular pollution and
pigment content of certain avenue trees.
Poll. Res. 27: 59-63. Mir QA, Yazdani
T, Kumar A, Narain K, Yunus M.
Vehicular population and pigment
content of certain avenue trees. Pollut
Res 2008; 27: 59-63.
Mondal, D., Gupta, S. and Kumar, J.D. 2011.
Anticipated performance index of some
tree species considered for green belt
development in an urban area.
International Research Journal of Plant
Science. 2(4): 99-106
Ninave, S. Y. 2001. Biochemical features of
plants as indicators of air pollution.
Bulletin
of
Environmental
Contamination and Toxicology. 67(1):
133-140.
Noor, M. J., Sultana, S., Fatima, S., Ahmad,
M., Zafar, M., Sarfraz, M., Balkhyour,
M. A., Safi, S. Z. and Ashraf, M. A.
2015. Estimation of Anticipated
Performance Index and Air Pollution
Tolerance Index of vegetation around
the marble industrial areas of Potwar
region: bioindicators of plant pollution
response. Environmental Geochemistry
and Health. 37(3): 441-455.
Nwadinigwe, A. O. 2014. Air pollution
tolerance indices of some plants around
Ama industrial complex in Enugu State,
Nigeria.
African
Journal
of
Biotechnology. 13(11): 1231-1236.
Prajapati, S. K. and Tripathi, B.D. 2008.
Seasonal variation of leaf dust
accumulation and pigment content in
plant species exposed to urban
particulates pollution. Journal of
Environmental Quality. 36: 704-705.
Shannigrahi, A. S., Sharma, R. C. and
Fukushima,
T.
2003.
Air
pollutioncontrol by optimal green belt
development for Victoria Memorial
Monument, Kolkata (India). Intern. J.
Environ. Studies. 60(3): 241-249.
Singare, P.U. and Talpade, M. S. 2013.
Physiological responses of some plant
species as a bio indicator of roadside
automobile pollution stress using the air
pollution tolerance index approach.
2507
Int.J.Curr.Microbiol.App.Sci (2019) 8(3): 2498-2508
International Journal of Plant Research
3(2): 9-16
Singh, A. 1977. Practical Plant Physiology.
Kalyari Publishers. New Delhi
Singh, S. K and Rao, D. N.1983. Evaluation
of the plants for their tolerance to air
pollution. Proceeding in: Symposium on
Air Pollution control held at IIT, Delhi.
pp. 218-224
Subramani, S. and Devaanandan, S. 2015.
Application of air pollution tolerance
index in assessing the air quality.
International Journal of Pharmacy and
Pharmaceutical Sciences. 7(7): 216221.
Tanee, F. B. G., Albert, E. and Amadi, B.R.
2014. Biochemical properties and Air
pollution tolerance indices of plants in
Port Harcourt city, Nigeria. British
Journal of Applied Science and
Technology. 4 (34): 4835-4845.
Tsega, Y. C. and Deviprasad, A.G. 2014.
Variation in air pollution tolerance
index and anticipated performance
index of roadside plants in Mysore,
India. Journal of Experimental Biology.
35: 185-190.
Verma, A. 2003. Attenuation of automobile
generated air pollution by higher plants.
Dissertation, University of Lucknow
(unpublished).
Yannawar, V. B. and Bhosle, A. B. 2013. Air
pollution tolerance index of various
plant species around Nanded city,
Maharastra,
India.
J.
Applied
Phytotechnology in Environmental
Sanitation. 3(1): 23-28
How to cite this article:
Kashish Walia, R.K. Aggrawal and Bhardwaj, S.K. 2019. Evaluation of Air Pollution
Tolerance Index and Anticipated Performance Index of Plants and their Role in Development
of Green Belt along National Highway-22. Int.J.Curr.Microbiol.App.Sci. 8(03): 2498-2508.
doi: />
2508