Coastal inundation due to sea level rise and extreme sea state and its potential impacts: Çukurova Delta case
Bạn đang xem bản rút gọn của tài liệu. Xem và tải ngay bản đầy đủ của tài liệu tại đây (4.62 MB, 10 trang )
Turkish Journal of Earth Sciences
Turkish J Earth Sci
(2013) 22: 671-680
© TÜBİTAK
doi:10.3906/yer-1205-3
/>
Research Article
Coastal inundation due to sea level rise and extreme sea state and its potential impacts:
Çukurova Delta case*
1,
2
3
Özlem SİMAV **, Dursun Zafer ŞEKER , Cem GAZİOĞLU
General Command of Mapping, Tıp Fakültesi Caddesi, Dikimevi, Ankara, Turkey
2
Faculty of Civil Engineering, İstanbul Technical University, Maslak, İstanbul, Turkey
3
Institute of Marine Sciences and Management, İstanbul University, Vefa, İstanbul, Turkey
1
Received: 14.05.2012
Accepted: 19.12.2012
Published Online: 13.06.2013
Printed: 12.07.2013
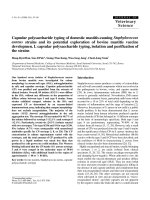
Abstract: With the rising sea level becoming a more pressing issue to coastal areas, a comprehensive analysis has been conducted to
assess the vulnerability of the Çukurova Delta under the projected inundation by the end of the century. The level of inundation was
estimated from a multimission satellite altimetry sea level anomaly and significant wave height data between September 1992 and
February 2012. Superposed to the clear annual oscillation with 6.2 cm amplitude peaking around the beginning of October, the mean
sea level signal exhibits a positive trend of 3.4 ± 0.1 mm/year over the altimetric data period. The extreme wave height with a 100-year
return period is estimated to be about 6.1 ± 0.03 m, based on extreme probability distribution of the significant wave height data. In
addition, taking the effects of tidal and meteorological forcings on the sea level into account, the maximum level of flooding expected to
occur by the year 2100 reaches up to 6.7 m. GIS-based inundation mapping on the high resolution elevation model indicates that 69%
of the area would be at risk of flooding. Nearshore settlements, lagoons, and the agricultural lands are the most severely impacted areas
due to the inundation. The results can contribute to enhancing wetland conservation and management in the Çukurova Delta.
Key words: Coastal vulnerability, inundation, satellite altimetry, GIS, Çukurova Delta, Turkey
1. Introduction
Coastal zones, considered to be a valuable economic and
environmental resource for human and marine habitats,
are the most dynamic natural environment of any region
on earth. Changes in the ocean–climate system and
increasing human activities in these regions make the
coastal areas more susceptible to natural hazards and
more costly to live in. One of the most serious problems
is the accelerated sea level rise and its resulting physical
impacts on the coastal zones. Any rise in the mean sea
level may result in the retreat of unprotected coastlines
due to coastal inundation, erosion, and increased storm
flooding (Nicholls et al. 1995). As emphasized in the
Fourth Assessment Report of the Intergovernmental Panel
on Climate Change (IPCC AR4), the global sea level rose
by 1.8 to 3.1 mm/year during the last century and present
estimates of future rise range from 18 cm to 59 cm by the
year 2100 (Solomon et al. 2007). Low lying areas such as
beach ridges, coastal plains, deltas, estuaries, lagoons, and
bays would be the areas that would suffer the most as a
result of the enhanced sea level rise. Thus, it is essential
to quantify the response of coastal systems to sea level
change, as well as to assess the potential threats posed to
human and marine biodiversity.
A near global comparative analysis by Dasgupta et al.
(2007) regarding the impact of permanent inundation
due to sea level rise on 84 developing countries revealed
that hundreds of millions of people in the developing
world are likely to be displaced by a sea level rise of 1 to
5 m within this century. Accompanying economic and
ecological damage will be severe for many. Approximately
0.3% (194,000 km2) of the territory of the 84 developing
countries would be impacted by a 1-m rise. This would
increase to 1.2% in areas where the sea level rose 5 m.
Nearly 56 million people (approximately 1.28% of the
population) in these countries would be impacted under a
1-m rise scenario. This would increase to 89 million people
for 2 m and 245 million people (approximately 5.57%) for
a 5-m rise. The impact of sea level rise on gross domestic
product (GDP) is slightly greater than the impact on
population, because GDP per capita is generally above
average for coastal populations and cities. Wetlands would
experience significant impact even with a 1-m rise. Up to
7.3% of wetlands in the 84 countries would be impacted
* This manuscript solely reflects the personal views of the authors and does not necessarily represent the views, positions,
strategies, or opinions of the Turkish Armed Forces.
** Correspondence:
671
SİMAV et al. / Turkish J Earth Sci
by a 5-m sea level rise. However, these impacts are not
uniformly distributed across the regions and countries
of the developing world. Among the regions, East Asia
and the Middle East/North Africa exhibit the greatest
relative impacts. At the country level, the consequences of
the sea level rise are potentially catastrophic in Vietnam,
Egypt, and the Bahamas. For the land area, the Bahamas
is by far the most impacted country. Close to 12% of its
area would be affected by a 1-m rise. Around 10% of
Vietnam and Egypt’s populations, 10% of Vietnam’s GDP
and urban extent, 13% of Egypt’s agricultural extent, and
28% of Vietnam, Jamaica, and Belize’s wetlands would be
impacted by the permanent inundation due to a 1-m sea
level rise.
Surrounded by sea on 3 sides, Turkey could experience
appreciable coastal impacts from sea level rise. Although
coastal cities cover less than 5% of the country, at least 30
million people inhabit these places and the population
is still growing at a rapid rate (Karaca & Nicholls 2008).
Recent national and local scale investigations in Turkey
have shown that some coastal areas, particularly the low
lying deltaic plains, are highly vulnerable to the future
sea level rise (Demirkesen et al. 2008; Karaca & Nicholls
2008; Alpar 2009; Kuleli et al. 2009; Kuleli 2010). The
vulnerability of the Turkish coastal areas to permanent
inundation was quantified by Demirkesen et al. (2008)
based on the synthetic scenarios of constant sea level
changes and the digital elevation model acquired by
shuttle radar topography mission (SRTM). The analysis
revealed inundated coastal areas of 545 to 2125 km2 due
to a sea level rise of 1 to 3 m, respectively. Coastal plains
of the Seyhan and Ceyhan Rivers; Akyatan Lagoon; Göksü
Delta along the Mediterranean Sea; Güllük, Dalaman,
Didim, Selçuk, and Gediz Delta along the Aegean Sea;
Dalyan Lake along the Marmara Sea; and the Terkos Lake
and Kızılırmak Delta along the Black Sea were reported
as the coastal areas of high risk. An analogous study was
conducted by Karaca & Nicholls (2008). They defined
2 coastal risk zones according to their distance to the
shoreline and their elevation, in which a 1-m rise in sea
level would have important direct and indirect effects. The
results of this study show that more than 0.5 million people
would be affected at least indirectly by a 1-m sea level rise.
They established a crude estimate of potential adaptation
costs of US$20 billion to protect these people and capital
values. More detailed site specific studies of different
coastal regions of Turkey have been recommended using
more detailed data to further understand the climate
induced effects on the coastal environment.
In this paper, we focus on the vulnerability of the
Çukurova Delta, considered to be one of the most
susceptible areas in the county, under the projected
inundation by the end of the century. The specific objectives
672
of the current research are to determine areas at risk of
projected inundation in the Çukurova deltaic region and
to assess the impact of inundation from environmental,
social, and economic aspects. Different from the previous
studies, the projected inundation not only considers the
permanent component caused by sea level rise, but also
the temporary inundation due to extreme wave and
meteorological conditions. The projected inundation
level has been estimated from multimission satellite
altimetry observations using statistical methods rather
than adopting a deterministic rise scenario. The spread
of the flooding in the inundation mapping is constrained
by implementing a particular connectivity rule between
the cells of the elevation model instead of using a simple
bathtub or zero-side rule. A high resolution local elevation
model extracted from 1/25K topographic maps is used
rather than a global model for the better delineation of
the extent of the inundation. Up to date site specific vector
and thematic data are gathered for the assessment of the
potential impacts.
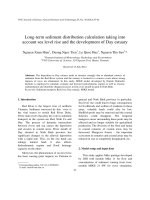
2. Description of the study area
Çukurova Delta is located on the easternmost part of the
Mediterranean Sea, between the metropolitan center of
Mersin and the Gulf of İskenderun in southern Turkey
(Figure 1). The delta is surrounded by the great Taurus
mountain range that stretches from west to northeast,
providing natural barriers to the cold airflow from
inner zones to the south. Typical Mediterranean climate
is dominant in the plain: mild and rainy winters, and
relatively hot and dry summers. It is almost the largest
and most fertile deltaic plain in the country, with more
than 20,000 km2 of catchment areas formed by the alluvial
deposits of the Seyhan and Ceyhan rivers. There are 4
lagoons in the region, 2 of which, Akyatan and Yumurtalık,
are designated as Wetlands of International Importance
by the Ramsar Convention. The delta is known for the
important biodiversity of flora and fauna, which lead to
the specially protected area status. A majority of the delta is
used for agricultural purposes: particularly cotton, citrus,
soy, peanuts, and corn harvest. A number of beaches serve
as the nesting places for endangered sea turtles. The area
also acts as stopover for the migrating birds voyaging
from Africa to Europe. There are 2 administrative districts
within the study area, Karataş and Yumurtalık, with
population densities of about 24–35 per km2 respectively,
according to the National Census of 2011. The region has a
long coastline (approximately 110 km) and it is mostly the
cottage tourism that serves the local and domestic residents
from the surrounding areas. The coastline from Mersin
to Karataş is mostly farmland. Karataş and Yumurtalık
coasts are home to cottages with a bird conservatory
residing between the 2 areas. The ports of Yumurtalık
SİMAV et al. / Turkish J Earth Sci
37°15'0"N
Seyhan Dam
37°0'0"N
NS
AI
T
N
OU
M
S
RU
U
TA
am
Tarsus
36°45'0"N
MERSİN
Tar
sus
Str
e
N
HA
Y
SE
Tu
zla
L
N
Elevation
High : 5159
36°30'0"N
Low : 0
34°45'0"E
ake
Ak
yat
an
R
VE
RI
La
ke
RIVER
LAKE
Ceyhan
R
VE
VV
I
VVV
V
R VV
VV
N VV
VVV
VVV
V
A
V
V
V
V
V
H
VV V EYV
V VV
VV V
V INV VV
V V
VV
CVVV
ADANA
A
V
T
V
VV
V
V
V
V
VUN
V
V
VV
V
V
V
V
V
V
V V
V
V
O
M V VV V V VV V
VE V
V VV
C
VV VV
V
V VV
V
LÜ
V
V
VVV
VÜVLV
V
VV
V
V
V
VVV
V VG V
V
V
VV
VV VV
V
V
V
V V
V
V
V VVVV
V
VV
V Yumurtalık
V
VV V
n
V
eru
V V
VV V VV Yumurtalık Lagoon skend lf
İ
Gu
VV VV
V
V
V
V
V
VV
Vake
V
Ağyatan L
Karataş
S E A
M E D I T E R R A N E A N
5.53511.070
22.140
33.210
44.280
SETTLEMENT
Meters
SEA
0
35°0'0"E
35°15'0"E
35°30'0"E
35°45'0"E
36°0'0"E
Figure 1. Study area (Çukurova deltaic region, Turkey).
and Ceyhan to the east are strategic locations for marine
transportation, since the major East–West (Kirkuk–
Yumurtalık) and North–South (Baku–Tbilisi–Ceyhan)
route of crude oil pipelines terminates at these ports. All
the physical, ecological, and socioeconomic properties of
the delta demonstrate the value and importance of this low
lying area. Thus, any rise in sea level will inevitably have
adverse effects on the ecosystem of the delta on various
levels.
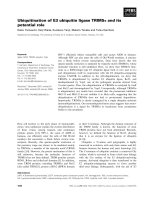
3. Methodology
Several methods have been implemented in order to
achieve the objectives of the research. The overall approach
followed in this study is outlined in Figure 2. It involves
the use of sea level and wave height data to estimate the
inundation level, a digital elevation model to generate
the coastal inundation map, satellite images to delineate
agricultural land use, and other site specific information
to superimpose on the inundation map in order to predict
and assess the potential impacts of projected inundation.
3.1. Inundation modeling
In this study, the risk zone definition of Hoozemans et al.
(1993) and Snoussi et al. (2008, 2009) has been adopted,
where the inundation level (InLev) is given by the sum
of mean high water (MHW), relative sea level rise (S),
extreme wave height (HTR), and sea level change due to the
barometric pressure (SP):
InLev=MHW+S+HTR+SP
(1)
Most of the quantities given in Eq. (1) have been
computed from multimission satellite altimetry data.
MHW is defined as the average of all the high water heights
above the mean sea surface observed during the altimetry
data period from 1992 to 2012. The highest sea level values
over each satellite repeat cycle and pass within the study
area are detected and averaged to estimate the MHW level
relative to mean sea surface as follows:
m
1 /
MHW = M
max (SLA sat
cycle, pass)
i=1
(2)
The current rate of sea level rise has been determined
using a model including bias, trend, and seasonal terms
that is given by:
SLA(t)=SLA(t0)+A1(t-t0)+A1cos(ω1t-φ1)+A2cos(ω2t-φ2)+ε(t)
(3)
673
SİMAV et al. / Turkish J Earth Sci
SLA & SWH
& MOG2D
Data
Topographic
Maps
(1:25K)
Inundation
Level
Estimation
DEM
Generation
Land
Use
Supervised Classification
& Filtering &
Accuracy Assessment
8-connected
Inundation
Model
Population
&
GDP
Landsat ETM+
Satellite Image
GIS Layers
(Transportation,
Forestry, etc.)
Inundation
Map
Agricultural
Map
Overlay
Inundation
Risk Map
Analysis
&
Results
Figure 2. A schematic representation of the methodology used.
where t is time, t0 is the origin of time or reference
epoch, SLA(t0) is the initial sea level anomaly at time
t=t0, a1 is a constant rate of sea level rise, and Ai, ωi,
φi are the amplitudes, angular frequencies, and phase
angles of the annual (i=1) and semiannual (i=2) sea level
signals, respectively. ε(t) is the error term. The unknown
parameters in Eq. (3) are derived by fitting the least squares
regression to the altimetric sea level time series. Assuming
there are no significant land movements (subsidence/
uplift) in the vicinity of the study, no acceleration in the
rate of sea level rise, and no interannual to decadal changes
in the seasonal parameters, we have projected the relative
sea level rise S by 2100 using the estimated parameters of
the above harmonic model.
The extreme significant wave heights with TR-year
return values have been predicted using Gumbel extreme
value distribution (Gumbel 1958; Kamphuis 2000; Suh
2007). According to this statistical distribution, the wave
height expected for a selected return period HR can be
estimated as follows:
674
HTR=α-βIn[In(1/P)]
(4)
where α and β represent the location and scale parameters,
respectively, and P is the probability of nonexceedance.
The model is fitted to the cumulative distribution function
(CDF) of the altimetric wave data, which have been
constructed using the following formula:
P = 1 - Nm
+1
(5)
where m is the rank based on descending order of
magnitude and N is the total number of passes or data
points within the study area. The extreme wave height
with a 100-year return period (H100) has been predicted
from the estimated parameters of the distribution model
and the nonexceedance probability given by the formula
below, where D is the decorrelation time scale in hours for
significant wave height (SWH) observations (3 h), and T100
is the number of hours in 100 years (877,777.78 h, which
includes leap years) (Suh 2007).
SİMAV et al. / Turkish J Earth Sci
P (H 1 H 100) = 1 - TD
100
(6)
Finally, the term SP in Eq. (1) is computed from the
MOG2D (2D Gravity Waves) model of Carrere & Lyard
(2003). The model is used in the satellite altimetry data
processing to account for the high frequency sea level
variations caused by pressure and wind forcing. We
consider the extreme meteorological contribution to sea
level. Therefore, the term SP is computed exactly in the
same way as is done for MHW, where the highest values
over each satellite repeat cycle and pass are averaged as
follows:
m
1 /
SP = m
max (MOG2D sat
cycle, pass)
i=1
(7)
The “eight-side rule” approach proposed by Poulter
& Halpin (2008) is used to simulate inundation in the
study area rather than the simple bathtub or “zero-side
rule”. In this approach, a grid cell of the digital elevation
model (DEM) is flooded only if its elevation is below the
inundation level and if it is connected to an adjacent grid
cell that is flooded or open water. Therefore, the surface
connectivity between a grid cell and its immediate 8
neighbors in the cardinal and diagonal direction is taken
into account. The rule can be expressed as follows:
Fx,y = *
E x,y # In Lev, 1
xC
E x,y 2 In Lev, 0
(8)
where F is binomial, either flooded (1) or not flooded
(0); E is the elevation at location x,y; InLev is the projected
inundation level; and C represents connectivity, either
connected (1) or not connected (0).
3.2. Coastal topography and land use
Inundation mapping and analysis of flooding impacts
require data on the land surface elevations, land use, and
cover. We have produced a high resolution DEM for the
study area from 1/25K topographic maps, instead of using
freely available SRTM data. A triangular irregular network
(TIN) has been constructed from the counter lines using
the ArcGIS 3D Analyst tool that supports the Delaunay
triangulation method. The generated TIN surface is then
converted to a raster grid with regular cell spacing of 5
m using natural neighbor interpolation that implements
an area based on a weighting scheme on the closest TIN
nodes found in all directions around each output cell
center (URL 1).
Agricultural land use within the study area is
delineated from the Landsat-7 ETM+ satellite imagery
acquired on 29 May 2006 (path/row-175/035) by means
of image classification on the ERDAS platform. The
satellite imagery, corrected and registered as GeoTIFF
with 30-m resolution, is obtained from the Global Land
Cover Facility website (URL 2). Supervised classification
has been performed employing maximum likelihood
classifier based on the training signatures established by
onscreen digitizing of the false color composite image. The
following 4 land use classes have been considered in image
classification: agricultural land, wetland, forest, and bare
ground. A fuzzy convolution filter with a window size of
7 × 7 is used to reduce the speckling of the classification
before producing the final output. Overall map accuracy
of 88.04% has been obtained based on 147 ground truth
data interpreted from high resolution orthophoto maps,
1/25K topographic maps, and field knowledge. Finally, the
classified image has been converted into vector format for
further analysis.
4. Analysis and results
4.1. Satellite altimetry data and inundation level
The mean high water level, the rate of the mean sea level
rise, and the extreme wave height with a return period
of 100 years have been computed based on the sea level
anomaly (SLA) and SWH data of Topex, Jason-1, Jason-2,
Envisat, and Cryosat-2 altimeter satellites. The standard
along-track altimetry data from the Radar Altimetry
Data System (RADS) is extracted for the study area using
version 3.1 of the default settings in the RADS database as
described by Scharroo (2011). SLA and SWH time series
cover Topex cycles 1 to 479 (September 1992 to September
2005), Jason-1 cycles 1 to 371 (January 2002 to February
2012), and Jason-2 cycles 0 to 133 (July 2008 to February
2012), each having average repeat cycles of 9.9 days. Envisat
data span the time period from July 2002 to February 2012
(cycles 7 to 111), with an average repeat cycle of 35 days.
We also use data delivered by satellite mission Cryosat-2
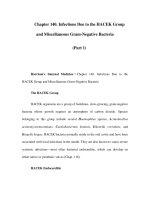
cycles 11 to 24 (February 2011 to January 2012). Figure 3
depicts the location of satellite ground tracks with different
spatial resolutions. Along-track distance between 1-Hz
measurements is about 7 km for most satellite missions, but
the spacing between parallel tracks of Topex, Jason-1, and
Jason-2 is about 300 km, and it is about 80 km for Envisat.
Standard geophysical and environmental corrections
including atmospheric, tidal, instrumental, and inverse
barometer corrections have been applied to SLA data.
Default data editing criteria (limits and flags) have been
accepted during the SLA and SWH data construction. The
sea level anomalies are given with respect to the DNSC08
global mean sea surface model derived from a combination
of 12 years of satellite altimetry from 8 different satellites
covering the period of 1993–2004 (Andersen & Knudsen
2009). During the inundation analysis, the mean surface is
defined as the zero inundation level.
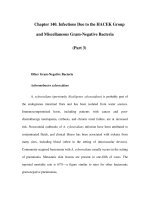
The 1-Hz SLA time series for an almost 20-year period
covered by the satellite data is shown in Figure 4a. For
the MHW level estimation, we first removed the tidal
correction applied to the SLA data, then detected the
675
SİMAV et al. / Turkish J Earth Sci
37°30'0"N
37°0'0"N
36°30'0"N
36°0'0"N
. ..
.
. .. .
. .. . . .
. .. . .
.
. . . . . ..
..
.
.
.
.
. .. . .
.. . . . . ............. . .
.
.
.
.
..... .
. .
.
.
. . .
.
.
.
. . . .
. . . . . . .
.. .
. . .......... .
. . .. .
.
.
.
.
.
.
.
.
.
. . .
..
. .
.
. .
......
.
. . . .
. . .
. . . .. . ...... . ........... ..
.
.
..
.
.
.
.
. .
.. . .
... . ....... . .
. . . . . .
.
.
.
.
.
.
.
.
.
.
.
.
.
......
.
.
.
.
.
.
. .
.
. ..
.
.
.
.
............ .
. .............. . ........ .. . . . . . .. . . . . . . . .
.............. . .. . . .
.
. . .
..
...... ........... .
.
.
.
.
.
.
.
JASON-2
.
.
.
.
.
.
.
.. ........... .
. ............. . .. . . .. . .
. .
. .
.......... . .
.. .
.
.
.
.
.
.
.
.
.
.
.
.
.
.
.
.
.
.
.
.
TOPEX
. . ............ . . .. . .................. . . . . . . ........ . . . ... .
. .. ..
......
. .....
.
. . . . . ..
. ..
. . . ..................... . . . ................... . . . . . ..... . ... . ....
JASON-1
. .
........... . . ...............
... . . ... . . . . . .
.
.
.
.
.
.
.
.
.
.
.
.
.
.
.
.
.
.
.
.
.
.
ENVISAT ..
.. . . . . ..... . .
.. . .
..................... . .............................
.
.
.
.
.
.
.
.
.
.
.
.
.
.
CRYOSAT-2 . .. . ..................... .................. ........... . .. .. . . . . . ...... .. . . . .. . ......... . . .
.
.
.
.. . ...
........... ....
.
34°30'0"E
35°0'0"E
35°30'0"E
Elevation
High : 5159
Low : 0 1:1,000,000
36°0'0"E
Figure 3. Topography of the study area in the landward side. Satellite altimetry data points (passes) in the seaward side (green:
Topex, black: Jason-1, magenta: Jason-2, red: Cryosat-2, blue: Envisat satellite missions).
40
(a)
20
0
SLA (cm)
–20
–40
20 (b) Rate: 3.4 ± 0.1 mm/year
10
0
–10
1992 1994 1996 1998 2000 2002 2004 2006 2008 2010 2012
Year
Figure 4. (a) 1-Hz multimission satellite altimetry sea level
anomalies relative to DNSC08 mean sea surface between
September 1992 and February 2012 (green: Topex, black: Jason-1,
magenta: Jason-2, red: Cryosat-2, blue: Envisat satellite missions).
(b) Smoothed mean sea level signal with a 60-day running filter
(black line) and the rate of sea level rise (red dashed line).
676
highest values for each satellite repeat cycle and pass [see
Eq. (2)]. After averaging these highest values, the height
of MHW is found 19.5 cm above the DNSC08 mean sea
surface.
The rate of sea level rise and seasonal variations are
estimated from the mean sea level signal shown in Figure
4b, constructed by smoothing the multimission SLA data
with a 60-day running mean filter (Cazenave et al. 2002;
Willis et al. 2008). Note that the tidal correction is applied
in this process. Table 1 shows the estimated parameters of
Eq. (3) and the projected sea level rise by the year 2100
relative to the DNSC08 mean sea surface. A mean sea level
rise of 3.4 ± 0.1 mm/year superimposed to the seasonal
variations is apparent in Figure 4b that is quite consistent
with the regional and global estimates (URL 3; Cazenave et
al. 2008). Projection suggests that the mean sea level rises
up to 35.8 ± 1.1 cm by the end of this century, which is
also consistent with global mean sea level rise scenarios of
IPCC AR4 (Solomon et al. 2007).
For the prediction of 100-year return wave height, we
use SWH data from multimission satellite altimetry shown
SİMAV et al. / Turkish J Earth Sci
Table 1. Estimated values and standard errors (one sigma) of the parameters in Eq. (3) and projected sea level rise by the year 2100.
SLA(t2000)
(cm)
α1
(mm/year)
A1
(cm)
φ1
(degrees)
A2
(cm)
φ2
(degrees)
SLA(t2100)
(cm)
1.7 ± 0.1
3.4 ± 0.1
6.2 ± 0.1
269.9 ± 0.7
0.4 ± 0.1
41.8 ± 10.0
35.8 ± 1.1
6 shows the corresponding MOG2D corrections applied
to 1-Hz SLA data in Figure 4a. The same methodology
used in the MHW estimation is applied to the mean total
inverse barometer signal. The highest values, depicted
in Figure 6 with blue dots, for each satellite repeat cycle
and pass are averaged [see Eq. (7)] to obtain the mean
maximum meteorological forcing acting on the sea level
(Figure 6, red line). Estimation of the mean sea level rises
up to 4.7 cm as a result of extreme barometric conditions.
Consequently, summing up the 4 contributors in Eq. (1),
we obtain an inundation level of 6.7 m for the study area
by the year 2100.
4.2. Inundation mapping and overlay analysis
The inundation model given in Eq. (8) has been evaluated
in the ERDAS Imagine Virtual GIS Module using the
projected inundation level of 6.7 m and the elevation
model. The results of coastal vulnerability of the Çukurova
Delta are summarized in Table 3, assuming no protection/
adaptation measures are taken. The inundation map
in Figure 5a. For each satellite pass, we first compute the
median of 1-Hz SWH data over each satellite repeat cycle.
In the second step, these data are arranged in descending
order and Eq. (5) is used to describe the empirical CDF, or
probability, of nonexceedance of wave height. The SWH
is then plotted against the reduced variate of Gumbel
distribution -In[In(1/P)] and a straight line is fitted to
obtain the parameters of the probability distribution
(Figures 5b and 5c). Using the nonexceedance probability
of H100 [see Eq. (6)] and substituting the estimated
parameters of probability distribution in Eq. (4), we have
predicted the extreme wave height for a return period of
100 years. Table 2 gives the location and scale parameters
of the Gumbel distribution, as well as the nonexceedance
probability and predicted value of H100.
In order to account for the mean meteorological
forcing on the sea level, we have also downloaded the
MOG2D total inverse barometer correction from the
RADS database together with SLA and SWH data. Figure
5
SWH (m)
4
(a)
3
2
1
0
1992
SWH (m)
4
1994
1996
1998
2000
2002
2004
Loc : 0.664 ± 0.03
Scale: 0.434 ± 0.02
(b)
2006
2008
2010
2012
1
(c)
0.8
P(Hs < h)
5
3
2
1
0
–2
0.6
0.4
0.2
0
2
4
–Ln[Ln(1/P)]
6
0
1
2
3
SWH (m)
4
0
5
Figure 5. (a) The 1-Hz multimission satellite altimetry significant wave height data
between September 1992 and February 2012 (green: Topex, black: Jason-1, magenta:
Jason-2, red: Cryosat-2, blue: Envisat satellite missions). (b) Gumbel distribution plot
(black line) and a straight line fit (red dashed line). (c) Cumulative distribution of the
observed wave heights (black line) with its corresponding fit (red dashed line).
677
SİMAV et al. / Turkish J Earth Sci
Table 2. Estimated values and standard errors (one sigma) of the parameters in Eq. (4), and nonexceedance probability and predicted
value of extreme wave height for a 100-year return period.
α
β
P(H < H100)
H100
(m)
0.664 ± 0.003
0.434 ± 0.002
0.9999966
6.1 ± 0.03
presented in Figure 7 indicates that with the projected
inundation of a given magnitude, about 69% of the
total area would be at risk of flooding. Overlaying the
inundated areas and land use map shows that about 68%
of the agricultural areas, 100% of the wetlands, 77% of
the settlement zones/beaches/bare lands, and 62% of
the forestry lands would be exposed to permanent plus
temporary inundation with the assumption that the land
use pattern would remain the same as the current situation.
The lagoons, nearshore settlements, and agricultural
areas are the most vulnerable zones. Assuming a mean
population density of 30 people per km2 within the region
and assuming zero-growth population in the future years,
more than 42,000 people would be suffering from the
inundation. The average GDP per capita is $2339 in the
city of Adana, Turkey, and therefore at least $98,000,000 of
the GDP would be affected. The extent of the inundation
also affects the transportation, where almost 33% of the
roadways would subject to flooding.
5. Conclusion and suggestions
Understanding the mechanisms of the sea level change and
its impacts on the coastal ecosystem has gained increasing
importance in the age of climate change. The projection
25
20
15
MOG2D (cm)
10
5
0
–5
–10
–15
–20
–25
1992 1994 1996 1998 2000 2002 2004 2006 2008 2010 2012
Year
Figure 6. MOG2D time series for the sea level anomaly data
in Figure 4a used to account for the high frequency sea level
variations caused by pressure and wind forcing. Blue dots
represent the highest values in each satellite repeat cycle and
pass. Horizontal red line represents the mean of highest values.
678
of future sea level rise and resulting coastal inundation
is a crucial task in order to raise the awareness of people,
to set up efficient coastal management programs, and to
mitigate probable hazard risks. This study focuses on the
projected inundation of the Çukurova Delta, one of the
most productive, but at the same time most susceptible
to sea level rise, areas in Turkey. Multimission satellite
altimeter data suggest that the inundation level within
the region reaches up to 6.7 m by the year 2100. However,
one should bear in mind that this magnitude comprises
both the permanent and temporary components of the
inundation, which approximately corresponds to the
maximum level of flooding and does not reflect the
duration of the inundation. With the projected inundation
of this magnitude, about 69% of the area would be at risk
of flooding, where the nearshore settlements, lagoons, and
agricultural lands seem to be the most severely impacted
areas.
This analysis is important to emphasize to what extent
coastal protection and accommodation strategies might
be necessary when considering sea level rise and storm
flood scenarios. Even more detailed information is needed
to precisely determine the full range of risks, and some
further studies should be conducted to investigate the
other physical impacts of sea level rise such as erosion
and saltwater intrusion. Many national and international
programs and projects have been initiated during the last
few years, including the “Climate Change Adaptation
in the Seyhan River Basin Grants Programme” (URL 4)
and “Strong Civil Society Sustainable Çukurova River
Basin Project” (URL 5), for the investigation of the
vulnerability of the region and mitigation of the negative
impacts of climate change. Even if the output of this
study gives a preliminary estimation of the areas at risk,
it may contribute to enhancing wetland conservation and
management in the delta.
Despite some novelties brought by the use of satellite
altimetry products in inundation level estimation of the
study region for the first time, this study contains some
limitations. Altimetric measurements are contaminated
potentially by the signals from land and islands within
their footprints. The tides are much more complex near
the shores than in the open ocean and require a precise
knowledge of the coastal geography of the study area. The
wet tropospheric corrections computed from radiometer
SİMAV et al. / Turkish J Earth Sci
Table 3. Results of the vulnerability assessment.
Indicator
Areas/length/unit
Affected part
Rate
1397 km2
952 km2
68%
Wetland
41 km
41 km
100%
Forestry land
66 km2
41 km2
62%
Settlement, beach, bare land
399 km
Total land
2035 km2
Transportation (roads)
12,481 km
Agricultural land
Population
2
2
2
30 people/km
GDP
309 km
77%
1412 km2
69%
4163 km
33%
2
42,360 people
2
$2339/capita
measurements are also less precise or not present at all
near the coasts. Using postprocessed coastal altimetry
products or terrestrial data (e.g., tide gauge, wave buoy)
may improve the estimations.
Satellite altimetry measures the absolute sea level
variations, but we must be concerned about the relative sea
level, or the observed change in water level relative to the
level of the nearby land, when we deal with the inundation
analysis. Any subsidence in the vicinity of the shoreline
$98,656,440
may raise the relative sea level or vice versa. In this study,
we assume that there is no significant land movement
(subsidence/uplift) in the vicinity of the study region,
and thus absolute sea level from satellite altimetry is
equivalent to relative sea level. We suggest that the vertical
land movements should be monitored by independent
techniques, such as Global Positioning System (GPS) or
Interferometric Synthetic Aperture Radar (InSAR), and be
taken into account in the estimation of inundation level.
37°15'0"N
Seyhan Dam
AN
YH
E
C
37°0'0"N
ADANA
Tarsus
Tar
sus
Str
e
am
N
HA
Y
SE
MERSİN
36°45'0"N
N
Tu
zla
L
R
VE
RI
Yumurtalık
ake
Ak
yat
an
La
Ağyatan Lake
ke
LAKE
Karataş
SETTLEMENT
INUNDATION
AGRICULTURE
34°45'0"E
run
de
en lf
k
s
İ
Gu
Yumurtalık Lagoon
RIVER
ROAD
SEA
36°30'0"N
Ceyhan
R
VE
RI
M
0
E
5500 11,000
35°0'0"E
D
I
22,000
T
E
R
33,000
35°15'0"E
R
A
N
E
A
N
S
E
A
44,000
meters
35°30'0"E
35°45'0"E
36°0'0"E
Figure 7. Projected inundation map of Çukurova Delta with a maximum inundation level of 6.7 m by the year 2100.
679
SİMAV et al. / Turkish J Earth Sci
The digital elevation model is the primary dataset in
inundation mapping. Using a high resolution and more
accurate model will necessarily improve the results. In
our study, we used a local elevation model extracted from
topographic maps rather than a global model for the better
delineation of the extent of the inundation. Terrestrial
measurements by GPS or electronic tachometers, or
by light detection and ranging (LiDAR) systems, will
contribute to refining the model.
Acknowledgments
The authors wish to thank the following institutions
that provided data: 1/25K topographic maps, elevation,
transportation, forestry, and settlement GIS layers in
vector formats were provided by the General Command
of Mapping (Turkey); population and GDP data were from
the Turkish Statistical Institute; Landsat-7 ETM+ satellite
imagery was obtained from the Global Land Cover
Facility website at www.glcf.umiacs.umd.edu; and satellite
altimetry sea level anomaly, significant wave height, and
MOG2D data were from the Radar Altimeter Database
System at />
References
Alpar, B. 2009. Vulnerability of Turkish coasts to accelerated sea-level
rise. Geomorphology 107, 58–63.
Andersen, O.B. & Knudsen, P. 2009. DNSC08 mean sea surface and
mean dynamic topography models. Journal of Geophysical
Research 114, C11001.
Carrere, L. & Lyard, F. 2003. Modeling the barotropic response of
the global ocean to atmospheric wind and pressure forcing comparisons with observations. Geophysical Research Letters
30(6), 1275.
Cazenave, A., Bonnefond, P., Mercier, F., Dominh, K. & Toumazou,
V. 2002. Sea level variations in the Mediterranean Sea and
Black Sea from satellite altimetry and tide gauges. Global and
Planetary Change 34, 59–86.
Cazenave, A., Dominh, K., Guinehut, S., Berthier, E., Llovel,
W., Ramillien, G., Ablain, M. & Larnicol, G. 2008. Sea level
budget over 2003–2008: A reevaluation from GRACE space
gravimetry, satellite altimetry and Argo. Global and Planetary
Change 65, 83–88.
Dasgupta, S., Laplante, B., Meisner, C., Wheeler, D. & Yan, J. 2007. The
impact of sea level rise on developing countries: A comparative
analysis. World Bank Policy Research Working Paper, 4136.
Available at .
Demirkesen, A.C., Evrendilek, F. & Berberoğlu, S. 2008. Quantifying
coastal inundation vulnerability of Turkey to sea-level rise.
Environmental Monitoring and Assessment 138(1–3), 101–106.
Gumbel, E.J. 1958. Statistics of Extremes. Columbia University Press,
New York.
Hoozemans, F.M.J., Marchand, M. & Pennekamp, H.A. 1993. Sea
Level Rise: A Global Vulnerability Assessment-Vulnerability
Assessments for Population, Coastal Wetlands and Rice
Production on a Global Scale. 2nd ed. Delft Hydraulics, Delft,
the Netherlands.
Kamphuis, J.W. 2000. Introduction to Coastal Engineering and
Management. World Scientific, Singapore.
Karaca, M. & Nicholls, R.J. 2008. Potential implications of accelerated
sea-level rise for Turkey. Journal of Coastal Research 24(2),
288–298.
Kuleli, T. 2010. City-based risk assessment of sea level rise using
topographic and census data for the Turkish coastal zone.
Estuaries and Coasts 33, 640–651.
Kuleli, T., Şenkal, O. & Erdem, M. 2009. National assessment of sea
level rise using topographic and census data for Turkish coastal
zone. Environmental Monitoring and Assessment 156, 425–434.
680
Nicholls, R.J., Leatherman, S.P., Dennis, K.C. & Volonte, C.R.
1995. Impacts and responses to sea-level rise: qualitative and
quantitative assessments. Journal of Coastal Research 14, 26–43.
Poulter, B. & Halpin, P.N. 2008. Raster modelling of coastal flooding
from sea-level rise. International Journal of Geographical
Information Science 22(2), 167–182.
Scharroo, R. 2011. RADS User Manual and Format Specification
(Version 3.1). Available at />radsmanual.pdf.
Snoussi, M., Ouchani, T., Khouakhi, A. & Niang-Diop, I. 2009.
Impacts of sea-level rise on the Moroccan coastal zone:
quantifying coastal erosion and flooding in the Tangier Bay.
Geomorphology 107, 32–40.
Snoussi, M., Ouchani, T. & Niazi, S. 2008. Vulnerability assessment
of the impact of sea-level rise and flooding on the Moroccan
coast: the case of the Mediterranean eastern zone. Estuarine
Coastal and Shelf Science 77, 206–213.
Solomon, S., Qin, D., Manning, M., Chen, Z., Marquis, M., Averyt,
K.B., Tignor, M. & Miller, H.L. 2007. Climate Change 2007: The
Physical Science Basis. Contribution of Working Group I to the
Fourth Assessment Report of the Intergovernmental Panel on
Climate Change. Cambridge University Press, Cambridge, UK.
Suh, I.H. 2007. Statistics of Amplitude and Fluid Velocity of Large
and Rare Waves in the Ocean. MSc Thesis, Department
of Mechanical Engineering, Massachusetts Institute of
Technology, USA.
Willis, J.K., Chambers, D.P. & Nerem, R.S. 2008. Assessing the
globally averaged sea level budget on seasonal to interannual
timescales. Journal of Geophysical Research 113, C06015.
URL 1: />cfm?TopicName, 07.11.2012. Welcome to ArcGIS Desktop
Help 9.3, including 9.3.1.
URL 2: www.glcf.umiacs.umd.edu, 07.11.2012. Global Land
Cover Facility.
URL 3: />mean-sea-level-greenhouse-effect/regional-trends/index.html,
07.11.2012. AVISO.
URL 4: 07.11.2012. Kuş
Araştırmaları Derneği Seyhan İklim Değişikliği Uyum Projesi.
URL 6: 07.11.2012.
Çukurova Deltası.