Study on correlation between population of viruliferous whitefly and the percent intensity of cotton leaf curl disease in cotton
Bạn đang xem bản rút gọn của tài liệu. Xem và tải ngay bản đầy đủ của tài liệu tại đây (231.78 KB, 16 trang )
Int.J.Curr.Microbiol.App.Sci (2019) 8(1): 922-937
International Journal of Current Microbiology and Applied Sciences
ISSN: 2319-7706 Volume 8 Number 01 (2019)
Journal homepage:
Original Research Article
/>
Study on Correlation between Population of Viruliferous Whitefly and the
Percent Intensity of Cotton Leaf Curl Disease in Cotton
A. Kumar, S.K. Sain* and D. Monga
ICAR-Central Institute for Cotton Research, Regional Station, Sirsa 125055, Haryana, India
*Corresponding author
ABSTRACT
Keywords
Cotton leaf curl
disease, Correlation,
Field study,
Viruliferous
whitefly, Percent
disease index
Article Info
Accepted:
07 December 2018
Available Online:
10 January 2019
Cotton Leaf Curl Disease (CLCuD) is a devastating disease in cotton and cause seed
cotton yield loss upto 80% in Northern India. Transmission of CLCuD by Bemisia tabaci,
the role of alternative weed hosts, infested cotton plants is well understood. However, the
relationship of viruliferous whitefly population and CLCuD incidence is still not clear. We
aimed to pursue a detailed study on the effect of general whitefly population and
viruliferous whitefly population on CLCuD percent disease index (PDI) and their
correlation. Three years study showed a decreasing trend in general whitefly population
and increasing trend in viruliferous whitefly population in correspondence with the
increase in CLCuD intensity from August to October. A highly significant and positive
correlation between viruliferous whitefly population on cotton plant and percent diseases
index of CLCuD (r2 = 0.945) was observed both at on-station and on-farm multilocation
trials. A non-significant positive correlation between whitefly population and CLCuD PDI
(r2 = 0.796) and between whitefly population and viruliferous whitefly population (r 2 =
0.633) was recorded at on-station trials. Thus, it‟s one of its first kinds of research study
which shows a positive correlation between viruliferous whitefly population and the level
of CLCuD intensity in cotton field for the first time. These results advance our
understanding on timely detection of viruliferous whitefly level in the cotton field during
the off-season as well as during the crop season. This would help in managing the
transmission of CLCuV through the judicious and timely application of management
strategies for viruliferous whitefly.
Introduction
Cotton (Gossypium spp.) known as “White
Gold” is worlds‟ one of the most important
commercial and natural textile fibre crops and
a significant contributor of oilseeds. India is a
leading producer of cotton in the world and is
the only country in the world to cultivate all
four cultivable Gossypium species i.e.,
Gossypium arboreum and G. herbaceum, G.
barbadense and G. hirsutum besides hybrid
cottons. Cotton is cultivated in three distinct
agro-ecological regions (north, central and
south) of the country. Cotton Leaf Curl
Disease (CLCuD) is caused by Cotton leaf
curl virus (CLCuV) which belongs to
begomovirus group, family Geminivirideae
and has emerged as a serious threat to cotton
922
Int.J.Curr.Microbiol.App.Sci (2019) 8(1): 922-937
cultivation in North India and Pakistan
(Mansoor et al., 2003; Sattar et al., 2013;
Varma and Malathi, 2003). In India, CLCuD
is presently restricted to 1.2 - 2.0 million ha in
northern cotton growing states i.e. Haryana,
Punjab and Rajasthan (Varma and Malathi,
2003) and is reported to cause potential yield
losses from 25.2 - 81.4% (Monga et al., 2013;
Monga, 2014; Narula et al., 1999). A number
of geminiviruses have been reported to infect
cotton in the Indian subcontinent, including
Cotton leaf curl Multan virus – Rajasthan
(CLCuMuV-Ra), Cotton leaf curl Kokhran
virus - Burewala (CLCuKoV-Bu), Papayaleaf
curl virus (PaLCuV), Okra enation leaf curl
virus (OEnLCV), Tomato leaf curl Bangalore
virus (ToLCuBaV), Tomato leaf curl New
Delhi
virus
(ToLCNDV).
However,
CLCuMuV and CLCuKoV or their strains
such as with CLCuMuV-Ra, CLCuKoV-Bu
are predominantly associated with CLCuD
epidemics in the Indian subcontinent (Brown
et al., 2017; Sattar et al., 2017). During 20042005, CLCuMuV-Ra was the major in
northwestern India, but in 2009-10, resistant
breaking CLCuKoV-Bu caused a severe
outbreak of CLCuD in Punjab and Rajasthan
states of India (Rajagopalan et al., 2012).
However, during 2015-16, replacement of the
„virulent resistance breaking‟ CLCuKoV-Bu
by the re-emerging CLCuMuV recombinants
were recorded to cause an epidemic in North
India (Datta et al., 2017).
Bemisia tabaci (Gennadius) (Hemiptera:
Aleyrodidae) assumed major importance on
cotton in India after severe outbreaks during
1984 - 85 and 1985 - 86 seasons in Andhra
Pradesh, Karnataka and Tamil Nadu and later
as a vector in transmission of CLCuD in
Rajasthan, Haryana and Punjab during 1990s
onward. Thus, the whitefly itself as well as a
vector of CLCuD is assuming serious pest
status of almost all cotton varieties. It was
observed that the percent disease incidence
(PDI) increased slowly during the month of
June and reached up to 80% during July and
August in Sudan (Idris, 1990). Similarly, the
CLCuV incidence increased rapidly from 4.3
to12.3% during the end of July and first week
of August in Pakistan (Ali et al., 1995).
However, the progress of the disease was
reported to be maximum during the month of
August as compared to July and September in
Northern India (Monga et al., 1998). In a
recent study three B. tabaci biotypes were
recorded from India include Asia-II-7 in Pusa
-Delhi, Asia-I in south and central India and
Asia-II-1 in north India (Naveen et al., 2017).
An effective management of this important
disease and its vector is possible by the
development of resistant varieties and
suppression of whitefly along with the
eradication of weed hosts carrying this
disease. At present there is no source of
absolute resistance against CLCuV in G
hirsutum cotton varieties and there is no
chemical control for the CLCuD except the
management of its vector whitefly.
Earlier studies conducted on correlation of
whitefly, weather factors and CLCuD, reveal
that the percent CLCuD incidence and
whitefly population shows a negative
correlation with maximum and minimum
temperature and rainfall while positive
correlation with morning and evening relative
humidity and sunshine hours (Maharshi et al.,
2017). Non-significant correlation between
CLCuD intensity and whitefly population
were reported on different cotton varieties
(Varma and Malathi, 2003). The real positive
correlation of whitefly populations vis-à-vis
CLCuD development and its severity has not
been established (Akhtar et al., 2004).
However, disease severity of rice stripe virus
(RSV) transmitted by small brown
planthopper in paddy was reported to have a
positive correlation with viruliferous rate of
the vector but not with the population density
of the insect. This suggests that the proportion
923
Int.J.Curr.Microbiol.App.Sci (2019) 8(1): 922-937
of vectors infected by the virus rather than the
total number of vectors plays an important
role in RSV epidemics and could be used for
disease forecasting (He et al., 2016). The
literature available indicates that there is no
such study available which could establish the
correlation of the proportion of nonviruliferous and viruliferous whiteflies with
CLCuD incidence and its percent severity or
PDI in cotton. Hence, we intended to study the
effect of general whitefly population and
viruliferous whitefly population on CLCuD
percent disease index (PDI) as well as to study
their correlation. It was also felt that
understanding the inoculum source becomes
an important step in epidemiological studies,
disease development and decision making for
management of CLCuD transmission vector.
The present studies were planned with a view
to elucidate and understand the correlation of
levels of viruliferous whiteflies population out
of the existing whitefly populations in cotton
leaf curl disease intensity.
Materials and Methods
Selection of cotton fields for whitefly and
CLCuD data recording
The two types of field experiments, one at onstation and another at the hot spot locations
were decided for conducting the study to
understand the relationship between total
whitefly population - viruliferous whitefly
population and CLCuD PDI. These
experiments were conducted twice during
2010 and 2011 at on-station and during 2011
and 2012 at hot spot locations. On-station trial
was conducted at ICAR Central Institute for
Cotton Research- Regional Station (ICARCICR-RS),
Sirsa
experimental
farm
(29°32'39.5"N 75°02'24.6"E). CLCuD and
whitefly susceptible variety HS 6 was sown
with row to row and plant to plant spacing of
67.5 x 30 cm in an area of 393 m2 with 1940
plants (twenty rows of 97 plants each).
Standard package and practices were followed
to raise the crop. Another, on-farm hot spot
location trial was conducted during 2011 and
2012 at three fixed locations situated in
whitefly and CLCuD hot spot areas in
Haryana, Rajasthan and Punjab. In Haryana,
three locations, i.e. Umedpura, Jagmalwali
and Fatehpuria were selected as hot spots
based on previous research experience
(Monga
personal
communication).
In
Rajasthan, three locations, namely Kaluwali,
Sadhuwali and Agriculture Research StationSriganganagar and in Punjab- five locations,
i.e. Mansa, Bathinda, Fazilka, Wander Jatna
and Nihalkhera locations were selected for
recording of whitefly population and CLCuD
per cent disease index (PDI).
Recording of whitefly population and
progress in PDI of CLCuD at ICAR-CICRRS, Sirsa
Observations on total whitefly populationviruliferous whitefly population and CLCuD
PDI were recorded at weekly interval during
2010 from the 25th Standard Meteorological
Week (SMW) to 41st SMW and during 2011
from 25th SMW to 44th SMW (June to
October). Data on whitefly population were
taken on 50 randomly selected tagged cotton
plants of HS-6 variety in five plots by
selecting 10 plants in each. For determination
of PDI of CLCuD, a total of 100 cotton plants
were selected randomly in five plots of one
acre field. 20 cotton plants were selected in
each plot for the observation of CLCuD PDI.
Observation of CLCuD on cotton plants from
each point were recorded by observing
CLCuD symptoms using 0-6 scale (Monga,
2014). The observations were taken at 0-6
disease rating scale where 0 = complete
absence of symptoms; 1 = symptoms of vein
thickening (VT) on few upper leaves; 2 =
symptoms of VT, cupping and curling on few
upper leaves; 3 = one fourth of a plant affected
with VT, cupping and curling, leafy enations;
924
Int.J.Curr.Microbiol.App.Sci (2019) 8(1): 922-937
4 = half plant of a plant affected with VT,
cupping and curling, leaf enations; 5 = three
fourth of a plant affected with VT, cupping
and curling, leafy enation; and 6 = Plants
stunted severely and complete plant affected
with VT, cupping and curling and leafy
enation. The average grade was calculated by
using the formula: Average disease rating
grade = (Sum of all disease rating grades/
Total number of plants), and percent disease
index (PDI) was calculated for each entry/plot
by using the following formula: PDI=
[Average disease rating grade /Maximum
disease rating grade] x 100
Recording
of
whitefly
population,
viruliferous whitefly population and
progress in PDI of CLCuD at different
farmer field locations
This study was undertaken to observe the
relationship between disease progress and
presence of the percent viruliferous population
of whitefly at different locations and at
different time intervals. Observations on
whitefly population, viruliferous whitefly and
CLCuD progress were recorded only from one
cotton field from each location (hot spots)
during 2011 and 2012. Three observations on
whitefly population per three leaves (top,
middle and bottom strata) on tagged plants
were taken during the months of July, August
and October in 2011 and 2012. Data were
recorded from 40 randomly selected plants at
each location of one acre by selecting 10
plants from four points in each field. CLCuD
disease incidence and severity was recorded
from the same plants using 0-6 scale (Monga,
2014). The PDI was calculated using the
formula mentioned under section 2.2.
Detection of viruliferous whitefly
Detection of viruliferous whitefly population
from the total whitefly population collected
from infected plants was achieved by PCR
technique using CLCuV specific coat protein
(CP) primer pair CP -F and CP –R and the
relationship between viruliferous whiteflies
and CLCuD PDI was worked out. To
determine percent viruliferous population of
whitefly the DNA was isolated from collected
whitefly samples. Fifty whitefly samples were
collected from each site at the time of each
observation from where the whitefly
population and CLCuD PDI recording was
done. For DNA isolation, a single whitefly
was crushed in 25 µl extraction buffer [50 mM
Tris-Cl (pH 8.4) -1 ml, 50mM KCl -1 ml,
0.45% Tween-20 -1 ml, 0.45% NP-40 1-ml,
Proteinase K (10 mg/ml) -30 µl and 970 µl
distilled water] in 1.5 ml eppendorf tube by
the help of micro pestle (Tarsons). 25 µl of
extraction buffer was added to wash micro
pestle and incubated at 65oC and 95oC for 45
min and 10 min, respectively. After incubation
the crude extracts were centrifuged at 12,300
rpm for 3 min. DNA isolated from single
whiteflies was stored at -20 oC. The purified
DNA isolated from single whitefly was
subjected to PCR to detect the presence of
CLCuV using CLCuV specific coat protein
(CP) primer pair CP - F and CP – R. The
nucleotide sequence of these primers are:
primer F- 5‟-CGG GAT CCA TGT CGA
AGC GAG CTG CC - 3‟and primer -R- 5‟CCG GAA TTC ATA TCA ATT CGT TAC
AGA GTC A -3‟ (Imperial Life Sciences).
PCR amplification was achieved using the 50
µl reaction mixture using: Genomic DNA
(50ng) - 2 µl; CP primer (Forward) CP-F and
CP primer (Reverse) CP-R 1.5 µl each, PCR
master mix (1 X) - 45 µl. PCR amplification
was performed in a thermocycler (model PTC100, M. J. Research Inc., USA) under the
following parameters: one cycle for initial
denaturation at 95 0C for 4 min., 29 cycles of
denaturation at 940C for 30 sec., annealing at
550C for 30 sec, and extension at 720C for 45
sec. An additional cycle at 72 ºC for 10 min.
was run at the end of these cycles
(Chakrabarty et al., 2005). After PCR, the
925
Int.J.Curr.Microbiol.App.Sci (2019) 8(1): 922-937
PCR products (10 µl) were resolved by
submerged horizontal electrophoresis (Tarsons
India Ltd) in 1% (w/v) Agarose gel
(containing ethidium bromide) in TrisAcetate-EDTA buffer (pH 8.0) and
electrophoresis was carried out at constant
voltage of 80 Volt for 1h. The gel was
visualized in ultraviolet light (260 nm) and
photography was done by using gel
documentation system. The 1000 bp DNA
ladder was used to determine the size of the
CLCuV DNA bands. Out of the total whitefly
samples collected from each location at every
observation, positive and negative samples
were used for calculation of percent
viruliferous whitefly population at each
location and analysis of correlation. Along
with viruliferous whitefly the CLCuD
infection of cotton was also confirmed for
CLCuV detection from each location.
Statistical analyses
Simple T test was applied to determine the
statistical significance of differences among
the mean data of each experiment. Similarly,
the correlation among whitefly population on
cotton plants, CLCuD PDI and among
whitefly population, percent viruliferous
whitefly population and CLCuD PDI was
determined using Pearson Spearman Rank and
Kendall's Tau with the help of computer
program OP Stats (Sheoran et al., 1998).
Results and Discussion
Percent viruliferous whitefly population
and CLCuD PDI on cotton variety HS-6
during 2010 and 2011 at ICAR-CICR Sirsa
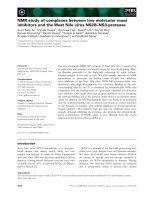
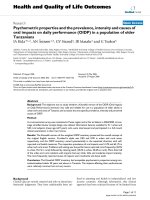
The presence of 771 bp DNA band of CLCuV
was recorded in 1% (w/v) agarose gel in
viruliferous positive whitefly samples as well
as cotton plant showing CLCuD infection. The
data on percent viruliferous whitefly were
calculated based on presence and absence of
CLCuV in each of the collected whitefly
samples out of the total whiteflies samples and
was used for analysis of correlation (Fig. 1).
When the percentage of viruliferous whiteflies
was compared during 2010 and 2011, the
population was more during 2010 than 2011.
In June 2010, among the total whitefly
population at ICAR-CICR Sirsa, the
viruliferous whiteflies population was 7.14%,
while in 2011, they were 4.14 % and the
corresponding CLCuD PDI was 0.17 and
0.08%, respectively. In July, percent
viruliferous whiteflies were 17.64% and
14.13% and the corresponding CLCuD PDI
was 7.86 and 4.98 during 2010 and 2011,
respectively. In August, viruliferous whiteflies
were 26.5% and 18.06 % and CLCuD PDI
were 59.32 % and 27.41%, recorded during
2010 and 2011, respectively. In September
2010, viruliferous whitefly was observed to be
33.53%, while in 2011 viruliferous whitefly
was 22.22%. The CLCuD PDI was 79.24 %
and 42.64% during September 2010 and 2011,
respectively. During October 2010, 34.48%
viruliferous whiteflies were detected; while in
2011 at this time 27.72% viruliferous whitefly
were detected. CLCuD PDI was 86.10% and
50.47% during October 2010 and 2011,
respectively (Table 1).
The whitefly population during 2010 and 2011
from May to October varied from 0.0 to 4.33
and 0.41 to 5.14, respectively, without
showing any particular trend in increase or
decrease in population. However, the percent
viruliferous whiteflies and CLCuD PDI
showed an increasing trend from May to
October. The pooled mean of two year data of
whitefly population per three leaves per cotton
plant and PDI of CLCuD had a positive
correlation among each other. There was a
significant positive correlation at p=0.01
among viruliferous whitefly population and
PDI CLCuD (r2 = 0.945). However, non
significant positive correlation was recorded
among whitefly population per three leaves
926
Int.J.Curr.Microbiol.App.Sci (2019) 8(1): 922-937
per cotton plant and PDI of CLCuD (r2 =
0.633) and among whitefly population per
three leaves per cotton plant and viruliferous
whitefly population (r2 = 0.796) (Table 2).
Whitefly population, percent viruliferous
whiteflies and CLCuD PDI in Punjab,
Haryana and Rajasthan during 2011 and
2012
Among the three hot spot areas, comparatively
the whitefly population was maximum in
Rajasthan and minimum in Punjab during
2011, while it was maximum in Punjab and
minimum in Haryana during 2012. Whitefly
population was observed to be in increasing
trend from July to August, and then it
decreased in October at all locations
considered for the study and during both the
year.
During 2011 in the month of July and August
viruliferous whiteflies were recorded, but
there was no CLCuD PDI among all the
locations except in Punjab in August. During
July 2011, maximum percent viruliferous
population was recorded from Rajasthan
(4.0%), followed by Punjab (3.2%) and
Haryana (2.0%). In August the population of
viruliferous whitefly increased to the tune of
6.7%, 4.8%, 3.3 % in Rajasthan, Punjab and
Haryana, respectively. The viruliferous
whitefly population was further reached to
10.7% and 6.4% in Rajasthan and Punjab,
respectively, in the month of October, while in
Haryana percent viruliferous population
remained 3.3% only. During July 2012 higher
viruliferous whitefly population in Punjab
(16.0%) and Rajasthan (18.7%) and which
was further increased in the month of August
to the tune of 28.7% and 27.0% in Rajasthan
and Punjab, respectively. During October,
percent viruliferous increased upto 35.3% in
Rajasthan and 15.3% in Haryana. PDI of
CLCuD was recorded to be slightly higher in
Rajasthan in comparison to Haryana and
Punjab during 2011 while the PDI of CLCuD
was much higher in Rajasthan followed by
Punjab during 2012. During 2011 in the month
of July and August, CLCuD was not observed
in Haryana and Rajasthan, but in Punjab PDI
of CLCuD was only 0.6% in August. During
October 2011, PDI of CLCuD was also
observed in Rajasthan (4.0%), Punjab (2.2%)
and Haryana (1.7%). During 2012 in the
month of July, maximum PDI of CLCuD was
recorded in Rajasthan (24.3%), followed by
Punjab (18.5%) and Haryana (3.3%). During
August 2012, the PDI was increased upto
42.3% in Rajasthan, 33.0% in Punjab and
10.7% in Haryana. Which was further
increased in the month of October upto 55.7%
in Rajasthan and 17.7% in Haryana (Table 3).
Pooled mean of two year data indicates that
overall viruliferous whitefly population and
PDI of CLCuD were recorded to be higher in
Rajasthan and Punjab compared to Haryana.
Similarly, an increasing trend of per cent
viruliferous population and PDI of CLCuD
was observed from July to October, during
both the years. Percent viruliferous whitefly
per three leaves per cotton plant and PDI of
CLCuD showed a significant positive
correlation (p=0.05) among each other.
However, highly significant correlation
(p=0.01) was recorded in between CLCuD
PDI (%) and percent viruliferous whiteflies
(r2=0.995) (Table 4).
Results of two years data collected during
2010 and 2011 showed an increasing trend in
whitefly population from the month of May to
September and later decreased in on-station
experiments carried out at ICAR-CICR, Sirsa
while increasing trend in viruliferous whitefly
population as well as CLCuD PDI from May
to October was recorded. By observing the
two years data, it is clear that during 2010,
CLCuD PDI was high in comparison to 2011.
Disease progression and viruliferous whitefly
population were higher in 2010 from June to
927
Int.J.Curr.Microbiol.App.Sci (2019) 8(1): 922-937
October compared to 2011 at ICAR-CICR.
The CLCuD PDI increased with the increase
in viruliferous whitefly population. The total
whitefly population in general does not
correlate with PDI of disease, whereas it is the
viruliferous nature of the whitefly which is
important and has correlation for CLCuD PDI.
Earlier studies have also reported that single
B. tabaci is able to transmit the leaf curl virus
agent (Sharma and Rishi, 2003), but greater
transmission efficiency is observed when a
higher number B. tabaci (more than 10
whiteflies per plant) is present (Cauquil and
Follin, 2003). The general whitefly population
during 2010 was peaked in July however,
during 2011 it peaked only in September. The
reasons behind this are higher relative
humidity (>82%), minimum temperature (~25
o
C), rainfall (3-10 mm) and sunshine hours
(Table 5). In the current study, whitefly
population showed significant negative
correlation with maximum temperature,
significant positive correlation with relative
humidity (morning and evening) and sunshine,
while non-significant negative correlation was
observed with minimum temperature and
positive non-significant correlation with
rainfall. Similarly, the PDI of CLCuD showed
significant negative correlation with maximum
and minimum temperature, significant positive
correlation with relative humidity in the
morning and sunshine, while non-significant
positive-non-significant
correlation
with
evening temperature, evening relative
humidity, rainfall and whitefly population
(Table 6). Janu and Dhiya (2017) have
reported whitefly population in cotton to be
significantly and positively correlated with the
minimum temperature, morning and evening
relative humidity while, significantly and
negatively
correlated
with
maximum
temperature. This study also indirectly
confirms that the more whiteflies probably
will have more viruliferous ones, thereby
leading to more transmission (Singh et al.,
1994; Mann and Singh, 2004). However, at
on-station trial in May 2011, 2.78%
viruliferous whiteflies were recorded but
CLCuD PDI was negligible. During the
beginning correlation observed between
percent viruliferous whitefly and PDI at one
moment could not necessarily explain what is
happening in field at the same moment.
However, this indicates that there may be
delay between inoculation of the virus through
whitefly and symptoms appearance, and the
CLCuD PDI values depend on this delay.
Moreover, the CLCuD symptoms appear only
on young leaves one month after inoculation
which results in very low PDI (Khan and
Ahmad 2005). Subsequently, two months after
inoculation of the virus the CLCuD PDI will
increase. The pooled data of the two years
study at on-station trial suggest that increase
in viruliferous whitefly population increases
CLCuD PDI in subsequent time i.e. about 3-4
week time later which might be due to
incubation period required for symptom
appearance. Previous serial transmission
studies showed that B. tabaci adults could
retain the virus for 9 d to entire life span.
However, the serially transferred viruliferous
whiteflies were not consistent in transmitting
the virus in new plants i.e., the whiteflies
transmitted the virus to new plants on day 1, 2,
5 or 8, but not transmitted on day 3, 4, 6 or 7
(Mann and Singh 2004). The exact reasons
why all whiteflies in a population do not
become viruliferous are not understood. All
these studies indicate the various factors
influencing cotton leaf curl virus disease
incidence and its intensity. Percent
viruliferous whiteflies population correlation
with PDI of CLCuD in our studies shows a
new and very important observation which can
help us in prediction of disease and its
management more accurately. The virus
transmission is also shown to be a direct
fraction of the number of viruliferous
whiteflies per plant in several virus
transmission studies including CLCuV. It has
been demonstrated that when single whitefly
928
Int.J.Curr.Microbiol.App.Sci (2019) 8(1): 922-937
per plant was allowed an acquisition access
period of 24 h., 20% of the experimental
whiteflies acquired the virus to induce CLCuV
symptoms on healthy cotton plants. The
percentage of transmission increased to 80, 87,
85, 90 and 88 when the number of whiteflies
was increased to 5, 10, 15, 20 and 25 per
plant, respectively (Singh et al., 1994; Mann
and Singh, 2004). In addition to host
suitability and plant age, CLCuV acquisition
is influenced by the severity of disease
symptoms or the virus titer present in plants.
B. tabaci acquired CLCuV more efficiently
from heavily diseased plants than from less
severely infected plants (Singh et al., 2000;
Singh et al., 2001). Disease severity of the rice
strip virus (RSV) was reported to be positively
correlated with viruliferous rate of the vector
but not with the population density of the
insect, suggesting that the percentage of
vectors infected by the virus rather than the
total number of vectors play an important role
in RSV epidemics and could be used for
disease forecasting (He et al., 2016). The
epidemic and outbreak of rice stripe disease
are closely related to the occurrence of
viruliferous
small
brown
planthopper
populations- Laodelphax striatellus Falle´n
(Hibino 1996). These findings support the
current study where we have also found that
more the viruliferous whitefly population and
severe is the CLCuD PDI at later crop stage.
A significant positive correlation (P=0.01)
among pooled mean of two years data on
viruliferous whitefly population and PDI
CLCuD (r2 = 0.945) was recorded. Non
significant positive correlation among whitefly
population per three leaves per cotton plant
and PDI of CLCuD (r2 = 0.633) and among
whitefly population per three leaves per cotton
plant and viruliferous whitefly population (r2 =
0.796), indicates that the increase in whitefly
population also has positive relationship with
viruliferous whiteflies as well as with PDI.
However, these correlations were not
significant. A non-significant correlation
between CLCuD intensity and whitefly
population on different varieties studied were
also reported by Varma and Malathi (2003)
however, Aktar et al., (2004) have not been
able to eastablish a significant positive
correlation of whitefly populations vis-à-vis
disease development and its severity. Many
other researchers also found non-significant
relationship of whitefly population with
disease incidence (Briddon and Markham
1994; Hameed et al., 1994; Iqbal, 2003).
Some workers have found non-significant
correlation of weekly maximum air
temperature (0C), % relative humidity (5
p.m.), wind velocity, rainfall, sunshine and
whitefly
population
on
thirteen
mutant/varieties and negative significant
correlation between minimum air temperature
and wind velocity (8 a.m.) for CLCuV disease
development (Khan and Khan, 2000).
Maharshi et al., (2017) have reported that
percent CLCuD incidence and whitefly
population have a significant negative
correlation with temperature maximum and
minimum, while positively correlated with
relative humidity morning and evening.
Monga et al., (2010) have not observed any
correlation
between
general
whitefly
population and CLCuD incidence from 1999
to 2009, however, they observed that
minimum temperature and sunshine hours
have significant negative correlation whereas
morning/evening relative humidity and rainfall
have positive correlations with incidence and
progress of CLCuD and developed regression
equation which could be helpful in
understanding factors affecting disease
development and its prediction. The present
study, we found a non-significant though
positive
correlation
among
whitefly
population and CLCuD PDI, however, a
significant positive correlation between
population level of viruliferous whitefly and
CLCuD. Hence, the results clearly indicate the
role of the level of viruliferous whitefly and
929
Int.J.Curr.Microbiol.App.Sci (2019) 8(1): 922-937
CLCuD PDI. The findings of the current study
will support in CLCuD management and to
minimize the cotton crop loss due to CLCuD
and suggests the monitoring and estimation of
viruliferous whitefly are essential rather than
non-viruliferous whitefly.
To further to confirm the correlation between
the whitefly population, viruliferous whitefly
population and CLCuD PDI the study was
conducted in farmer fields in Punjab (five
location), Rajasthan (three location) and
Haryana (three locations) during 2011 and
2012.
The study indicated that whitefly population
was maximum in Rajasthan and minimum in
Punjab during 2011 while it was maximum in
Punjab and minimum in Haryana during 2012.
A similar trend was observed in term of
whitefly population increase from July to
August, and then decrease in October at all
locations and in both the year.
Table.1 Effect of percent viruliferous population on PDI of CLCuD during 2010 and 2011 at
ICAR-CICR Sirsa
Observation Whiteflya
Months
2010
2011
0.00
0.41
May
1.84
0.54
June
4.33
1.86
July
3.42
3.68
August
2.40
5.14
September
2.08
2.58
October
2.35
2.37
Mean
3.80
3.09
T value=
0.05
Probability 0.0126 0.0271
a
Pooled
mean
Pooled
mean
0.21
1.19
3.10
3.55
3.77
2.33
2.36
4.01
Viruliferous
whiteflies (%)
2010
2011
0.00
2.78
7.14
4.14
17.64
14.13
26.5
18.06
33.53
22.22
34.48
27.72
19.88
14.84
3.42
3.66
1.39
5.64
15.89
22.28
27.88
31.1
17.36
3.54
CLCuD PDI
(%)
2010
2011
0.00
0.00
0.17
0.08
7.86
4.98
59.32
27.41
79.24
42.64
86.1
50.47
38.78
20.93
2.34
2.28
0.0102
0.0187
0.0166
0.0667
0.0147
Pooled
mean
0.00
0.13
6.42
43.37
60.94
68.29
29.86
2.32
0.0714 0.068
average of whitefly population recorded from 3 leaves (upper, middle and lower strata) per plant
Table.2 Correlation of whitefly population, percent viruliferous population on PDI of CLCuD
during 2010 and 2011 at ICAR-CICR Sirsa
Observations
Whiteflya
Whiteflya
Viruliferous whiteflies (%)
CLCuD PDI (%)
1.000
0.796NS
0.633NS
a
Viruliferous
whiteflies (%)
1.000
0.945**
CLCuD PDI
(%)
1.000
average of whitefly population recorded from 3 leaves (upper middle and lower) per plant
Statistically significant at p=0.01
**
930
S. Error
0.576
4.893
12.846
Int.J.Curr.Microbiol.App.Sci (2019) 8(1): 922-937
Table.3 Whitefly population, per cent viruliferous whiteflies and PDI of CLCuD in cotton fields
in Punjab, Haryana and Rajasthan during 2011 and 2012
Observations Observation
Months
CLCuD
PDI (%)
Haryana**
Rajasthan**
2011
2012a
Pooled 2011 2012 Pooled 2011 2012
mean
mean
Pooled
mean
T
values
= 0.05
Probab
ility
3.2
5.2
4.2
4.4
4.3
4.35
5.9
5.1
5.5
16.98
0.0000
4.3
6.4
5.35
5.3
5.8
5.55
6.7
5.7
6.2
23.93
0.0000
October
4.0
-
2
4.7
4.9
4.8
6.1
5.5
5.8
6.28
0.0002
July
3.2
16
9.6
2.0
4.0
3.0
4.0
18.7
11.35
3.83
0.005
August
4.8
27
15.9
3.3
10
6.65
6.7
28.7
17.7
4.22
0.0029
October
6.4
-
3.2
3.3
15.3
9.3
10.7
35.3
23
3.14
0.0137
July
0.0
18.5
9.25
0.0
3.3
1.65
0.0
24.3
12.15
2.54
0.0345
August
0.6
33
16.8
0.0
10.7
5.35
0.0
42.3
21.15
2.82
0.0226
October
2.2
-
1.1
1.7
17.7
9.7
4.0
55.7
29.85
2.18
0.0613
Whitefly/3 July
leaves/plant August
Viruliferous
whiteflies
(%)
Punjab*
*Mean of five locations
** Mean of three locations
a
During the October 2012 the data could not be recorded in Punjab.
Table.4 Correlation matrices among whitefly/3 leaves/plant, percent viruliferous whiteflies and
CLCuD PDI (%) in cotton fields in Punjab, Haryana and Rajasthan during 2011 and 2012
Observations
Whiteflya
Whiteflya
1.000
Viruliferous
whiteflies (%)
CLCuD PDI
(%)
Std.
Error
0.571
*
Viruliferous whiteflies (%)
0.698
1.000
CLCuD PDI (%)
0.689*
0.995**
a
2.020
1.000
average of whitefly population recorded from 3 leaves (upper middle and lower) per plant
Statistically significant at p=0.005
**
Statistically significant at p=0.01
*
931
2.729
Int.J.Curr.Microbiol.App.Sci (2019) 8(1): 922-937
Table.5 Whitefly population and disease progress in relation to weather factors at CICR Sirsa
during 2010 and 2011
2010
CLCuD
Incidence
%
WF/3
leaves
Max.
Temp
.
Min.
Temp
.
Morning
RH
Evening
RH
Rainfall
Sunshine
hours
June
0.2
1.8
40.0
26.5
56.0
29.0
0.0
2.2
July
3.3
4.3
36.3
27.3
81.3
52.8
10.1
3.7
Aug
48.2
3.4
34.1
27.1
89.0
65.5
17.3
3.8
September
77.5
2.4
33.8
25.4
87.0
59.0
7.6
6.4
October
86.1
2.1
34.5
22.9
83.0
39.0
0.0
5.4
Months
2011
June
0.1
0.5
38.7
28.0
73.5
49.0
0.0
0.8
July
2.5
1.8
37.2
28.1
75.0
50.8
0.0
3.9
Aug
22.9
3.7
33.9
26.4
87.1
70.3
7.2
5.2
September
40.7
5.1
33.1
25.2
87.1
63.6
3.7
3.8
October
48.8
2.6
34.1
21.1
75.6
40.5
0.0
8.8
Table.6 Correlation between different weather parameters with whitefly population build up and
disease incidence (pooled over 2010 and 2011)
Weather
parameters
Correlation coefficient
Whitefly
PDI (%)
Std Error
-0.717*
-0.808*
0.214
-0.751*
1.526
Temperature
Maximum
Minimum
-0.044
NS
Relative humidity
Morning
0.574*
0.530*
1.237
Evening
0.683*
0.281 NS
2.310
Rainfall
0.189 NS
0.086 NS
2.162
Sunshine
0.484*
0.498*
3.214
NS
1.237
Whitefly
-
0.481
932
Int.J.Curr.Microbiol.App.Sci (2019) 8(1): 922-937
Fig.1 PCR amplification of CLCuV-DNA (771bp) in whitefly collected from cotton field at
ICAR-CICR Regional Station during 2010-2011 by PCR (Lane M-100 bp molecular weight
marker, Lane C- positive check, Lane 1-36 whitefly DNA)
20 June 2010 (lane 14& 18
Check)
23 July 2010 (lane 19 & 36
Check)
31 July 2010 (lane 19 &
36Check)
5 August 2010 (lane 13 & 25
Check)
20 August 2010 (lane 19 & 38
Check)
6 September 2010 (lane 19 &
31 Check)
16 September 2010 (lane 19 &
38 Check)
10 October 2010/10
23 May 2011 (lane c-check)
06 June 2011(lane c-check)
19 June 2011(lane c-check)
05 July 2011(lane c-check)
19 July 2011 (lane c-check)
04 August 2011(lane c-check)
19 August 2011(lane c-check)
02 September 2011(lane ccheck)
19 October 2011 (lane c-check)
04 October
check)
19 October 2011 (lane ccheck)
2011(lane
c-
933
Int.J.Curr.Microbiol.App.Sci (2019) 8(1): 922-937
Pooled mean of two year data indicates that
the overall viruliferous whitefly population
and PDI of CLCuD were recorded to be
higher in Rajasthan and Punjab compared to
Haryana. Similarly, an increasing trend of per
cent viruliferous population and PDI of
CLCuD was observed from July to October,
during both the years. Similarly, to the present
study, the CLCuV incidence is reported to
increase from 4.3 to 12.3% during the end of
July and first week of August in Pakistan (Ali
et al., 1995).
it can be concluded that percent viruliferous
whiteflies increases continuously from June to
early October and decreases at the end of
October. Corresponding to the percent
viruliferous whiteflies population, the CLCuD
PDI also increases in the same manner and
becomes constant at the end of October.
The current study conducted both at onstation and hot spot areas of three different
agroclimatic conditions, strengthen our
understanding about the epidemiology of
CLCuV for improved forecasting to manage
the disease monitoring and detection of
viruliferous whiteflies rather than total
whitefly population. CLCuD PDI primarily
depends on the presence of viruliferous
whiteflies in the environment. Additionally,
the study holds the importance in controlling
the transmission of CLCuV through timely
detection of viruliferous whitefly level in the
field during the off-season as well as during
the crop season from cotton and other
alternate plant-hosts. Thus, timely detection
of viruliferous whitefly level can serve as a
useful tool which will help in timely
application of the appropriate management
strategies for management of viruliferous
whitefly and ultimately reducing CLCuD
PDI.
While, the progress of the disease was
reported to be maximum during the month of
August as compared to July and September in
Northern India (Monga et al., 1998). As, in
the present study, a less number of
viruliferous whitefly (<7%) with negligible
amount of PDI were recorded during July and
August 2011 in all the three locations (Table
3). Moreover, in the on-station trail at ICARSirsa, the presence of viruliferous whitefly
was detected during the month of May 2011,
however, the CLCuD symptoms were
recorded during June. The absence of PDI
during the corresponding months in the hot
spot area may also be due to the lower
whitefly population as well as delay between
inoculation of the virus and the expression of
the symptom level. These results are similar
to the on-station trial and also previous
transmission studies which showed that
CLCuV could be acquired by whitefly within
4 h, transmit the virus within 1 hr of feeding
and symptoms are recorded after 4 weeks
(Khan and Ahmad, 2005). In this study
conducted at multi-location trials, highly
significant correlation (p=0.1) was recorded
in between PDI of CLCuD PDI (%) and
percent viruliferous whiteflies (r2=0.995).
Moreover, a significant positive correlation
(p=0.5) was found among whitefly population
per three leaves per plant, percent viruliferous
whitefly per three leaves per cotton plant and
PDI of CLCuD. However, from the this study
Conflict of interest
This is to submit that that the work described
in the paper has not been published before;
that it is not under consideration for
publication anywhere else; that its publication
has been approved by all co-authors, as well
as by the responsible authorities – tacitly or
explicitly – at the institute where the work has
been carried out. The publisher will not be
held legally responsible should there be any
claims for compensation. All authors are
wishing to include figures, tables, or text
passages that have not been published
elsewhere.
934
Int.J.Curr.Microbiol.App.Sci (2019) 8(1): 922-937
disease in subsaharan Africa and the
rest of the world. Coton et fibres
Tropicals
38,
93-317
DOI:
/>tract/19846751050
Chakrabarty, P.K., Sable, S., Monga, D. and
Mayee, C. D. (2005) Polymerase chain
reactionbased
detection
of
Xanthomonas
axonopodis
pv
malvacearum and cotton leaf curl virus,
Indian Journal of Agricultural Sciences
75, 524-27.
Datta,
S., Budhauliya,
R., Das,
B., Gopalakrishnan,
R., Sharma,
S., Chatterjee, S., Vanlalhmuaka, Raju,
P.S., and Veer, V. (2017) Rebound of
Cotton leaf curl Multan virus and its
exclusive detection in cotton leaf curl
disease outbreak, Punjab (India) (2015)
Scientific Reports 7(1),17361. doi:
10.1038/s41598-017-17680-9.
Hameed, S., Khalid, S., Haq, E. and Hashmi,
A.A. (1994). Cotton leaf curl disease in
Pakistan caused by a whitefly
transmitted geminivirus, Pl Dis 78, 529
DOI:
/>ntdisease/backissues/ Documents/ 1994
Abstracts/PD_78_0529H.htm.
He, D.C., Zhan, J., Cheng, Z.B. and Xie, L.H.
(2016) Viruliferous rate of small brown
plant hopper is a good indicator of rice
stripe disease epidemics, Scientific
Reports
6,
21376.
/>Hibino, H. (1996). Biology and epidemiology
of rice viruses, Annual Review of
Phytopathology 34, 249–274.
Idris, A.M. (1990). Cotton leaf curl virus
disease in the Sudan. Mededelingen
Landbouwwetenschapper
Rijksuniversiteit Gent 55:263-267 DOI:
/>Iqbal, M. (1993). Detection, transmission and
control of cotton leaf curl virus. M.Sc
Key Message
This is one of its first kinds of research study
which shows a positive correlation between
viruliferous whitefly population and the level
of CLCuD intensity in cotton field for the first
time. The field and lab studies advances our
understanding in making the decision for
management of viruliferous whitefly and
ultimately reducing CLCuD PDI. Regular
monitoring and timely detection of
viruliferous whitefly level in fields can serve
as a useful tool for reducing transmission of
CLCuD.
References
Akhtar, K.P., Hussain, M., Khan, A.I., Haq,
M.A. and Iqbal, M.M. (2004) Influence
of plant age, whitefly population and
cultivar resistance on infection of cotton
plants by cotton leaf curl virus
(CLCuV) in Pakistan, Field Crops
Research 86, 5-21.
Ali, M., Ahmed, Z., Tanveer, M. and
Mahmood, T. (1995) Cotton leaf curl
virus in the Punjab. Current Situation
and review of work. Central Cotton
Research Institute/Ministry of Food and
Agric, Livestock. Govt. Pakistan/Asian
Development Bank, 35-36 pp.
Briddon, R.W. and Markham, P.G. (1994)
Universal primers for dicot-infecting
geminiviruses, Molicular Biotechnology
1, 202-205.
Brown,
J.K., Ur-Rehman,
M.Z., Avelar,
S., Chingandu, N., Hameed, U, Haider,
S. and Ilyas M (2017) Molecular
diagnostic
development
for
begomovirus-betasatellite
complexes
undergoing diversification: A case
study,
Virus.
Res.
/>4.014.
Cauquil, J. and Follin, J.C. (1983) Presumed
virus and mycoplasm-like organism
935
Int.J.Curr.Microbiol.App.Sci (2019) 8(1): 922-937
Thesis, Deptt Agri Ent Univ Agric.,
Faisalabad, p. 55.
Janu, A and Dahiya, K.K. (2017) Influence of
weather parameters on population of
whitefly, Bemisia tabaci in American
cotton (Gossypium hirsutum), Journal
of Entomology and Zoology Studies
5(4), 649-654.
Khan, M.A. and Khan, H.A. (2000). Cotton
leaf curl virus disease severity in
relation to environmental conditions.
Pakistan
Journal
of
Biological
Sciences,
3,
1688-1690
DOI:
/>pjbs/2000/1688-1690.pdf
Khan, J.A. and Ahmad, J. (2005). Diagnosis,
monitoring
and
transmission
characteristics of cotton leaf curl virus,
Current Science 88(11), 1803-1809.
Maharshi, A., Yadav, N.K., Swami, P., Singh,
P. and Singh, J. (2017). Progression of
cotton leaf curl disease and its vector
whitefly under weather influences,
International Journal of Current
Microbiology and Applied Sciences
6(5), 2663-2670.
Mann, R.S. and Singh, L, (2004), Studies on
the interaction of cotton leaf curl virus
(CLCuV) with its vector B. tabaci
(Genn.), Journal of Cotton Research
and Development 18, 95-98
Monga, D. (2014). Cotton Leaf Curl Virus
diseases. Central Institute for Cotton
Research, Regional Station, Sirsa 125055, India.
Monga, D., Chakrabarty, P.K. and Kranthi,
K.R. (2011a) Cotton leaf Curl Disease
in India-recent status and management
strategies. Presented in 5th meeting of
Asian
Cotton
Research
and
Development Network Held in Lahore
in Feb 23-25.
Monga, D., Manocha, V., Kumhar, K.C. Soni,
R. and Singh, N.P. (2011b) Occurrence
and prediction of cotton leaf curl virus
disease in northern zone, Journal of
Cotton Research and Development
25(2), 273-277
Monga, D., Raj, S. and Varma, S.K. (1998)
Preliminary investigations on reaction
of cotton germplasm to leaf curl and
losses caused by the disease. National
Symposium on “Present Scenario in
diseases of Oilseeds and Pulses” held at
Aurangabad from February 17-19.
Monga, D., Shree Lakshmi, B. and Prakash,
A.H. (2013) Crop losses due to
important cotton diseases. Central
Institute for Cotton Research, Regional
Station, Sirsa -125055, India.
Narula, A.M., Monga, D., Chauhan, M.S. and
Raj, S. (1999) Cotton leaf curl virus
disease in India-The Challenge ahead,
Journal of Cotton Research and
Development 13, 129-138.
Naveen, N.C., Chaubey, R., Kumar, D.,
Rebijith,
K.B.,
Rajagopal,
R.,
Subrahmanyam, B. and Subramanian, S.
(2017). Insecticide resistance status in
the whitefly, Bemisia tabaci genetic
groups Asia-I, Asia-II-1 and Asia-II-7
on the Indian subcontinent, Scientific
Reports
7,
40634.
/>Rajagopalan,
P.A., Naik,
A., Katturi,
P., Kurulekar, M., Kankanallu, R.S.
and Anandalakshmi,
R.
(2012)
Dominance
of
resistance-breaking
cotton leaf curl Burewala virus
(CLCuBuV) in northwestern India,
Archives of Virology 157, 855–868.
Sattar, M.N., Kvarnheden, A., Saeed, M. and
Briddon, R.W. (2013) Cotton leaf curl
disease–an emerging threat to cotton
production worldwide, Journal of
General Virology 94, 695-710.
Sattar, M.N., Iqbal, Z., Tahir, M.N. and Ullah,
S. (2017) The Prediction of a New
CLCuD Epidemic in the Old World,
Frontiers
in
Microbiology
8,
631, />00631.
936
Int.J.Curr.Microbiol.App.Sci (2019) 8(1): 922-937
Sharma, P. and Rishi, N. (2003) Host range
and vector relationships of cotton leaf
curl virus from northern India, Indian
Phytopathology 56, 496-499
Sheoran, O.P., Tonk, D.S., Kaushik, L.S.,
Hasija, R.C. and Pannu, R.S. (1998)
Statistical Software Package for
Agricultural Research Workers. In:
Hooda DS, Hasija RC (eds.), Recent
Advances in information theory,
Statistics and Computer Applications.
Department of Mathematics Statistics,
CCS HAU, Hisar, India, 139-143 pp.
Singh, D., Singh, R. and Garg, H.R. (2000)
Screening of Cotton (Gossypium
hirsutum
L.)
Germplasm
Lines/Cultivars against Cotton Leaf
Curl Virus (CLCuV), Journal of Cotton
Research and Development 14,123-125.
Singh, D., Singh, R., Garg, H.R. and Gill, J.S.
(2001) Incidence of cotton leaf curl
virus (CLCuV) and bacterial blight on
upland cotton in the Punjab, Journal of
Cotton Research and Development 15,
99-101.
Singh, J., Sohi, A.S., Mann, H.S. and Kapur,
S.P. (1994) Studies on whitefly Bemisia
tabaci (Genn.) transmitted cotton leaf
curl virus disease in Punjab, Journal of
Insect Science 7, 194-198.
Singh, M. (2000). Studies on the leaf curl
disease of cotton caused by cotton leaf
curl virus (CLCuV) in Punjab.
Dissertation,
Punjab
agricultural
University, Ludhiana.
Varma, A. and Malathi, V.G. (2003)
Emerging geminivirus problems: a
serious threat to crop production,
Annals of Applied Biology 142, 145–
164.
How to cite this article:
Kumar, A., S.K. Sain and Monga, D. 2019. Study on Correlation between Population of
Viruliferous Whitefly and the Percent Intensity of Cotton Leaf Curl Disease in Cotton.
Int.J.Curr.Microbiol.App.Sci. 8(01): 922-937. doi: />
937