Kinetics studies of uranium sorption by powdered corn cob in batch and fixed bed system
Bạn đang xem bản rút gọn của tài liệu. Xem và tải ngay bản đầy đủ của tài liệu tại đây (1.46 MB, 9 trang )
Journal of Advanced Research (2016) 7, 79–87
Cairo University
Journal of Advanced Research
ORIGINAL ARTICLE
Kinetics studies of uranium sorption by powdered
corn cob in batch and fixed bed system
Mohamed A. Mahmoud
a
b
a,b,*
Nuclear Material Authority, Kattamiya Road, Maddi, P.O. Box 530, Cairo, Egypt
Chemical Engineering Department, Jazan University, Saudi Arabia
A R T I C L E
I N F O
Article history:
Received 13 November 2014
Received in revised form 24 January
2015
Accepted 18 February 2015
Available online 26 February 2015
Keywords:
Uranium
Corn cob
Adsorption: kinetics
Fixed bed
A B S T R A C T
Sorption of uranium (VI) from aqueous solution onto powdered corn cob has been carried out
using batch and fixed-bed technique. The experimental results in batch technique were fitted
well with pseudo second-order kinetics model. In the fixed bed technique, Thomas and
Bohart–Adams models were evaluated by linear regression analysis for U(VI) uptake in different flow rates, bed heights and initial concentrations. The column experimental data were fitted
well with Thomas mode (r2 = 0.999), but the Bohart–Adams model (r2 = 0.911), predicted
poor performance of fixed-bed column.
ª 2015 Production and hosting by Elsevier B.V. on behalf of Cairo University.
Introduction
The growth of technology in nuclear industries has led to the
emergence of many of environmental pollution problems, it
is so important to develop number of methods for removing
hazardous elements from industrial liquid wastes. Uranium is
the important element in nuclear applications. Nuclear power
is derived from uranium, which has no significant commercial
use other than as a fuel for electricity generation. For this
* Tel.: +966 564442596.
E-mail address:
Peer review under responsibility of Cairo University.
Production and hosting by Elsevier
reason, the recovery, concentration and purification of uranium are of great importance. Because of the expected shortage of uranium in near future, researches are to be directed
to the recovery of uranium from nonconventional resources
such as sea water, industrial waste waters, mine waste water,
and other waste sources in relation to the pollution of the natural environment [1,2]. The most commonly used methods for
the removal of heavy metals from wastewater are chemical
precipitation; membrane processes, ion exchange, solvent
extraction, photocatalysis and adsorption [3]. Adsorption
process has long been used in the removal of heavy metals
and other hazardous materials such as, color, odor and
organic pollution.
Although activated carbon is widely applied for pollutant
removal, natural materials which are relatively cheaper and
eco-friendly have also been successfully employed as adsorbents for heavy metal removal from aqueous solutions and
/>2090-1232 ª 2015 Production and hosting by Elsevier B.V. on behalf of Cairo University.
80
M.A. Mahmoud
Nomenclature
Ce
C0
Ct
F
k1
k2
KTh
KAB
M
N0
Q
equilibrium concentration (mg/L)
influent (initial) concentration (mg/L)
effluent concentration (mg/L)
linear flow rate (L/min)
pseudo first-order adsorption rate constant
(L/min)
pseudo second-order adsorption rate constant
(g/mg min)
Thomas rate constant (L minÀ1 mgÀ1)
Adam–Bohart constant (L mgÀ1 minÀ1)
mass of adsorbent (g)
saturation concentration (mg/L)
flow rate (mL/min)
wastewaters due to their availability, low-cost, unique chemical composition and renewability. The reduced running cost
has been the focal point for research on application of natural
materials. Cost is a very important factor when considering
material for use as adsorbents. The recent attention in this field
is evident in the number of research currently being done on
the use of low cost agricultural wastes for metal removal from
aqueous solution. Among the numerous adsorbents, Agriculture material is one of the most widely used and economic
adsorbent in the adsorption process such as coir pith [4],
orange peels [5], palm-shell [6], rice straw [7], cellulose beads
[8] sunflower [9], has been investigated. The objective of this
study was to investigate the adsorption potential of uranium
(VI) onto powdered Corn cob (PCC) in batch and fixed-bed
technique. In batch process kinetics of uranium removal onto
PCC at different parameters (temperature, pH, initial concentration, and adsorbent dose) are investigated. The performance
of fixed-bed column was evaluated by Thomas and Bohart–
Adams models at different flow rates, bed heights and initial
concentrations.
Material and methods
Preparation of adsorbent material
Corn cob is an agricultural by-product generated in Middle
East. Corn cobs were washed with distilled water several
times to remove dirt and particulate materials. The washed
Corn cobs were dried at 80 °C. The dried corncobs were
ground and sieved to obtain powdered Corn cob (PCC),
of a particle size 300–425 lm and stored in dissector for
further use.
Preparation of uranium stock solution
All chemicals and reagents used in this work were analytical
grade. Stock solution of uranium (VI) was prepared by dissolving appropriate amounts of UO2(NO3)2Æ6H2O, Aldrich, USA,
in distilled water. For experiments the required concentration
was prepared by dilution. The concentrations of U(VI) in solution were determined spectrophotometrically employing
Shimadzu UV–VIS-1601 spectrophotometer using arsenazo
(III) as complexing reagent [10].
q
qe
qt
r2
t
s
V
x
Z
adsorption capacity (mg of U(VI)/g adsorbent)
adsorption capacity at equilibrium, (mg of U(VI)/
g adsorbent)
adsorption capacity at time t (mg of U(VI)/
g adsorbent)
correlation coefficient
time (min)
the time required for 50% adsorbate breakthrough
(min)
volume of the solution (l)
mass of adsorbent in the column (g)
bed depth of column (cm)
Sorption experiments in batch technique
Batch experiments were first carried out to determine the
potential of PCC to adsorb U(VI)) from aqueous solution
and to investigate the optimum parameters of adsorption
(adsorbent dose, contact time, pH, temperature, and initial
concentration). 50 mL of different concentrations (25–
100 mg/L) of U(VI) solutions with a range of pH values from
3 to 10 was transferred in a conical flask with 0.3 g of PCC.
The solution was agitated at 200 rpm in a thermostatic shaker
water bath for different time (10–180 min) at different temperature (303, 313, 323 and 333 K). The samples were withdrawn and centrifuged at 5000 rpm for 5 min and the
supernatant solutions were analyzed. The pH of the solutions
was adjusted with 0.1 M Na2CO3 or 0.1 N HCl.
Sorption capacity and removal efficiency
Sorption capacity (q) of U(VI) was defined as:
q ¼ ðC0 À Ce ÞV=M
ð1Þ
In addition, the removal efficiency (Re) is calculated according to the following equation:
Re ð%Þ ¼ ½ðC0 À Ce Þ=C0  100
ð2Þ
Sorption kinetics in batch technique
Kinetics of sorption of U(VI) onto PCC was analyzed using
two kinetic models (pseudo first-order and pseudo secondorder models). The comparing between data of experiments
and models was analyzed by the correlation coefficients (r2).
Pseudo-first-order model
Lagergren’s equation of pseudo first-order model describes the
sorption capacity of solids in solid–liquid systems [11,12]. It is
supposed that one adsorbate is adsorbed onto one sorption site
on adsorbent surface.
The linear form of pseudo first order model was given by
equation:
logðqe À qt Þ ¼ log qe À
k1
t
2:303
ð3Þ
Kinetics studies of uranium sorption by powdered corn cob
Values of k1 and qe were calculated from the slope and
intercept values of the straight line of plotting log (qe À qt) versus t, respectively.
Pseudo-second-order model
The pseudo second-order model has been applied for the
analysis of kinetics of chemisorption from liquid solutions.
The linear form of pseudo-second order model [13,14], given
by the equation:
t
1
1
¼
þ t
qt k2 q2e qe
ð4Þ
The plot of t/qt versus t should give a straight line and the
K2 and qe were calculated from the values of intercept and
slope, respectively.
Sorption experiments in fixed-bed technique
81
Ln½ðC0 =Ct Þ À 1 ¼ ½ðKTh qe x=QÞ À KT hC0 t
ð5Þ
The parameters of Thomas model (kTh and qe) can be
determined from a plot of Ln [(C0/Ct) À 1]against time (t) at
a given flow rate.
Bohart–Adams model
Bohart–Adams model is used for the description of the initial
part of the breakthrough curve. The linear form of AdamBohart model is given by the following expression:
LnðCt =C0 Þ ¼ ½ðKAB C0 tÞ À ðKAB N0 ZÞ=F
ð6Þ
The parameters kAB and N0 were determined from the intercept and slope of linear plot of ln (Ct/C0) against time (t),
respectively.
Results and discussion
Characteristics of adsorbent
Glass column of 2 cm internal diameter and 30 cm height was
used in fixed bed experiments. PCC was packed with different
bed heights (2.5, 5 and 7.5 cm) in the column with a layer of
glass wool at the bottom. Three flow rates (1, 2 and 3 mL/
min) were pumped to the top of the packed column by using
peristaltic pump with different initial ion concentrations (25,
50, 75 mg/L) at 303 K. The effluent samples were collected at
regular intervals and analyzed. Fixed bed studies were terminated when the column reached exhaustion.
Kinetic models of break through curves in fixed-bed column
For good design of fixed bed system, it is important to predict
the breakthrough curve for effluent parameters. Thomas [16],
Bohart–Adams [17] kinetic models were used to predict the
dynamic behavior of the column.
Thomas model
Thomas model is one of the most widely used models in column performance studies. Thomas model is given in linear
form by the following expression:
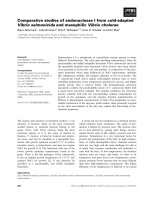
Fig. 1
Fig. 1(a) and (b), represents the SEM photographs of
adsorbent before and after sorption with 500· magnification.
Fig. 1(a), shows that the adsorbent surface is rough, porous
and irregular shapes allowing for good sorption between
U(VI) ions and PCC. After sorption, Fig. 1(b), shows the
loss of porosity and roughness of the adsorbent surface.
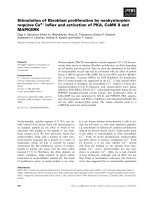
The FTIR spectrum of PCC before and after sorption
(Fig. 2) displays a number of sorption peaks, indicating the
complex nature of the adsorbent material. The band at
3417 cmÀ1 was assigned to the OH group in free alcohols.
The band at 2920 cmÀ1 was assigned to the CAH stretching.
The band at 1615 cmÀ1 was assigned to the asymmetric
stretching of ACOOA in ionic carboxylic group. The band
at 1388 cmÀ1 was assigned to the symmetric ACOOA stretching in pectin. The band at 1012 cmÀ1 was assigned to the
CAOH stretching in alcohols. After metal loading, the C‚O
deformation band (1384 cmÀ1) in pectin remained constant
while shifts occurred in the wave numbers 3417, 2920 and
1615 cmÀ1 indicating an interaction of these functional groups
with sorbed U(VI) and also the appearance of wave number
SEM image of unloaded PCC (a) U(VI) loaded PCC(b).
82
M.A. Mahmoud
Fig. 2
Table 1
FTIR spectrum of unloaded PCC (a) U(VI) loaded PCC (b).
Parameters of batch sorption of U(VI) onto PCC.
Parameter
Removal efficiency (Re %)
q (mg/g)
pH:
(Condition: 25 mg LÀ1, 0.3 g, 3 h, 303 K)
3
4
5
6
7
8
10
85.55
93.20
98.26
95.14
90.21
70.03
42.56
3.56
3.88
7.22
4.07
4.03
3.13
1.77
Initial concentration (mg/L):
(Condition: pH = 5, 0.3 g, 60 min, 303 K)
25
50
75
100
98.26
98.39
98.50
85.32
7.220
8.199
12.31
14.21
30.16
98.50
98.50
98.50
98.50
11.31
12.31
6.156
4.104
3.07
98.50
91.58
80.38
55.29
12.31
11.44
10.04
6.911
Adsorbent dose (g):
(Condition: 75 mg LÀ1, 60 min, pH = 5, 303 K)
Temperature (K):
(Condition: 75 mg LÀ1, 60 min, 0.3 g, pH = 5)
0.1
0.3
0.6
0.9
1.2
303
313
323
333
1738 cmÀ1 in the U(VI) loaded spectra may indicate the interaction of this group with U(VI) ion.
Adsorption dynamics
Table 1 shows that the sorption of U(VI) by PCC was found to
be increased with increasing the time and attained a maximum
value at 60 min (Fig. 3). The U(VI) uptake increased with
changing pH of U(VI) solution from 3 to 10. The decreasing
of sorption capacity at lower pH is due to the competition
between H+ and U(VI) ions. However, with increasing pH
the sorption capacity increased probably due to the decreased
H+ concentration that provided more sorption sites for U(VI)
ions. The optimum pH for U(VI) uptake by PCC was at pH 5
(Fig. 3). The decreasing in the uptake of U(VI) after pH 5 is
due to the formation of stable complexes UO2CO3, [UO2CO3]2À [15]. On changing the initial concentration of U(VI)
solution from 25 to 100 mg/L, the sorption capacity of
U(VI) increased from 7.22 mg/g to 14.21 mg/g. The uptake
of U(VI) was studied using different doses of PCC (0.3, 0.6,
0.9 and 1.2 g). The results indicated that the percent of sorption increased with increase PCC dose due to the increasing
Kinetics studies of uranium sorption by powdered corn cob
Fig. 3
Table 2
83
Effect of pH on the sorption of U(VI) onto PCC at different times.
Kinetics data for adsorption of U(VI) onto PCC.
Parameter
pH
(Condition: 25 mg À1, 0.3 g, 3 h, 303 K)
Adsorbent dose (mg/L)
(Condition: 25 mg LÀ1, 60 min, pH = 5, 303 K)
Pseudo first-order (Lagergren)
3
4
5
6
7
8
10
0.1
0.3
0.6
0.9
1.2
Pseudo second-order
K1
qe
r2
K1
0.0578
0.0786
0.0943
0.1007
0.1089
0.1120
0.1243
2.786
3.733
4.363
4.592
3.710
3.080
2.043
0.913
0.924
0.901
0.826
0.881
0.870
0.899
0.0409
0.0585
0.0725
0.0913
0.1125
0.1289
0.1306
6.483
6.949
7.313
7.273
7.145
6.340
3.240
0.987
0.986
0.979
0.986
0.987
0.998
0.989
0.0722
0.0983
0.1121
0.1303
0.1432
4.034
5.223
5.508
6.523
5.587
0.756
0.888
0.893
0.865
0.911
0.0865
0.0981
0.1023
0.1244
0.1336
5.254
7.313
8.620
10.932
10.911
0.991
0.989
0.988
0.984
0.989
qe
r2
Temperature (°C)
(Condition: 25 mg LÀ1, 60 min, 0.3 g, pH = 5)
303
313
323
333
0.1132
0.1213
0.1345
0.1397
6.033
4.150
4.256
3.143
0.912
0.915
0.928
0.933
0.0523
0.0861
0.1121
0.1253
7.313
6.012
4.132
3.189
0.998
0.996
0.999
0.995
Initial concentration (mg/L)
(Condition: pH = 5, 0.3 g, 60 min, 303 K)
25
50
75
100
0.0432
0.1138
0.1302
0.1427
6.128
7.221
6.570
5.335
0.821
0.901
0.861
0.866
0.0785
0.0958
0.1107
0.1203
7.313
8.874
10.51
14.21
0.996
0.998
0.998
0.987
of sorption sites. The effect of temperature on the sorption of
was studied from 301 to 333 K. The results indicate that
increasing the temperature of the solution decreasing the
removal of U(VI) indicating that the process is exothermic in
nature. The values of correlation coefficients, (r2) in the results
of kinetics data (Table 2), showed good compliance with the
pseudo second-order kinetic model than pseudo first-order
kinetic model (Fig. 4).
7.5 cm bed height, pH 5 and at 303 K. Fig. 5 shows that the
breakthrough curve occurred faster at higher flow rate. This
is because the lower residence time of the influent in the column, thus reducing the contact time between U(VI) and the
PCC. Similar trend has been studied by using orange peels
to remove U(VI) from aqueous solution [18].
Effect of bed height
Column adsorption
Effect of flow rate
The fixed bed study was carried out at different flow rates of 1,
2 and 3 L minÀ1 using 75 mg LÀ1 initial U(VI) concentration,
The effects of bed heights of 2.5, 5 and 7.5 cm were studied at
influent concentration of 75 mg LÀ1, 1 L minÀ1 flow rate, and
pH 5 and at 303 K. Fig. 6 shows that the breakthrough time
decreased with increasing the bed height. Increasing the bed
height, increase the number of sorption sites and the residence
84
M.A. Mahmoud
Fig. 4
Pseudo-first order (a) and Pseudo-second order (b) kinetic models for U(VI) onto PCC at different temperatures.
Fig. 5 Breakthrough curves for adsorption by PCC at different
flow rates.
Fig. 7 Breakthrough curves for U(VI) adsorption by PCC at
different bed heights.
Effect of initial concentration
The increasing effect of initial U(VI) concentration from 25 to
75 mg/L at constant bed height of 7.5 cm, flow rate of 1 mL/
min, pH 5 and at 303 K in the breakthrough curves is shown
in Fig. 7. It is observed that the break point time decreased
with increased initial U(VI) concentration from 25 to 75 mg/
L. On increasing the initial ion concentration, the breakthrough curves became steeper and breakthrough volume
decreased because of the lower mass-transfer system from
the bulk solution to the adsorbent surface [19,20].
Evaluation of kinetics models in fixed-bed column
Fig. 6 Breakthrough curves for U(VI) adsorption by PCC at
different initial U(VI) concentrations.
time of the U(VI) in the column, thus increasing the removal
efficiency of U(VI) in the fixed bed system.
Thomas model
The column data were fitted to the Thomas model to determine the Thomas rate constant (kTh) and maximum sorption
capacity (qe). Table 2 shows that the column bed height and
initial concentration increased the values of kTh and qe
decreased and increased, respectively. This is due to the driving
Kinetics studies of uranium sorption by powdered corn cob
85
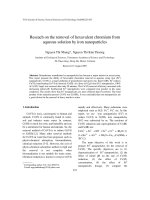
Table 3 Thomas and Bohart–Adams model parameters using linear regression analysis for U(VI) adsorption under various operating
conditions.
Model type
Flow rate (mL/min)
Bed height (cm)
Initial concentration C0 (mg/L)
qe,max (mg/g)
kTh (mL/min mg)
R2
Thomas model
1
2
3
1
1
1
1
7.5
7.5
7.5
2.5
5
7.5
7.5
75
75
75
75
75
50
25
8.054
4.321
3.331
4.230
5.620
2.331
1.381
0.310
0.611
0.830
0.342
0.391
0.730
1.140
0.988
0.998
0.999
0.976
0.989
0.988
0.989
Bohart–Adams model
Flow rate (mL/min)
1
2
3
1
1
1
1
Bed height (cm)
7.5
7.5
7.5
2.5
5
7.5
7.5
C0 (mg/L)
75
75
75
75
75
25
50
N0 (mg/L)
4.133
2.560
0.980
1.933
2.980
1.223
2.334
kAB (L/min mg)
0.344
0.525
0.731
0.645
0.520
0.670
0.443
R2
0.822
0.901
0.841
0.730
0.911
0.867
0.854
Fig. 8
Linear plot of Thomas model with experimental data at different flow rates, initial U(VI) concentrations and bed heights.
force of adsorption process is the difference between the concentration of uranium ions in the solution and on the adsorbent [21,22]. As the flow rate increased, the value of kTh
increased, but the value of qe,max decreased. The values of r2
of kinetic model ranged from 0.968 to 0.998, indicating good
linearity. Table 3 and Fig. 8 indicate that Thomas model is
suitable for sorption of U(VI) with PCC.
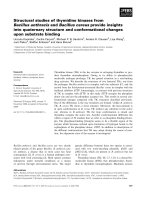
Bohart–Adams model
Bohart–Adams rate constant, KAB and capacity of the adsorbent (N0) are dependent on flow rate, initial ion concentration
and bed height. From Table 2, it can be seen that the values of
kinetic constant (kAB) and capacity of the adsorbent (N0)
decreased and increased with increasing bed height and initial
uranium concentration, respectively. Sorption capacity (N0)
decreased with increasing flow rate, but the value of kAB
increased with increasing flow rate (Fig. 9). From results of linear plots of both Thomas and Bohart–Adams model at different heights, flow rates, and concentrations (Table 3), it was
observed that Thomas model is appropriate models to describe
fixed-bed system. But in the case of Bohart–Adams model, low
correlation coefficient (r2 = 0.925) is observed, which indicate
that Bohart–Adams model is not as appropriate a predictor for
the breakthrough curve, so that the design calculations of large
scale were performed using Thomas models. Table 4, shows
the comparison between adsorption capacities of PCC and
some of available and low-cost adsorbents for U(VI) uptake
from aqueous solutions reported in the literature.
86
Fig. 9
M.A. Mahmoud
Linear plot of Bohart–Adams model with experimental data at different flow rates, initial U(VI) concentrations and bed heights.
Compliance with Ethics Requirements
Table 4 Comparison between adsorption capacities of PCC
and some adsorbents for U(VI) uptake from aqueous solutions.
Adsorbents
Adsorption capacity(mg/g) Reference
Activated carbon
Coir pith
Orange peels
Palm-shell
Sunflower
Date pits
Natural clay
Powdered corncob
28.50
28.00
15.91
25.10
13.45
10.00
3.53
14.21
[2]
[4]
[5]
[6]
[9]
[23]
[24]
The present study
Conclusions
In this work, PCC has good ability to remove U(VI) from
aqueous solution in batch and fixed bed system. The experimental results in batch technique were fitted well with pseudo
second-order than pseudo first-order kinetics model. The
uptake of uranium ions in fixed bed system depends on flow
rate, bed height and initial concentration. Thomas and
Bohart–Adams kinetic models were used to evaluate the performance of fixed bed column. The value of correlation coefficients of Bohart–Adams model was generally lower than
Thomas model under the same experimental conditions. The
column experimental data were good fitted with Thomas
model, but the Bohart–Adams model predicted poor performance of fixed-bed column.
Conflict of interest
The author has declared no conflict of interest
This article does not contain any studies with human or animal
subjects
References
[1] Qadeer R, Hanif J. Kinetics of uranium (VI) ions adsorption on
activated charcoal from aqueous solutions. Radiochem Acta
1994;65:259–63.
[2] Abbasi WA, Streat M. Adsorption of uranium from aqueous
solutions using activated carbon. Sep Sci Technol
1994;29(9):1217–30.
[3] Xinghui W, Guiru Z, Feng G. Removal of uranium (VI) ion
from aqueous solution by SBA-15. Ann Nucl Energy
2013;56:151–7.
[4] Harshala P, Shreeram J, Niyoti S, Rakesh V, Arvind L,
Sudersanan M, et al. Uranium removal from aqueous solution
by coir pith: equilibrium and kinetic studies. Bioresource
Technol 2005;96(11):1241–8.
[5] Mohamed AM. Removal of uranium (VI) from aqueous
solution using low cost and eco-friendly adsorbents. J Chem
Eng Process Technol 2013;4:6–10.
[6] Shilpi K, Padmaja PS. Sorption of uranium from aqueous
solutions using palm-shell-based adsorbents: a kinetic and
equilibrium study. J Environ Radio 2013;126:115–24.
[7] Yakout SM, Metwally SS, El-Zakla T. Uranium sorption onto
activated carbon prepared from rice straw: competition with
humic acids. Appl Surf Sci 2013;280:745–50.
[8] Prashant R, Balasubramanian K, Renuka RG. Uranium(VI)
remediation from aqueous environment using impregnated
cellulose beads. J Environ Radio 2014;136:22–9.
[9] Nualchavee R, Pimsiri S, Narippawat N. Uranium absorption
ability of sunflower, vetiver and purple guinea grass. Kasetsart J
(Nat Sci) 2010;44:182–90.
[10] Onishi H. Photometric determination of trace metals. NY
(USA): Wiley; 1989.
Kinetics studies of uranium sorption by powdered corn cob
[11] El-Halwany MM. Study of adsorption isotherms and kinetic
models for methylene blue adsorption on activated carbon
developed from Egyptian rice hull (Part II). Desalination
2010;250:208–13.
[12] El-Halwany MM. Kinetics and thermodynamics of activated
sunflowers seeds shell carbon (SSSC) as sorbent material. J
Chromat Sep Techniq 2013;4:5–11.
[13] Christian TCV, Fauduet H, Porte C, Delacroix A. Removal of
Cd(II) and Pb(II) ions, from aqueous solutions, by adsorption
onto sawdust of Pinus sylvestris. J Hazard Mater
2003;105:121–42.
[14] Monoj KM. Removal of Pb(II) from aqueous solution by
adsorption using activated tea waste. Korean J Chem Eng
2010;27, 144-15.
[15] Recep A. Uranium and thorium adsorption from aqueous
solution using a novel polyhydroxyethylmethacrylate-pumice
composite. J Environ Radio 2013;120:58–63.
[16] Thomas HC. Heterogeneous ion exchange in a flowing system. J
Am Chem Soc 1944;66:1664–6.
[17] Bohart G, Adams EQ. Some aspects of the behaviour of
charcoal with respect to chlorine. J Am Chem Soc
1920;42:523–44.
[18] Mohamed AM. Evaluation of uranium removal from aqueous
solution using orange peels in the fixed bed system. J Chem Eng
Process Technol 2014;5(5):2–5.
87
[19] Sivakumar P, Palanisamy PN. Adsorption studies of basic Red
29 by a non-conventional activated carbon prepared from
Euphorbia antiquorum L. Int J Chem Technol Res
2009;1(3):502–10.
[20] Baek K, Song S, Kang S, Rhee Y, Lee C, Lee B, Hudson S,
Hwang T, et al. Adsorption kinetics of boron by anion
exchange resin in packed column bed. J Ind Eng Chem
2007;13(3):452–6.
[21] Zahra S, Reyhane S, Reza F. Fixed-bed adsorption dynamics of
Pb (II) adsorption from aqueous solution using nanostructured
c-alumina. J Nano Chem 2013;3:48–52.
[22] Aksu Z, Gonen F. Biosorption of phenol by immobilized
activated sludge in a continuous packed bed: prediction of
breakthrough curves. Process Biochem 2004;39:599–613.
[23] Saad EM, Mansour RA, El-Asmy A, El-Shahawi MS. Sorption
profile and chromatographic separation of uranium (VI) ions
from aqueous solutions onto date pits solid sorbent. Talanta
2008;76:1041–6.
[24] Jean AO, Franc¸ois E, Joseph NN, Paola AE, Edouard NE.
Batch experiments on the removal of U(VI) ions in aqueous
solutions by adsorption onto a natural clay surface. J Environ
Earth Sci 2013;3(1):11–23.