Direct effect of silicon and sulphur on nutrient content and uptake of rice crop under rice-wheat cropping sequence
Bạn đang xem bản rút gọn của tài liệu. Xem và tải ngay bản đầy đủ của tài liệu tại đây (272.89 KB, 10 trang )
Int.J.Curr.Microbiol.App.Sci (2019) 8(4): 625-634
International Journal of Current Microbiology and Applied Sciences
ISSN: 2319-7706 Volume 8 Number 04 (2019)
Journal homepage:
Original Research Article
/>
Direct Effect of Silicon and Sulphur on Nutrient Content and Uptake of
Rice Crop under Rice-Wheat Cropping Sequence
Vimal N. Patel*, K.C. Patel and K.V. Chaudhary
Department of Soil Science and Agricultural Chemistry, B. A. College of Agriculture,
Anand Agricultural University, Anand, Gujarat, India
*Corresponding author
ABSTRACT
Keywords
Silicon, Sulphur,
Rice, Phosphorus,
Content, Uptake
Article Info
Accepted:
07 March 2019
Available Online:
10 April 2019
The field experiment was conducted on “Effect of silicon and sulphur on yield and
chemical composition on rice and its residual effect on wheat in loamy sand soil” during
the kharif and rabi seasons for two years 2016-17 and 2017-18 at Regional Research
Station farm, Anand Agricultural University, Anand (Gujarat). The experiment was laid
out in Randomized Block Design with factorial concept, comprising twelve treatment
combinations of four levels of silicon (0, 150, 300 and 450 kg Si ha -1) and three levels of
sulphur (0, 20 and 40 kg S ha-1) with three replications. The maximum Si and S content in
grain and straw was noticed due to combined application of 450 kg Si ha -1 and 40 kg S ha1
. Significantly higher phosphorus content in grain and straw was found under application
of 450 kg Si ha-1.No significant change in P content in grain and straw were observed with
varying levels of S application. Significantly highest Si and S uptake by rice grain and
straw was observed under highest Si application (450 kg Si ha -1) with highest S level at 40
kg ha-1 over rest of the combinations. The maximum P uptake by rice grain and in rice
straw was recorded due to application of 450 kg Si ha -1 during both the years as well as on
pooled basis respectively. Addition of sulphur increased P uptake by grain and the
maximum uptake was recorded at 40 kg S ha-1 during second year and pooled basis.
abiotic stresses including salt stress, metal
toxicity, drought stress, radiation damage,
nutrient imbalance, high temperature, and
freezing (Ma and Takahashi, 2002). In crop
production the benefits from Si fertilization
may include increased yield, disease and
insect resistance and tolerance to stresses such
as cold, drought, and toxic metals. Rice,
wheat, cucurbits, corn and sugarcane are
crops that have been shown to benefit from Si
fertilization. In addition to crops, the value of
silicon is gaining attention in animal nutrition
Introduction
Silicon content in different parts of a rice
plant generally ranged from high to low, in
descending rank in the hull, leaf, leaf sheath,
culm, and root (Zhu, 1985). Silicon helps
plants to overcome multiple stresses including
biotic and abiotic stresses (Ma, 2004). For
example, Si plays an important role in
increasing the resistance of plants to
pathogens such as blast on rice (Datnoff et al.,
1997) and also alleviates the effects of other
625
Int.J.Curr.Microbiol.App.Sci (2019) 8(4): 625-634
where Si may play a role in the health of
bone, joints, skin, hair and connective tissues.
Si exists in all plants grown in soil and its
content in plant tissue ranges from 0.1 to
10%.
Materials and Methods
The field experiment was conducted during
the kharif season for two years 2016-17 and
2017-18 at the Regional Research Station,
Anand Agricultural University, Anand,
Gujarat. The soil of the experimental field
was loamy sand in texture with the pH of 7.8
and organic carbon 0.30 %. The soluble salts
(EC) content was medium and an overall
mean value of 0.23 dS m-1.The status of
available nutrients like Si (68.73 mg kg-1),
P2O5 (32.58 kg ha-1), S (9.81 mg kg-1), Fe
(7.31 mg kg-1) and Zn (1.23 mg kg-1). The
treatment comprised of four levels of silicon
(Si) (0, 150, 300 and 450 kg ha-1 through
calcium silicate) and three levels of sulphur
(S) (0, 20 and 40 kg ha-1 through bentonite
sulphur) were applied as basal along with
recommended NPK dose of fertilizers (120:
40: 00 kg ha-1). The experiment was laid out
in factorial randomized block design with
three replications. Available silicon in the
soils was extracted by using NaOAc (14.8 g
NaOAc+49.2 mL acetic acid L-1, adjusted to
pH 4, Sample: solution=10 g: 100 ml, 1 hr.
shaking) and silicon in the extracting solution
was determined by taking 1 ml of aliquot
from filtrate into plastic centrifuge tube, 30
mL of acetic acid and 10 mL of ammonium
molybdate solution (54 g L-1 pH 7) and then
after 5 minutes, 5 mL of 20% tartaric acid
solution and after two minutes, 1 mL reducing
agent ANSA (1-amino-2- naphthol-4sulphonic acid) were added and final volume
was made upto 50 mL with 20% acetic acid.
Within thirty minutes, concentration of silicon
was measured as absorbance at 650 nm on
UV, Visible Spectrophotometer (Korndorfer
et al., 1999).
Sulphur (S) is one of the sixteen essential
plant nutrients and ranks fourth major nutrient
next to N, P and K. Crop requires sulphur
generally as much phosphorus and one tenth
of nitrogen. Among the essential elements,
sulphur is very much beneficial for increasing
the production of rice and is one of the major
essential nutrient elements involved in the
synthesis of chlorophyll, certain amino acids
like methionine, cystine, cysteine and some
plant hormones such as thiamine and biotin
(Rahman et al., 2007). Accumulation of
inorganic nitrogen or organic non-protein
nitrogen in the tissue, leaf area, seed number
plant-1, floral initiation and anthesis in plants
are affected by the presence or absence of
sulphur (Tiwari, 1994). Growing of sulphur
responsive crops, high intensive cropping and
use of sulphur free fertilizers caused S
deficiency in soils of India (Tandon and
Tiwari, 2007).
Paddy is considered as silicon accumulator.
An adequate supply of silicon to paddy from
tillering to elongation stage increases the
number of grains per panicle and enhances
ripening (Korndorfer et al., 2001). It is also
suggested that the silicon plays a crucial role
in preventing or minimizing the lodging
incidence in the cereal crops, a matter of great
importance in terms of crop productivity. Rice
is the staple food of about half of the world's
population. The benefits from Si fertilization
may include increased yield, enhanced
disease and insect resistance and tolerance to
stresses such as cold, drought and toxic
metals. Various crops like wheat, cucurbits,
corn and sugarcane have been shown to be
benefited from Si fertilization.
For the plant samples the powered sample
(0.1g) was digested in a mixture of 2 mL of
50% H2O2 and then 4.5 mL of 50% NaOH
was added at ambient temperature in each
polypropylene 100 mL tube. The tubes were
626
Int.J.Curr.Microbiol.App.Sci (2019) 8(4): 625-634
individually covered with loose fitting plastic
cups. The rack of tubes was placed in an
autoclave (15 psi & 138 Kpa) for one hour.
The volume of digested contents in the tubes
was made up to 50 mL with double distilled
water and after filtration; 1 mL aliquot was
taken for Si estimation (Dai et al., 2005). The
Si concentration in the digested solution was
determined by 1 mL of digested aliquot. It
was transferred to a plastic centrifuge tube
and 30 mL of 20% acetic acid, 10 mL of
ammonium molybdate (54 g L1 pH 7), 5 mL
of 20 % tartaric acid and 1 mL of reducing
ANSA solution (1-amino-2- naphthol-4sulphonic acid) were added and the volume
was made up to 50 mL with 20% acetic acid.
After 30 minutes, the absorbance was
measured at 650 nm on UV, Visible
Spectrophotometer (Dai et al., 2005).
Similarly, 100 ppm SiO2 strength and a stock
solution of Si standards (0, 0.2, 0.4, 0.8 and
1.2 ppm) were prepared by following the
same procedure and silicon concentration was
measured on spectrophotometer to find out
the graph factor from a standard curve by
plotting Si concentration on X axis and
optical density on the Y axis. Nutrient uptake
by both grain and straw of rice and wheat was
calculated using the values of nutrient content
and yield of grain and straw (kg ha-1). The
experimental data were analyzed as per the
procedure outlined by Steel and Torrie
(1982).
silicon content in straw (6.78 %) was found
under application of 450 kg Si ha-1 over rest
of the treatments. Application of 40 kg S ha-1
significantly increased the average Si content
in straw (5.67 %). The maximum Si content
in straw was noticed due to combined
application of 450 kg Si ha-1 and 40 kg S ha-1
(Table 2). The nutrients content in rice
significantly affected by silicon and sulphur
application and similar results also obtained
by Deren et al., (1994) and marked that
increase in Si concentration in plant tissue
with increasing rate of Si fertilization and
cultivars differed for Si concentration and its
uptake, thus, stressed the necessity for
identifying or developing rice genotypes
which are more efficient in accumulating
available Si which may be of particular
benefit on Si deficient soils. Hayasaka et al.,
(2005) reported that the response of rice
plants to Si fertilization depends on soil
factors such as Si availability to the plant and
on plant factors such as the Si content of plant
tissues. The amount of available Si in soils
varies with soil composition. Thus, the Si
content depends on the kind of soil used. In
their study, application of silica gel
effectively increased the Si content of nursery
seedlings regardless of soil type. The results
are in agreement with the findings of Islam
and Saha (1969); Inanaga et al., (2002);
Shivay and Dinesh Kumar (2009) and Idris et
al., (1975).
Results and Discussion
The maximum average S content in grain
(0.172 %) was noticed at maximum level of
Si application. The maximum increment over
control was to the tune of 39.83 per cent
higher on a pooled basis. Among the various
S levels, application of 40 kg S ha-1 produced
significantly higher average S content in grain
(0.164 %). The maximum increment over
control was to the tune of 33.35 per cent
higher on pooled basis. The highest S content
in grain was noticed due to combined effect
of 450 kg Si ha-1 and 40 kg S ha-1 application
The application of Si significantly affected Si
content in grain of rice. Significantly highest
average silicon content in grain (2.22 %) was
found under application of 450 kg Si ha-1 over
rest of the treatments. Application of 40 kg S
ha-1 significantly increased the average Si
content in grain (1.79 %). The maximum Si
content in grain was noticed due to combined
application of 450 kg Si ha-1 and 40 kg S ha-1
(Table 1). Significantly highest average
627
Int.J.Curr.Microbiol.App.Sci (2019) 8(4): 625-634
(Table 1). The maximum average S content in
straw (0.123 %) was noticed at maximum
level of Si application. The maximum
increment over control was to the tune of
38.20 per cent higher on a pooled basis.
Among the various S levels, application of 40
kg S ha-1 produced significantly higher
average S content in straw (0.129 %). The
maximum increment over control was to the
tune of 67.46 per cent higher on pooled basis.
The highest S content in straw was noticed
due to combined effect of 450 kg Si ha-1 and
40 kg S ha-1 application (Table 2). Increase in
Si levels ultimately increased the absorption
of sulphur and CO2 thus it blocks the hatches
and improve the photosynthesis (Gerami et
al., 2012). Tiwari et al., (1983) and Hoque
and Eaqub (1984) reported that sulphur
application increased its content in grain and
straw. The findings of the present study are in
conformity with the results reported by
Mandata et al., (1994) who noted that
concentration of Si in rice plant increased
with increasing rates of S application. Islam et
al., (1987) reported that the highest S content
in plant was noted when 30 to 40 kg S ha-1
were added to the soil. The increased in
sulphur content of straw by Si application
might be due to greater availability of this
nutrient. Malidareh et al., (2009) reported that
sulphur content in rice straw increased with
increasing Si application
straw were observed with varying levels of S
application (Table 2). Owino and Gascho
(2004) indicated that the P content increased
when Si was applied, which could be
attributed to the increase in the soil pH from
the accompanying Ca and Si concentration in
the soil solution, which improved the
conditions for uptake of P by maize. Similar
results were also recorded by Ma and
Takahashi (2002) and Hellal et al., (2012).
Increased P in grain and straw could be
attributed to enhanced translocation of P from
roots to shoots due to Si application (Wang et
al., 2001). Sauer and Burghardt (2000) also
opined that when P is not applied, Si
fertilization increased the P content of rice
straw and grain which could be attributed to
better availability of native soil P and
enhanced mobility of P from the roots to the
stem. The beneficial effect of Si when
available P is low can be explained as a
partial substitution of Si for P (Ma and
Takahashi 1990). In the absence of Si, a
considerable decrease in the incorporation of
inorganic phosphates into ATP and ADP and
sugar phosphate has been observed in sugar
cane (Wong You Cheong et al., 1973).
The application of Si (450 kg ha-1) resulted in
maximum Si uptake by rice grain (139.58 kg
ha-1). The Si uptake by rice grain was
observed significantly highest at S40 level as
compared to S20 and S0 levels. The values
were ranged from 88.71 to 112.47 kg ha-1.
Significantly highest Si uptake in rice grain
was observed under highest Si application
(450 kg Si ha-1) with highest S level at 40 kg
ha-1 (174.32 kg ha-1) over rest of the
combinations (Table 3).
Significantly higher phosphorus content in
grain was found under application of 450 kg
Si ha-1.The P content in grain was increased
from 0.194 to 0.249 %, 0.198 to 0.253 % and
0.196 to 0.251 % during both the years as
well as on pooled basis, respectively (Table
1). Significantly higher phosphorus content in
straw was found under application of 450 kg
Si ha-1. The P content in straw was increased
from 0.076 to 0.106 %, 0.071 to 0.115 % and
0.073 to 0.112 % during both the years as
well as on pooled basis, respectively. No
significant change in P content in grain and
Significantly highest Si uptake by straw was
noticed due to application of 450 kg Si ha-1.
The value was in range of 292.08 to 536.12,
324.26 to 564.49 and 308.17 to 550.39 kg ha-1
during both the years as well as on pooled
basis respectively, over control.
628
Int.J.Curr.Microbiol.App.Sci (2019) 8(4): 625-634
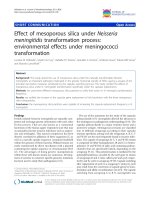
Table.1 Effect of silicon and sulphur on silicon, sulphur and phosphorus content of rice grain
under rice – wheat cropping sequence
Silicon content (%) in grain
Treatment
2016-17
2017-18
Pooled
Silicon levels (kg ha-1)
1.12
1.23
1.18
Si0
1.35
1.46
1.41
Si150
1.87
1.99
1.93
Si300
2.16
2.27
2.22
Si450
0.05
0.06
0.04
S.Em. ±
0.14
0.18
0.11
CD
(P=0.05)
Sulphur levels (kg ha-1)
1.54
1.59
1.56
S0
1.64
1.73
1.69
S20
1.71
1.88
1.79
S40
0.04
0.05
0.03
S.Em. ±
0.12
0.16
0.10
CD
(P=0.05)
Si × S
Si × S
Si × S
Significant
interactions
8.59
10.80
8.51
CV %
Sulphur content (%) in grain
2016-17 2017-18
Pooled
Phosphorus content (%) in grain
2016-17
2017-18
Pooled
0.120
0.137
0.153
0.169
0.004
0.011
0.127
0.143
0.162
0.175
0.003
0.009
0.123
0.140
0.157
0.172
0.003
0.008
0.194
0.215
0.232
0.249
0.007
0.020
0.198
0.215
0.237
0.253
0.005
0.016
0.196
0.215
0.134
0.251
0.004
0.011
0.120
0.154
0.161
0.003
0.009
0.125
0.161
0.168
0.003
0.008
0.123
0.158
0.164
0.002
0.007
0.217
0.223
0.227
0.006
NS
0.219
0.226
0.231
0.005
NS
0.218
0.225
0.229
0.003
NS
Si × S
Si × S
Si × S
-
-
-
7.75
6.04
5.51
9.25
7.24
9.55
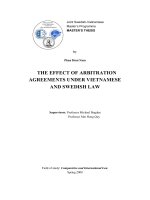
Table.2 Effect of silicon and sulphur on silicon, sulphur and phosphorus content of rice straw
under rice – wheat cropping sequence
Silicon content (%) in straw
Treatment
2016-17
Silicon levels (kg ha-1)
4.08
Si0
5.21
Si150
5.80
Si300
6.65
Si450
0.16
S.Em. ±
0.48
CD
(P=0.05)
Sulphur levels (kg ha-1)
5.40
S0
5.43
S20
5.47
S40
0.14
S.Em. ±
NS
CD
(P=0.05)
Significant
interactions
9.06
CV %
Sulphur content (%) in straw
Phosphorus content (%) in
straw
2016-17
2017-18
Pooled
2017-18
Pooled
2016-17
2017-18
Pooled
4.41
5.54
6.14
6.91
0.21
0.62
4.24
5.38
5.97
6.78
0.17
0.49
0.081
0.093
0.105
0.116
0.002
0.007
0.098
0.108
0.121
0.131
0.003
0.008
0.089
0.101
0.113
0.123
0.002
0.005
0.076
0.088
0.097
0.106
0.002
0.006
0.071
0.091
0.102
0.115
0.003
0.008
0.073
0.089
0.098
0.112
0.002
0.005
5.63
5.76
5.87
0.18
NS
5.52
5.59
5.67
0.14
NS
0.080
0.098
0.120
0.002
0.006
0.085
0.104
0.138
0.002
0.008
0.083
0.101
0.129
0.002
0.004
0.089
0.091
0.094
0.002
NS
0.093
0.095
0.097
0.002
NS
0.091
0.093
0.096
0.001
NS
-
-
Si × S
Si × S
Si × S
-
-
-
11.06
6.60
7.28
6.99
7.81
6.58
8.52
9.60
629
Int.J.Curr.Microbiol.App.Sci (2019) 8(4): 625-634
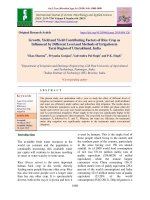
Table.3 Effect of silicon and sulphur on silicon, sulphur and phosphorus uptake by rice grain
under rice – wheat cropping sequence
Silicon uptake (kg ha-1) by
grain
Treatment
2016-17
2017-18
Pooled
Silicon levels (kg ha-1)
63.80
70.45
67.12
Si0
78.43
84.89
81.66
Si150
110.46
118.37
114.41
Si300
135.28
143.86
139.58
Si450
3.04
4.18
2.62
S.Em. ±
8.93
12.28
7.74
CD
(P=0.05)
Sulphur levels (kg ha-1)
86.83
90.60
88.71
S0
97.98
103.82
100.89
S20
106.18
118.77
112.47
S40
2.63
3.62
2.28
S.Em. ±
7.74
10.64
6.71
CD
(P=0.05)
Si × S
Si × S
Si × S
Significant
interactions
9.43
12.04
10.35
CV %
Sulphur uptake (kg ha-1) by
grain
2016-17 2017-18
Pooled
Phosphorus uptake (kg ha-1) by
grain
2016-17
2017-18
Pooled
6.79
7.96
9.05
10.62
0.28
0.83
7.28
8.25
9.67
11.15
0.24
0.72
7.03
8.12
9.36
10.88
0.24
0.70
11.03
12.43
13.74
15.52
0.56
1.66
11.34
12.49
14.10
15.93
0.42
1.25
12.18
12.46
13.92
15.72
0.39
1.15
6.80
9.16
9.86
0.24
0.72
7.12
9.63
10.52
0.21
0.62
6.96
9.39
10.19
0.20
0.61
12.30
13.32
13.91
0.49
NS
12.52
13.50
14.38
0.37
1.09
12.41
13.44
14.14
0.34
1.00
Si × S
Si × S
Si × S
-
-
-
9.97
8.13
5.37
12.91
9.56
9.98
Table.4 Effect of silicon and sulphur on silicon, sulphur and phosphorus uptake by rice straw
under rice – wheat cropping sequence
Silicon uptake(kg ha-1) by
straw
Treatment
2016-17
2017-18
Pooled
Silicon levels (kg ha-1)
292.08
324.26
308.17
Si0
383.36
418.92
401.14
Si150
441.08
472.63
456.86
Si300
536.12
564.49
550.39
Si450
12.48
18.42
16.48
S.Em. ±
54.21
54.20
48.34
CD
(P=0.05)
Sulphur levels (kg ha-1)
389.79
413.42
401.60
S0
414.25
447.40
430.82
S20
435.44
474.41
454.92
S40
16.00
15.84
14.27
S.Em. ±
NS
46.94
41.87
CD
(P=0.05)
Significant
interactions
13.42
12.46
7.99
CV %
Sulphur uptake (kg ha-1) by
straw
2016-17 2017-18
Pooled
Phosphorus uptake(kg ha-1) by
straw
2016-17
2017-18
Pooled
5.78
6.83
8.06
9.43
0.28
1.12
7.17
8.19
9.38
10.93
0.30
0.90
6.48
7.51
8.72
10.18
0.25
0.75
5.42
6.49
7.38
8.51
0.25
0.75
5.58
6.73
7.39
9.45
0.20
0.58
5.50
6.61
7.38
8.94
0.18
0.53
5.80
7.25
9.52
0.24
0.71
6.26
7.75
12.37
0.26
0.78
6.03
7.50
11.13
0.22
0.65
6.44
6.94
7.46
0.22
0.65
6.74
7.30
7.82
0.17
0.50
6.59
7.12
7.64
0.15
0.46
Si × S
Si × S
Si × S
-
-
-
11.25
10.34
7.65
11.14
8.23
9.47
630
Int.J.Curr.Microbiol.App.Sci (2019) 8(4): 625-634
(11.13 kg ha-1) was recorded at maximum
level of S application. Significantly highest S
uptake by rice straw was observed under
highest Si application (450 kg Si ha-1) with
highest S level at 40 kg ha-1 (14.39 kg ha-1)
over rest of the combinations (Table 4).
Silicon also favorably influenced the sulphur
uptake showing its synergistic effect with
silicon application as reported by Jawahar and
Vaiyapuri (2010).The silicon fertilization
significantly increased S uptake by grain due
to increased availability of S in soil. These
results are in agreement with the findings of
Sumida (1992); Singh et al., (2006); Osuna et
al., (1991) and Korndorfer et al.,
(2001).Significant increase in S uptake within
S levels could be due to increased availability
of S in the soil from applied S with
concomitant increase in grain yield. Vaiyapuri
and Sriramachandrasekharan (2001) had
reported increase in sulphur uptake by rice
with increase in S levels earlier.
The Si uptake by rice straw was higher with
40 kg S ha-1 compared to 20 kg S ha-1and 0 kg
S ha-1 levels (Table 4). The silicon uptake is
mainly dependent on Si supplying ability of
the soil and with increased application of Si,
there was increase in solubilisation of Si and
thus Si uptake. These results are in agreement
with the findings of Sumida (1992); Singh et
al., (2006); Osuna et al., (1991) and
Korndorfer et al., (2001). This could be also
due to increased root activity and enhanced
soil nutrient availability. This is in accordance
with the reports of Wani et al., (2000).
Further, the increased uptake with crop
growth might be attributed to the increased
DMP produced with growth of crop due to the
enhanced release and consequent availability
of nutrients to the crops.The silicon uptake
was higher in straw compared to the uptake
by grain at harvest. Ma and Takahashi (2002)
reported that beneficial effects of Si exposed
through silicon deposition in the leaves, stems
and hulls. Therefore silicon is characterized
by wide effects associated with greater Si
accumulation in the shoots. Ma and Yamaji
(2006) explained that the variation in the
uptake values by the two verities could be due
to differential expression of gene, which
belongs to the Aquaporin family and is
constitutively expressed in the roots. It is
localized on the plasma membrane of the
distal side of both exodermis and endodermis
cells, where casparin strips are located.
The maximum P uptake by rice grain (15.52,
15.92 and 15.72 kg ha-1) was recorded due to
application of 450 kg Si ha-1 during both the
years as well as on pooled basis respectively.
Addition of sulphur increased P uptake by
grain and the maximum uptake was recorded
at 40 kg S ha-1 during second year and pooled
basis however, effect of sulphur was nonsignificant in first year. The maximum
improvement was to the value of 13.94 per
cent higher during pooled basis over control
(Table 3). The maximum P uptake by rice
straw (8.51, 9.45 and 8.94 kg ha-1) was
recorded due to application of 450 kg Si ha-1
during both the years as well as on pooled
basis respectively. The P uptake in rice straw
was higher with S40 compared to S20 and S0
levels; however, it was at par with 20 kg S ha1
during first year. The maximum
improvement was to the value of 15.93 per
cent higher during pooled basis over control
(Table 4). Increasing silicon levels increased
phosphorus content due to decreased retention
Significantly higher S uptake by grain (10.88
kg ha-1) was observed under Si application @
450 kg Si ha-1. Maximum S uptake by grain
(10.19 kg ha-1) was recorded at maximum
level of S application. Significantly highest S
uptake by rice grain was observed under
highest Si application (450 kg Si ha-1) with
highest S level at 40 kg ha-1 (13.43 kg ha-1)
over rest of the combinations (Table 3).
Significantly higher S uptake straw (10.18 kg
ha-1) was observed under Si application @
450 kg Si ha-1. Maximum S uptake by straw
631
Int.J.Curr.Microbiol.App.Sci (2019) 8(4): 625-634
capacity of soil and increased solubility of
phosphorus leading to increased efficiency of
phosphatic fertilizer (Subramanian and
Gopalswamy, 1991). These results are in line
with Chanchareonsook et al., (2002) who
reported that application NPK fertilizer in
combination with Si significantly increased
total N, P and K uptake of rice. The increased
in P uptake by silicon application might be
due to increase in soil available P as both of
these nutrients are absorbed by plants.
Phosphorus use efficiency is enhanced by
silicon application and the beneficial effect of
silicon is seen when available P is low it may
due to partial substituting of silicon for P or
an improvement of P availability in soil. On
mineral soils with low soil pH, phosphorus
present as complex with Al and Fe phosphate
may become plant available with addition of
silicon thereby increasing crop yield.
Presence of silicon increased phosphorus
concentration and P uptake due to enhanced
phosphate absorption and it was attributed to
the availability of silicate ions to displace the
fixed phosphorus ions in the soil leading to
increased phosphorus uptake. Depressing
effect of silicate on P retention capacity of
soil may be added reasons to increase the
level of water soluble P in the soil. Hence, it
can be inferred that the increase in the uptake
of P with the application of silicon might be
attributed to enhanced availability and uptake
of nutrients from soil which is made possible
by desorption of P (Subramaniyan and
Gopalaswarmy, 1991). Higher P uptake in the
presence of S could be due to the capacity of
S in mobilizing soil P into available form.
Muneshwar Singh et al., (2001) reported that
P and K uptake were stimulated in the
presence of S.
References
Chanchareonsook, J., Suwannarat, C.,
Thongpae, S., Chanchareonsook, S.
and Thinai, P. (2002). Bioremediation
of rice grown acid soils through acid
tolerant cyanobacteria. In Proceedings
of the 17th World Congress Soil
Science,
14-21
August
2002,
International Union of Soil Sciences,
Bangkok, Thailand. 377.
Datnoff, L. E., Deren, C. W. and Snyder, G.
H. (1997). Silicon fertilization for
disease management of rice in Florida.
Crop Protection, 16, 525-531.
Deren, C. W., Datnoff, L. E. Snyder, G. H.
and Martin, F. G. (1994). Silicon
content,
disease
response
and
components of yield of rice genotypes
grown on flooded organic Histosols.
Crop Sciences, 34, 733 - 737.
Gerami, M., Fallah, A. and Moghadam, M.K.
(2012). Study of potassium and
sodium silicate on the morphological
and chlorophyll content on the rice
plant in pot experiment (Oryza sativa
L.).
International
Journal
of
Agriculture and Crop Sciences, 4,
658-661.
Hayasaka, T., Fuji, H. and Namai, T. (2005).
Silicon content in rice seedlings to
protect rice blast fungus at the nursery
stage. Journal of General Plant
Pathology71, 169-173.
Hellal, F. A., Zeveny, R. M. and Yassen, A.
A. (2012). Evaluation of nitrogen and
silicon application for enhancing yield
production and nutrient uptake by
wheat in clay soil. Journal of Applied
Sciences Research, 8 (2), 686-692.
Hoque, M. S. and Eaqub, M. (1984). Study on
zinc and sulphur deficiency in
Bangladesh Soils. Annual Report,
FAO(Food & Agriculture Org.)
Project (1983-84).
Idris, M.D., Hossain, M.H. and Choudhary,
In conclusion, application of silicon @450 kg
ha-1 and sulphur @40 kg ha-1 recorded
maximum Si, P and S content and uptake by
rice in loamy sand soil under rice – wheat
cropping sequence.
632
Int.J.Curr.Microbiol.App.Sci (2019) 8(4): 625-634
F.A. (1975). The effect of silicon on
lodging of rice in presence of added
nitrogen. Plant and Soil, 43, 691-695.
Inanaga, S., Higues, Y. and Naoya, C. (2002).
Effect of silicon application on
reproductive growth of rice plant. Soil
Science and Plant Nutrition, 48, 341347.
Islam, A. and Saha, R.C. (1969). Effect of
silicon on the chemical composition of
rice plant. Plant and Soil,30(3), 446 457.
Islam, R., Hossain, M. S. A., Howladar, A. S.,
Islam, A. R. and Haq, S.M.I. (1987).
Effect of S on rice under flooded
conduction. International Journal of
Tropical Agriculture, 5 (2), 93-101.
Jawahar, S. and Vaiyapuri, V. (2010). Effect
of sulphur and silicon fertilization on
growth and yield of rice. International
Journal of Current Research Vol. 9,
pp.036-038,
Korndorfer, G.H., Snyder, G.H., Ulloa, M.
and Datnoff, L.E. (2001). Calibration
of soil and plant silicon for rice
production. Journal of Plant Nutrition,
24, 1071-1084.
Ma, J. F. (2004). Role of silicon in enhancing
the resistance of plants to biotic
abiotic stresses. Soil Science and Plant
Nutrition, 50, 11–18
Ma, J.F. and Takahashi, E. (1990). Effect of
silicate on phosphate availability of
rice in a P deficient soil. Plant and
Soil, 133, 151-155.
Ma, J.F. and Takahashi, E. (2002). Soil,
fertilizer, and plant silicon research in
Japan. Elsevier Science, Amsterdam,
The Netherlands.
Ma, J.F. and Yamaji, N. (2006). Silicon
uptake and accumulation in higher
plants. Trends in Plant Science, 11,
392-397.
Malidareh,
G.A.,
Kashani,
A.,
Nourrnohammadi, H.R., Mobasser.
and Atavi, V. (2009). Effect of silicon
application and nitrogen rates on N
and Si content and yield of rice (Oryza
sativa L.) in two water systems in
north of Iran. World Applied Sciences
Journal, 6(6), 719-727.
Mandata, S., Singh, R. P., Singh, B and
Singh, M. (1994). Influence of S
application of N. P and S content of
plant and soil. Crop Res., Hisar. 7 (1),
8-12.
Muneshwar Singh., V.P.Singh and K.Sammi
Reddy. 2001. Effect of integrated use
of fertilizer nitrogen and farmyard
manure or green manure on
transformations of N, K and S and
productivity of ricewheat system in
Vertisol. J. Indian Soc. Soil Sci., 49:
430-434.
Osuna F.J., Canizalez, S.K., Dana, D. and
Bonman, J.M. (1991). Nitrogen form
and silicon nutrition effects on
resistance to blast disease of rice.
Plant and Soil, 135, 223-231.
Owino, C. and Gascho, G. J. (2004). Effect of
Silicon on Low pH on Soil
Phosphorus Sorption and Uptake and
Growth of Maize. Communications in
Soil Science and Plant Analysis, 35,
15-16.
Rahman, M. N., Islam, M. B., Sayem, S. M.,
Rahman, M. A. and Masud, M. M.
(2007). Effect of different rates of
sulphur on the yield and yield
attributes of rice in old brahmaputra
floodplain soil. Journal of Soil and
Nature, 1 (1), 22-26.
Sauer, D. and Burghardt, W. (2000).
Chemical process in soils on artificial
materials:
silicate
dissolution,
occurrence of amorphous silica and
zeolites. In Procedings of the First
International Conference on Soils of
Urban, Industrial, Traffic and Mining
areas, 12-18 July 2000. 339-346.
Shivay, Y.S. and Dinesh, K. (2009).
Importance and management of
633
Int.J.Curr.Microbiol.App.Sci (2019) 8(4): 625-634
silicon deficiency in rice. Indian
Farming, 34-36.
Singh, K.K., Singh, S., Ragevendra, S.,
Yogeshvar, S. and Singh, C.S. (2006).
Response of Nitrogen and silicon
levels on growth, yield attribute and
nutrient uptake of rice (Oryza sativa
L.). Oryza, 43, 220-223.
Subramanian, S. and Gopalaswamy, A.
(1991). Effect of moisture, organic
matter, phosphate and silicate on
availability on silicon and phosphorus
in rice soils. Journal of Indian Society
of Soil Science,39, 99-103.
Sumida, H. (1992). Effect of nitrogen
nutrition on silicon uptake by rice
plant. Japanese Journal of Soil
Science and Plant Nutrition, 63, 633638.
Tandon, H. L. S. and Tiwari, K. N. (2007).
Fertiliser use in Indian Agriculture-An
eventful half century. Better Crops, 1
(1), 3 -5.
Tiwari, K.N., Vandana, N. and Pathak, A. N.
(1983). Effect of sulphur fertilization
on yield response and sulphur and
nitrogen composition of rice grown in
the soils of Kanpur district. Indian
Journal of Agricultural Sciences, 53,
812-819.
Tiwari, R. J. (1994). Response of gypsum on
morphophysiochemical properties of
cotton cultivars under salt affected
vertisols of Madhya Pradesh. Crop
Research, 7, 197-200.
Vaiyapuri,
V.
and
M.V.
Sriramachandrasekharan,
(2001).
Integrated use of green manure and
sulphur on nutrient uptake and rice
yield. J. Ecobiol., 13(3): 223-227.
Wang, L., Chen, Q., Cao, W., Wu, X., Li, M.
and Zhang, F. (2001). Silicon induced
cadmium tolerance of rice (Oryza
sativa L.) seedlings. Pp 380-381. In:
Datnoff, L.E., Snyder, G.H. and
Korndorfer, G.H. (eds.) Silicon in
Agriculture, Elsevier Science B.V.
Wani, M. A., Refique, M. M. and Talib, A.
R.(2000). Effect of different levels of
sulphur orn quality of rice. Advances
in plant Sciences, 13(1), 55-57.
Wong You Cheong, Y., Heitz, A. and
Dellville, J. (1973). The effect of
silicon on sugar cane growth in pure
nutrient solution. Journal of the
Science of Food and Agriculture, 24,
113-119.
Zhu, H. J. (1985). Rice soil. Agricultural
Publishing Press.
How to cite this article:
Vimal N. Patel, K.C. Patel and Chaudhary, K.V. 2019. Direct Effect of Silicon and Sulphur on
Nutrient Content and Uptake of Rice Crop under Rice-Wheat Cropping Sequence.
Int.J.Curr.Microbiol.App.Sci. 8(04): 625-634. doi: />
634


![Effect of different nitrogen levels and plant geometry on yield and nutrient uptake by brown top millet [Brachiaria ramosa (L.)]](https://media.store123doc.com/images/document/2020_01/14/medium_oyn1578935731.jpg)
