Genetic diversity of chilli (Capsicum annuum L.) genotypes
Bạn đang xem bản rút gọn của tài liệu. Xem và tải ngay bản đầy đủ của tài liệu tại đây (348.43 KB, 9 trang )
Int.J.Curr.Microbiol.App.Sci (2019) 8(4): 1820-1828
International Journal of Current Microbiology and Applied Sciences
ISSN: 2319-7706 Volume 8 Number 04 (2019)
Journal homepage:
Original Research Article
/>
Genetic Diversity of Chilli (Capsicum annuum L.) Genotypes
Paramjeet Singh Negi* and Akhilesh Sharma
Department of Vegetable Science and Floriculture, CSK Himachal Pradesh Krishi
Vishvavidyalaya, Palampur, 176062, India
*Corresponding author
ABSTRACT
Keywords
Chilli, Genetic
divergence,
Dendrogram,
Genetic mean
Article Info
s
Accepted:
15 March 2019
Available Online:
10 April 2019
The experimental material comprised of 27 advance breeding lines and six varieties
including ‘Surajmukhi’ as standard in randomized complete block design with three
replications during summer- rainy season 2017. Genetic diversity studies grouped 33 chilli
genotypes into six clusters. Maximum genotypes were placed in cluster I (16 genotypes)
followed by cluster II (7 genotypes). Highest intra-cluster distance was observed for
cluster IV followed by cluster II while maximum inter-cluster distance was observed
between cluster V and VI followed by IV and V. Cluster V was observed to be the most
important with maximum cluster means for most of the valuable traits. Total red ripe fruits
per plant contributed maximum towards total genetic divergence followed by oleoresin
content and marketable red ripe fruits per plant. Based on genetic divergence studies, best
performing genotypes from cluster V, I, II, VI and III offer promise for their direct use as
varieties and as potential parents in future breeding programmes to isolate transgressive
segregants.
Introduction
Chilli or hot pepper (Capsicum annuum var.
annuum L.), belongs to the family Solanaceae
and is one of the common and remunerative
cash crops grown for its green and dry red
fruits especially as spice in Indian
subcontinent. The alkaloid capsaicin present
in placenta of chiili fruit responsible for its
pungency has diverse prophylactic and
therapeutic uses in Allopathic and Ayurvedic
medicine (Sumathy and Mathew, 1984). India
has immense potential to grow and export
different types of chillies required by various
markets around the world. Indian chilli
exports nowadays, is facing severe
competition in the international market from
other chilli growing countries along with high
domestic. Chilli production has also suffered
a lot due to non-availability of suitable
cultivars, biotic and abiotic stresses and
extensive cultivation of one or two specific
which has resulted in plethora of disease
infestation. Thus, there is a pressing demand
to develop high yielding varieties or hybrids
with good quality attributes to enhance the
productivity.
D2 statistic is a potent tool for estimating
genetic diversity among different genotypes
and to identify the parents for hybridization to
obtain desirable recombinants. Evaluation of
1820
Int.J.Curr.Microbiol.App.Sci (2019) 8(4): 1820-1828
genetic diversity is important to know the
source of genes for a particular trait within the
available germplasm (Tomooka, 1991). The
assessment of genetic divergence helps in
reducing the number of breeding lines from
the large germplasm. Also, the progenies
derived from diverse parents are expected to
show a broad spectrum of genetic variability
and provide better scope to isolate superior
recombinants. Selection of genotypes from
divergent clusters and components having
more than one positive trait for hybridization
programme may lead to improvement in yield
(Singh et al., 2017).
Materials and Methods
The investigation was conducted at the
Experimental Farm of Department of
Vegetable
Science
and
Floriculture,
Chaudhary Sarwan Kumar Himachal Pradesh
Krishi Vishvavidyalaya, Palampur (1,290.8 m
above mean sea level with 320 6′ N latitude
and 760 3′ E longitude) during summer- rainy
season 2017. The soil is classified as
Alfisolstypic Hapludalf clay having a pH of
5.7. The experimental material comprising of
33 genotypes was sown on 14th March 2017
and the seedlings were ready for transplanting
in about eight weeks after seed sowing. The
experiment was laid out in randomized
complete block design with three replications.
Each genotype was planted in two rows of
length 2.25 m consisting of ten plants in each
replication with inter and intra row spacing of
45 cm × 45 cm, respectively. The
observations were recorded on five
competitive plants taken at random each for
fresh and dry chilli separately in each entry
over the replications for the traits namely,
days to flowering, days to first harvest,
pedicel length, fruit length, fruit girth, fruit
width, leaf length, leaf width, plant height,
primary
branches/plant,
secondary
branches/plant, average green fruit weight,
marketable green fruits/plant, marketable
green fruit yield/plant, harvest duration,
average red ripe fruit weight, marketable red
ripe fruits/plant, non- marketable red ripe
fruits/plant, total red ripe fruits/plant, per cent
marketable red ripe fruits/plant, red ripe fruit
yield/plant, average dry fruit weight, dry fruit
yield/plant, ascorbic acid, oleoresin and
capsaicin content. Using D2 values, different
genotypes were grouped into various clusters
following Tocher’s method as suggested by
Rao (1952).
Results and Discussion
Genetic diversity of germplasm determines
their potential for improved efficiency and
thereby utilizing diverse genetic material in
breeding programme which may eventually
result in enhanced crop production. Amongst
the various tools to assess genetic diversity,
D2 statistic is a powerful tool for estimating
genetic diversity and to identify the parents
for hybridization to obtain desirable
recombinants since diverse parents lead to
high heterosis (Khodadadi et al., 2011).
Inclusion of diverse parents in hybridization
program provides an opportunity to combine
desirable genes and hence, resulted in
isolation of superior lines with requisite traits
(Ceolin et al., 2007). Cluster analysis is the
most suitable approach in identifying
variability in germplasm, lessen the number
of breeding lines by eliminating duplicates
from large germplasm and thereby, suggests
appropriate parents to be involved in
conventional breeding (Eivazi et al., 2007).
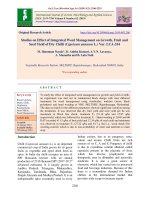
With Euclidean cluster analysis, 33 genotypes
of chilli were grouped into six clusters (Fig. 1,
Table 1). Among them, cluster I, II, IV, V and
VI were polygenotypic whereas cluster III
and VI were monogenotypic containing
genotypes namely, DPCH-29-1 and DPCH28-1 respectively. Different clustering
patterns in chilli were also reported by earlier
workers viz., Bijalwan et al., (2018) and
1821
Int.J.Curr.Microbiol.App.Sci (2019) 8(4): 1820-1828
Janaki et al., (2015) in their respective
studies. Cluster I comprised of maximum 16
genotypes viz., ‘DPCH 38-2’, ‘DPCH 38-2-2’,
‘DPCH 38-1-1’, ‘DPCH 32-1-1’, ‘DPCH 57’,
‘Surajmukhi’, ‘DPCH 26-1-1’, ‘DPCH 14-1’,
‘ DPCH 40’, ‘DPCH 27’, ‘DPCH 33-1’,
‘DPCH-31’, ‘2016/-CHIVAR-6’, ‘DPCH21’,’ 2016/CHIVAR-5’ and ‘DPCH-13-1’
followed by cluster II with seven genotypes
viz., ‘DPCH-35’, ‘DPCH 39-2’, ‘DPCH-10’,
‘DPCH-36’, ‘DPCH-17-2’, ‘DPCH-41’ and
‘2016/ CHIVAR-1’ and that of cluster IV
with six (‘2016/CHIVAR-4’, ‘DPCH 32-2’,
‘2016/CHIVAR-3’, ‘DPCH 6-2’, ‘DPCH-22’
and ‘DPCH 12-1’) and cluster V with two
genotypes (‘DPCH-9’ and ‘DPCH 32-2-1’).
Different research workers namely, Dutonde
et al., (2008), Dutta and Jana (2010) and Pujar
et al., (2017) also found maximum genotypes
in cluster-I.
The intra-cluster distance varies from 0 to
214.93 with the highest in cluster IV followed
by 176.83 in cluster II, 153.35 in cluster I and
139.83 in cluster V while monogynotypic
cluster had intra-cluster distance with zero
value. The inter-cluster distance ranged from
242.78 to 3462.64 (Table 2). The highest
inter-cluster genetic divergence was recorded
between clusters V and VI followed by IV
and V and III and V. This clearly indicates
that the genotypes included in the clusters
with high inter-cluster distance showed
sufficient genetic diversity and selection of
parents from these diverse clusters would be
useful in hybridization programme for
improving yield and other desirable
horticultural traits. The crosses involving the
diverse genotypes would be expected to
manifest maximum heterosis and are more
likely to evolve desirable recombinants in
segregating generations. The minimum intercluster distance was observed between
genotypes of cluster I and III which can be
used for backcross breeding programmes. The
genotypes of cluster I and II and that of III
and IV also showed minimum inter-cluster
distance. The low inter-cluster distance
between these cluster pairs suggested close
proximity of genotypes grouped in these
clusters with respect to their genetic
constitution. The genotypes grouped into the
same cluster presumably diverge very little
from one another and crossing of genotypes
belonging to the same cluster is not expected
to yield desirable segregants. Based on intercluster distance, the earlier workers namely,
Mishra et al., (2001), Srinivas et al., (2013)
and Janaki et al., (2015) have also suggested
selection of parents from diverse clusters for
utilization in hybridization programme to
obtain desirable transgressive segregants.
The composition of cluster means of chilli
genotypes for different characters showed
considerable differences among the clusters
for each trait (Table 3). Cluster V was
observed to be the most important with
maximum cluster means for most of the
valuable
traits
namely,
secondary
branches/plant, marketable green fruits/plant,
marketable green fruit yield/plant, marketable
red ripe fruits/plant, total red ripe fruits/plant,
red ripe fruit yield/plant and dry fruit
yield/plant along with short harvest duration.
In addition, it also showed desirable means
for majority of the fruit and plant growth
traits namely, pedicel length, fruit length, fruit
girth, fruit width, plant height, average
green/dry fruit weight, ascorbic acid and
capsaicin content.
Similarly, Cluster III showed maximum
means for fruit girth, fruit width, leaf length,
leaf width, primary branches/plant, harvest
duration, average dry fruit weight and
capsaicin content besides having desirable
short pedicel length and longest harvest
duration. On the other hand, cluster VI
revealed desirable means for early flowering
and fruit harvesting, longest harvest duration
and oleoresin content. Cluster II contained the
1822
Int.J.Curr.Microbiol.App.Sci (2019) 8(4): 1820-1828
genotypes with maximum mean values for
pedicel and fruit length, plant height, average
green/ red ripe fruit weight and ascorbic acid
while it showed minimum mean for nonmarketable red ripe fruits per plant. Cluster I
revealed maximum mean value for per cent
marketable red ripe fruits/plant. In contrary,
cluster
IV
in
general,
exhibited
minimum/undesirable mean for majority of
the traits including late flowering and first
harvest and maximum non- marketable red
ripe fruits/plant. It has been well established
that more the genetically diverse parents used
in hybridization programme, greater will be
the chances of obtaining high heterotic
hybrids and broad spectrum variability in
segregating generations. Hence, different
clusters of genotypes on the basis of means
revealed divergence for different characters
and can be utilized as indicators for selecting
diverse parents for specific trait in
hybridization programmes (Farhad 2010;
Janaki et al., 2015; Bijalwan et al., 2018).
Table.1 Distribution of chilli genotypes among different clusters on the basis of Mahalanobis
D2-analysis
Clusters
I
Number of
genotypes
16
II
7
III
IV
1
6
V
VI
2
1
Genotypes
DPCH 38-2, DPCH 38-2-2, DPCH 38-1-1, DPCH 32-1-1, DPCH
57P, Surajmukhi, DPCH 26-1-1, DPCH 14-1P, DPCH 40, DPCH
27, DPCH 33-1, 22 DPCH 31, 2016/ CHIVAR 6, DPCH 21,
2016/ CHIVAR-5 and DPCH 13-1
DPCH-35, DPCH 39-2, DPCH-10, DPCH-36, DPCH-17-2
DPCH-41 and 2016/ CHIVAR-1
DPCH-29-1
2016/ CHIVAR-4, DPCH-32-2, 2016/CHIVAR-3, DPCH 6-2,
DPCH-22 and DPCH-12-1
DPCH-9 and DPCH 32-2-1
DPCH 28-1
Table.2 Average intra and inter-cluster values of D2 and √D2 among clusters
Clusters
I
153.35
(12.38)
II
III
II
246.45
(15.70)
176.83
(13.30)
III
242.78
(15.58)
438.22
(20.93)
0.00
(0.00)
IV
V
VI
Bold values are intra-cluster distance
Data in parenthesis are √D2value
1823
IV
306.62
(17.51)
489.68
(22.13)
263.12
(16.22)
214.93
(14.66)
V
1087.81
(32.98)
1104.22
(33.23)
1575.44
(39.69)
1692.65
(41.14)
139.83
(11.82)
VI
996.88
(31.57)
932.15
(30.53)
866.70
(29.45)
1005.29
(31.71)
3462.64
(58.84)
0.00
(0.00)
Int.J.Curr.Microbiol.App.Sci (2019) 8(4): 1820-1828
Table.3 Cluster means for different traits of chilli genotypes distributed in six clusters
Traits
Days to
flowering
Days to first
harvest
Pedicel length
(cm)
Fruit length
(cm)
Fruit girth
(cm)
Fruit width
(cm)
Leaf length
(cm)
Leaf width
(cm)
Primary
branches/plant
Secondary
branches/plant
Plant height
(cm)
Average green
fruit weight (g)
Marketable
green
fruits/plant
Marketable
green fruit
yield/plant (g)
Harvest
duration
Average red
ripe fruit
weight (g)
Marketable
red ripe
fruits/plant
Red ripe fruit
yield/plant (g)
Nonmarketable red
ripe fruit/plant
Total red ripe
fruits/plant (g)
Per cent
marketable red
ripe fruits/plant
Average dry
fruit weight (g)
Dry fruit
yield/plant (g)
Ascorbic acid
(mg/100g)
Capsaicin
content (%)
Oleoresin
content (ASTA
units)
I
38.25
II
36.57*
III
36.67
IV
39.39**
V
38.33
VI
36.67
62.58
62.29
60.67
64.78**
64.00
58.67*
Mean
37.65
Maximum
39.39
Minimum
36.57
62.17
64.78
58.67
3.1
3.71**
2.79*
3.67
3.05
3.65
3.33
3.71
2.79
7.09
8.99**
5.41*
7.09
8.01
7.5
7.35
8.99
5.41
3.5
3.75
3.99**
3.14*
3.37
3.72
3.58
3.99
3.14
1.03
1.04
1.10**
0.93*
1.04
1.03
1.03
1.10
0.93
8.16
8.43
9.17**
7.54*
8.07
8.56
8.32
9.17
7.54
3.67
3.59
3.97**
3.19*
3.79
3.68
3.65
3.97
3.19
5.08
4.20*
6.40**
5.19
4.77
5.73
5.23
6.40
4.20
14.95
13.95
10.53*
14.84
16.13**
16.13**
14.42
16.13
10.53
55.41
69.6**
52.27*
59.79
62.1
60.80
60.00
69.6
52.27
2.8
3.37**
2.79
77.86
80.55
73.1
219.08
271.31
204.25
57.27
58.19
3.23
4.55**
60.00**
3.50
2.52*
2.88
3.2
2.93
3.37
2.52
59.31*
118.16**
100.51
84.92
118.16
59.31
151.6*
339.65**
320.92
251.14
339.65
57.44
53.50*
60.00**
57.73
3.91
3.76
3.62
4.55
2.74
2.74*
60
151.6
53.5
36.98
31.66
25.76*
27.98
42.47**
38.57
33.90
42.47
25.76
117.33
139.93
90.00
74.80*
165.71**
145.06
122.14
165.71
74.8
1.60
1.60
1.86
1.30
36.17
44.99
27.84
93.22
97.02
87.08
0.58
0.69
0.39
1.39
1.30*
38.11
33.76
97.02**
93.28
0.50
0.66
16.61
18.91
55.50
56.25**
1.85
1.88
52.69
48.97
1.85
27.84*
92.56
0.69**
1.86**
1.59
31.70
44.99**
87.08*
94.42
40.63
94.94
0.54
0.67
16.67
14.20*
27.86**
16.94
18.53
27.86
14.20
52.46
43.62*
54.45
48.55
51.81
56.25
43.62
1.62*
2.2
1.92
2.01
2.57
1.62
39.09*
76.26**
58.64
76.26
39.09
2.57**
75.17
59.66
*Minimum; **Maximum
1824
0.39*
Int.J.Curr.Microbiol.App.Sci (2019) 8(4): 1820-1828
Table.4 Relative contribution (%) of individual trait to the genetic divergence among chilli
genotypes
Contribution %
Times Ranked 1st
1 Days to flowering
0.00 %
0
2 Days to first harvest
0.00 %
0
3 Pedicel length (cm)
0.00 %
0
4 Fruit length (cm)
0.95 %
5
5 Fruit girth (cm)
0.00 %
0
6 Fruit width (cm)
0.00 %
0
7 Leaf length (cm)
8.33 %
44
8 Leaf width (cm)
0.38 %
2
9 Primary branches/plant
0.00 %
0
10 Secondary branches/plant
0.00 %
0
11 Plant height (cm)
0.57 %
3
12 Average green fruit weight (g)
0.00 %
0
13 Marketable green fruits/plant
6.82 %
36
14 Marketable green fruit yield/plant (g)
0.00 %
0
15 Harvest duration
0.00 %
0
16 Average red ripe fruit weight (g)
10.80 %
57
17 Marketable red ripe fruits/plant
17.42 %
92
18 Red ripe fruit yield/plant (g)
0.57 %
3
19 Non-marketable red ripe fruit/plant
0.19 %
1
20 Total red ripe fruits/plant (g)
18.56 %
98
21 Per cent marketable red ripe
fruits/plant
0.57 %
3
22 Average dry fruit weight (g)
2.27 %
12
23 Dry fruit yield/plant (g)
0.95 %
5
24 Ascorbic acid (mg/100g)
7.95 %
42
25 Capsaicin content (%)
5.87 %
31
26 Oleoresin content (ASTA units)
17.80 %
94
Source
1825
Int.J.Curr.Microbiol.App.Sci (2019) 8(4): 1820-1828
Fig.1 Dendrogram showing grouping of thirty three chilli genotypes based on D2 statistics using
Tocher’s method
It is worth mentioning that in calculating
cluster mean, the superiority of a particular
genotype with respect to a given character
could get diluted by other genotypes that are
grouped in the same cluster but are inferior or
intermediate for the character in question.
Hence, apart from selecting genotypes from
the clusters which have higher inter-cluster
distance for hybridization, one can also think
of selecting parents based on the extent of
divergence with respect to a character of
interest. The relative per cent contribution of
individual trait to the genetic divergence
among chilli genotypes was presented in
Table 4. The maximum contribution towards
the genetic divergence was exhibited by total
red ripe fruits/ plant (18.56%) followed by
oleoresin content (17.80%), marketable red
1826
Int.J.Curr.Microbiol.App.Sci (2019) 8(4): 1820-1828
ripe fruits/plant (17.42%), average red ripe
fruit weight (10.80%), leaf length (8.33%),
ascorbic acid (7.95%), marketable green
fruits/plant (6.82%), capsaicin content
(5.87%) and average dry fruit weight (2.27%).
The remaining traits contributed with nil to
very low to the total divergence among chilli
genotypes.
Selection of genotypes as superior and diverse
parents for hybridization programme should
be based on diverse clusters. Accordingly,
best performing genotypes viz., ‘DPCH-9’and
‘DPCH-32-2-1’ from cluster V, ‘DPCH-40’,’
DPCH-21’, ‘DPCH-31’, ‘DPCH-38-1-1’,
‘DPCH-38-2’ and ‘DPCH-27’ from cluster I,
‘DPCH-35’, ‘DPCH-39-2’, ‘DPCH-36’ and
‘DPCH-17-2’ from cluster II, ‘DPCH-28-1’
from cluster VI and ‘DPCH-29-1’ from
cluster III offer promise for their direct use as
varieties and as potential parents in future
breeding programmes to isolate transgressive
segregants. The genetically divergent
genotypes may be used as mapping
populations to detect diversity at molecular
level and also to identify molecular markers
linked to desirable traits for marker assisted
selection (MAS).
References
Bijalwan, P., Singh, M. and Naidu, M. 2018.
Assessment of genetic divergence in
chilli
(Capsicum
annuum
L.)
genotypes. Int. J. Curr. Microbiol.
App. Sci., 7: 2319-7706.
Ceolin, A.C.G., Vidigal, M.C.G., Filho,
P.S.V., Kvitschal, M.V., Gonela, A.
and Scapim, C.A. 2007. Genetic
divergence of the common bean
(Phaseolus vulgaris L.) group Carioca
using morpho–agronomic traits by
multivariate analysis. Heriditas, 144:
1–9.
Datta,
S.
and
Jana,
J.C.
2010.
Genetic variability, heritability and
correlation in chilli genotypes under
Terai zone of West Bengal. SAARC J.
Agric., 8: 33-45.
Dutonde, S.N., Bhalekar, M.N., Patil, B.T.,
Kshirsagar, D.B. and Dhumal, S.S.
2008. Genetic diversity in chilli
(Capsicum annuum L.). Agric. Sci.
Digest, 28: 45-47.
Eivazi, A.R., Naghavi, M.R., Hajheidari, M.,
Pirseyedi, S.M., Ghaffari, M.R.,
Mohammadi, S.A., Majidi, I.,
Salekdeh, G.H. and Mardi, M. 2007.
Assessing wheat (Triticum aestivum
L.) genetic diversity using quality
traits, amplified fragment length
polymorphisms, simple sequence
repeats and proteome analysis. Ann.
Appl. Biol., 152: 81–91.
Farhad, M., Hasanuzzaman, M., Biswas,
B.K., Arifuzzaman, M. and Islam,
M.M. 2010. Genetic divergence in
chilli
(Capsicum
annuum
L.).
Bangladesh J. Sci. Res., 3: 1045-1051.
Janaki, M., Naidu, L.N., Venkataraman, C.
and Rao, M.P. 2015. Assessment of
genetic variability, heritability and
genetic advance for quantitative traits
in chilli (Capsicum annuum L). The
Bioscan, 10: 729-733.
Khodadadi, M., Hossein, F.M. and Miransari,
M. 2011. Genetic diversity of wheat
(Triticum aestivum L.) genotypes
based on cluster and principal
component analyses for breeding
strategies. Aust. J. Crop Sci., 5: 17-24.
Mishra. A., Sahu, G.S. and Mishra, P.K.
2001. Variability in fruit characters of
chilli (Capsicum annuum L.). Orissa J.
Hortic., 29: 107-109.
Pujar, U.U., Shantappa, T., Jagadeesha, R.C.,
Gasti, V.D. and Sandhyarani, N. 2017.
Analysis of genetic divergence in
chilli
(Capsicum
annuum
L.)
genotypes. Int. J.Pure Appl. Biosci., 5:
503-508.
Rao, C.R. 1952. Advanced Statistical
1827
Int.J.Curr.Microbiol.App.Sci (2019) 8(4): 1820-1828
Methods in Biometrical Research.
John Wiley and Sons Inc. New York
Edinburgh.
Singh, P., Jain, P.K. and Sharma, A. 2017.
Genetic variability, heritability and
genetic advance in chilli (Capsicum
annuum L.) genotypes. Int. J. Curr.
Microbiol. App. Sci., 6: 2704-2709.
Srinivas, B., Thomas, B. and Sreenivas, G.
2013. Genetic divergence for yield
and its components traits in chilli
(Capsicum frutesence L.). Int. J. Sci.
Res.
Sumathy, K.M.A. and Mathew, A.G. 1984.
Chilli processing. Indian Cocoa,
Arecanut and Spices J., 7: 112-113.
Tomooka, N.1991.Genetic diversity and
landraces differentiation of mungbean
(Vigna radiate L.) Wilczek and
evaluation of its wild relatives (The
subgenus Ceratotropics) as breeding
materials. Tech. Bull. Trop. Res.
Centre, Japan No. 28. Ministry of
Agriculture, Forestry and Fisheries.
Japan. P.1.
How to cite this article:
Paramjeet Singh Negi and Akhilesh Sharma. 2019. Genetic Diversity of Chilli (Capsicum
annuum L.) Genotypes. Int.J.Curr.Microbiol.App.Sci. 8(04): 1820-1828.
doi: />
1828