Effect of preservatives and temperature on microbial and physico-chemical attributes of minimally processed pineapple
Bạn đang xem bản rút gọn của tài liệu. Xem và tải ngay bản đầy đủ của tài liệu tại đây (441.23 KB, 13 trang )
Int.J.Curr.Microbiol.App.Sci (2019) 8(2): 541-553
International Journal of Current Microbiology and Applied Sciences
ISSN: 2319-7706 Volume 8 Number 02 (2019)
Journal homepage:
Original Research Article
/>
Effect of Preservatives and Temperature on Microbial and
Physico-Chemical Attributes of Minimally Processed Pineapple
K.P. Sudheer*, K.B. Sankalpa and S. Saranya
Department of Agricultural Engineering, College of Horticulture, Kerala Agricultural
University, Thrissur-680656, India
*Corresponding author
ABSTRACT
Keywords
Minimal
processing,
Pineapple,
preservatives,
storage condition
and shelf life
Article Info
Accepted:
07 January 2019
Available Online:
10 February 2019
Minimally processed fruits are one of the major growing segments in food retail markets.
However minimal processing leads to limited shelf-life due to excessive tissue softening
and cut surface browning. Pineapple (cv. Mauritius) tidbits were treated with various
preservatives of different combination and stored in ambient and refrigerated storage
condition. It was evident from the result that, as the storage period increases the colour
values of L*, a* and b* were decreased irrespective of treatments. Reduction in colour
values was due to development of translucent appearance of the fruit flesh, which changed
from a yellow-white opaque colour to a translucent yellow colour. A better firmness was
maintained in refrigerated storage condition in combination of calcium chlorideand citric
acid treated sample. The decreasing trend was observed in pH value of treated samples
compared to control sample. Vitamin C content was better retained in the presence of
calcium chloride at refrigeration condition. Best samples were selected based on better
retention of physic-chemical attributes, and selected sample was microbially safe up to
twelve days of refrigerated storage condition.
greatest hurdle to commercial marketing is
their limited shelf-life, which is due to
excessive tissue softening and cut surface
browning. Contact of enzymes and substrates
in cut fruits lead to biochemical changes such
as enzymatic browning, off-flavour and
texture breakdown which reduce product
quality and shelf-life (Manolopoulou and
Varzakas, 2011). Minimal processing may
increase microbial spoilage of fruit through
transfer of skin microflora to fruit flesh where
microorganisms can grow rapidly upon
exposure to nutrient laden juices. Therefore it
need an integrated approach, where raw
Introduction
Minimal processing is defined as the
handling, preparation, packaging and
distribution of agricultural commodities in a
fresh-like state. Minimal processing may
include processes such as dicing, trimming,
washing, cutting, grating, shredding, pulling
the leaves off, etc. and packing and storing in
polymeric films. This kind of plant food is
named fresh-cut or ready-to-eat food
(O’connor-shaw et al., 1994). Minimally
processed fruits are one of the major growing
segments in food retail markets. However, the
541
Int.J.Curr.Microbiol.App.Sci (2019) 8(2): 541-553
material handling, processing packaging and
distribution must be properly considered to
make shelf life extension.
the shelf life of pineapple. Therefore in
present study different preservatives and
storage conditions were analysed for their
ability to improve the shelf life of fresh cut
pineapple fruit.
Various approaches are now applied to arrest
the enzymatic browning which mainly include
chemicals
inhibitors
and
modified
atmospheric packaging. Chemicals of
different groups like reducing agent,
inorganic salts and chelating agents exhibits
various modes of action. Various chemical
inhibitors
are
antimicrobials
(sodium
metabisulphite, calcium lactate, citric acid),
antibrowning agents (ascorbic acid, acetyl
cysteine, potassium sorbate, citric acid,
carboxylic acid, 4-hexylsorcino, oxalic acid)
and firming agents (calcium lactate, calcium
chloride, calcium propionate, calcium
ascorbate) (Siddiqui et al., 2011).
Materials and Methods
Pineapple was washed in tap water and
treated with 120 ppm of sodium hypochlorite
for surface decontamination. Whole pineapple
fruit was immersed in water containing 120
ppm sodium hypochlorite for 15 min.
Solution was drained and pineapple was
peeled and cut into pieces of one centimeter
thickness (Siddiqui et al., 2011).
Chemical preservative pretreatment was used
in fresh cut pineapple fruits for controlling
decay, reducing browning and retaining the
firmness. In initial stage pineapple pieces
were treated with individual chemical and
based on the visual observation, four chemical
preservatives were selected for further
studies. Eight combinations of four chemical
preservatives were selected for minimal
processing of pineapple (Table 1). The
pineapple pieces were dipped in different
combination of preservatives for a period of
10 min, after which they were drained out
from solution, packed in 200 gauge LDPE
packaging material and stored at both ambient
and refrigerated storage condition.
Pineapple is a popular fruit from tropical and
subtropical regions, available throughout the
year and widely consumed around the world.
India is the sixth largest producer of
pineapples in the world. Pineapple (Ananas
comosus) is a non-climacteric fruit
appreciated for its flavor, juiciness, texture,
vitamin C and fiber content. However, slicing
leads to an increase in the metabolic process
and results in significant changes in their
textural, color and flavour properties (Benitez
et al., 2012).
The combined effect of hurdle technology
with chemical preservatives and optimum
storage condition might ensure the quality and
safety of minimally processed pineapple until
the consumption. Controlling product
temperature during refrigerated storage is of
critical importance, an optimum storage
condition maintains the visual quality of fresh
cut pineapple and reduces their respiration
rate, tissue softening and microbial spoilage
(Benitez et al., 2012). As per the available
literature, choice of preservatives and
temperature of storage critically influenced
Quality parameters viz., firmness, colour, pH
and vitamin C content were evaluated at three
days interval. Based on these properties best
treatment combination was selected and
analyzed for gas composition and microbial
population.
Firmness
Instrumental texture analysis of the minimally
processed fruit was measured in three days
interval by using Texture analyzer (Model:
542
Int.J.Curr.Microbiol.App.Sci (2019) 8(2): 541-553
TA.XT2)
by
conditions/setting.
the
following
test
gram sample was weighed and it was
extracted with 20 ml of distilled water, then
the electrode of the pH meter was dipped in
the sample under test. All the readings were
taken in triplicate.
Sample was placed on heavy duty platform
and probe was lowered down to press the
sample and corresponding force deformation
curve was plotted. Firmness or hardness is the
most important quality parameter for fruits
and vegetables. Firmness which indicates the
force required by the probe to crush the fruit
piece was obtained at y axis corresponding to
highest peak in the graph. Each sample was
tested with three replicates and values were
used in the data analysis (Wu et al., 2012).
Decay factor
Decay factor of minimally processed all the
fruit samples were determined by one to five
scale score card.
Head space gas analysis
Head space gas analysis was done at regular
intervals, with the help of a needle inserted
through a rubber septum on the packaging
materials. The needle was connected to a
CO2/O2 gas analyzer (PBI Dansensor
Checkmate, Denmark), to measure the gas
composition of O2 and CO2 in volumetric
fraction (Iqbal et al., 2008).
Colour
Colour of pineapple contributes more to the
assessment of quality by the consumer than
any other single factor. The colour was
measured using CIELAB scale at 10°
observer and D65 illuminant (Bierhals et al.,
2011) in Colour flex meter (Hunter
Associates Laboratory, Inc., model: 65/10).
Microbial analysis
The colour values in terms of L*, a* and b*
were recorded and the total colour change
(ΔE)from the fresh samples was calculated
using the following equation.
E =
Changes in the microbial population of freshcut pineapple wasstudied by total plate count
at two days of interval.
Statistical analysis
( L L0 ) 2 (a a0 ) 2 (b b0 ) 2
All the experiments in the study were
conducted in triplicate and mean values were
reported. Factorial completely randomised
design (FCRD) was used to analyse the data.
After
proper
analysis,
data
were
accommodated in the tables as per the needs
of objectives for interpretation of results.
Statistical significance of the terms in the
regression equation was examined by analysis
of variance (ANOVA) for each response. The
p-values were used as a tool to check the
significance of each of the coefficients,
which, in turn were necessary to understand
the pattern of the mutual interactions between
the test variables.
The subscript “0” in the equation represents
the colour value of fresh sample.
Vitamin C (mg.100g-1)
Vitamin C content was estimated by
volumetric method. The amount of ascorbic
acid present in the sample was calculated as
per the procedure described by Sadashivam
and Manickam (1992).
pH
The pH of minimally processed samples was
measured by using digital pH meter. Ten
543
Int.J.Curr.Microbiol.App.Sci (2019) 8(2): 541-553
combination on 3rd day and the highest a*
value of 8.39 was recorded in T7 treatment. In
most of the treatments a* value decreased
with storage period as compare to fresh
sample. In case of T7 treatment there was a
slight increase in a* value on 3rd day but
gradually decreased with further storage
period. In case of ambient storage condition
there was decrease in a* value as compare to
fresh sample. The highest reduction was
observed for T3 treatment on 3rd day (Table
3). The reduction of a* value indicated a
reduced yellow colour in most of the
treatments during the storage period.
Results and Discussion
All the quality parameters were evaluated at
two days interval for selecting the best
combination.Fresh colour values of fresh
pineapple samples were 77.06, 7.05 and 47.46
for L*, a* and b*, respectively.
Effect of chemical preservatives and
storage period on colour value of pineapple
L* values of minimally processed pineapple
The L*values of preservative treated
refrigerated stored pineapple ranged from
77.52 to 59.85 at different storage period
(Table 3). The highest L* value was recorded
in sodium benzoate and citric acid treated
samples, while lower value was in CaCl2 and
citric acid treated samples. As the storage
period increased, L* value decreased
irrespective of treatments. The L*values of
ambient stored pineapple ranged from 75.27
to 58.31. It was revealed that, the highest L*
value was recorded at combination of sodium
chloride, sodium benzoate and citric acid
treated sample, lower value was observed for
control samples. It is also evidenced from the
table 3, except NaCl treated samples, the L*
value decreased with storage period. The
highest reduction in L* value was observed in
control samples and lowest reduction noted
with SA+CA treated and NaCl treated sample.
It was evident that, treatment combination,
storage condition and storage period had
significant effect on L* value of cut pineapple
pieces. The variation in L* value was due to
the development of translucency, rather than
tissue browning. Similar results were reported
by Montero-Calderon et al., (2008) for cut
pineapple pieces stored in different packaging
materials and Marrero and Kader (2006) for
modified atmospheric storage pineapple.
b* value of minimally processed pineapple
The b* value of treated pineapple sample
ranged from 57.78 to 10.05 over the storage
period. It is clear from table 3, the b* value of
minimally processed pineapple increased
initially and a drastic reduction was observed
on further increase in storage period (after 3rd
day). Similar trend was observed in ambient
storage condition with a maximum b* value
of 57.38 in T1 treatment and minimum of
13.77 in control sample. This indicated the
changes in translucent appearance of the fruit
flesh, which changed from a yellow-white
opaque colour to a translucent yellow colour.
It was clear that, changes in colour parameters
of all the samples were due to translucency
development rather than tissue browning.
Similar trend was reported by Latifah et al.,
(1999) and Montero-Calderon et al., (2008)
for cut pineapple pieces.
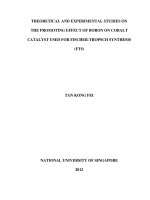
Colour deviation (ΔE)
processed pineapple
of
minimally
Colour deviation was determined during the
storage period in both refrigerated and
ambient storage condition. In refrigerated
storage condition minimum colour deviation
was observed as 31.79 in T7 treatment on 9th
day and maximum deviation observed was
40.47 in control sample on 9th day of
a* values of minimally processed pineapple
In refrigerated condition lowest a* value of 0.225 was observed for treatment T3
544
Int.J.Curr.Microbiol.App.Sci (2019) 8(2): 541-553
refrigerated storage (Fig. 1). In ambient
condition, the lowest ΔE value of 25.80 was
observed in T7 treatment on 3rd day and
highest ΔE value of 38.65 was observed in
control sample on 6th day of ambient storage
condition. ΔE value of all the samples
increased with storage period irrespective of
storage condition and treatment. The highest
deviation was observed in control samples at
both storage conditions. It indicated that
preservative treatment and refrigerated
storage reduced the colour change during the
storage. Statistical analysis indicated that, all
the pretreatment, storage condition and
storage period had significant effect in ΔE
value (p<0.0001).
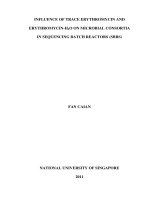
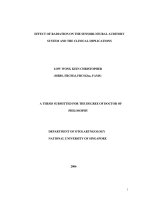
Vitamin C content of minimally processed
pineapple
Vitamin C content under refrigerated
condition
varied
from
4.07
to
20.41 mg.100g-1, under ambient storage
condition it varied from 4.93 to 17.01
mg.100g-1. The highest vitamin C content was
recorded in T1 treatment (both under
refrigerated and ambient condition) and the
lowest was in control samples (ambient
storage).
It is clear from Figure 2 that the vitamin C
concentration decreased drastically as the
storage period increased in both storage
condition. Similar trend was reported by
Latifah et al., (1999) for cut pineapple pieces
and El-Ishaq and Obirinakem (2015) for
pineapple juice. As compared to control
sample, all the samples had the highest
vitamin C content due to presence of CaCl2,
SB and CA. These anti browning and anti
microbial agents help to retain the vitamin C
content in treated samples. But NaCl treated
sample did not show much retention of
vitamin C content, which might be due to the
absence of firming agent. In absence of
firming agent, there was juice leakage that
resulted in reduced vitamin C content.
Statistical analysis also indicated that,
preservatives, storage condition and storage
life had significant (p<0.0001) effect on
vitamin C concentration.
Firmness of minimally processed pineapple
The initial value of firmness for fresh
pineapple was 9.96N. Firmness of pineapple
during storage ranged from 9.85 to 4.30N and
4.35 to 2.00 N, under refrigerated and
ambient condition, respectively. It is clear
from table 4 that firmness value decreased
during the storage period. The highest
firmness value was observed in sample
treated with CaCl2 and CAat refrigerated
storage condition on 9th day of storage.
However the lowest value observed for
samples pre-treated with NaCl. In case of
ambient storage, T2 had highest firmness and
control sample had the lowest firmness at the
end of 6th day of storage. The rapid loss of
firmness was related to degradation of pectin,
losses in visual appearance, deterioration and
browning of pineapple slices. Reported values
were in line with the studies of MonteroCalderon et al., (2008) for minimally
processed pineapple pieces. It can also be
observed from the table 4, that the
CaCl2treated samples maintained a better
firmness compared to the other pre-treated
samples. Similar trendwas reported by
Gonzalez-Aguilar et al., (2004) for cut
pineapple pieces.
pH of minimally processed pineapple
Preservative treatment and storage period had
no significant effect on pH value. The pH
value of preservative treated sliced pineapple
samples showed decreased pH when
compared to control samples. During storage,
pH value decreased in initial days and later it
increased. Results were in agreement with the
results of Bartolome et al., (1996) and Latifah
et al., (1999) for various variety of pineapple.
545
Int.J.Curr.Microbiol.App.Sci (2019) 8(2): 541-553
pH value indicate the acidity, value of pH
decreased with prolonged storage, probably
due to the utilisation of organic acid as a
respiratory substrate via the Krebs
tricarboxylic acid cycle (Latifah et al., 1999).
respiration,
which
resulted
in
correspondingproduction of off-flavors and
off-odorsin ambient storage sample (SolivaFortuny et al., 2004).
The level of CO2increased from 0.03% to
80.90% and 5.10% in ambient and
refrigerated
storage
conditions,
respectively.The very high level of CO2at
ambient storage shows the significant effect
of storage condition on CO2 production.
During the storage period high initial rate of
CO2 was due to wounding and a short-lived
stress response rate at ambient condition
(Finnegan et al., 2013). Similar result was
reported by Marrero and Kader, (2006) in
case of fresh-cut pineapples. At the end of
storage period, O2 concentration increased
and CO2concentration showed a decreasing
trend, due to permeability of packaging
materials.
Decay score
According to the five point score card, visual
observations were made for decay score.
Results of decay score is given in table 6. On
6th day of ambient storage condition all the
samples were spoiled due to juice leakage and
reduced firmness, while, in case of
refrigerated storage conditions, minimally
processed pineapple maintained good colour
and texture till 9th day.
Based on the quality parameters and decay
factor,two best treatmentsie., T1(CaCl2+SB)
and T7 (NaCl+CA+SB)treatment with
refregeration condition were selected for
futher microbial studies and head space gas
analysis.
Microbial analysis for best samples
The microbial analysis was carried out for the
best two samples stored in refrigeration
storage. The microbial analysis for T1and T7
minimally processed pineapple sample was
found to be safe up to twelve days of storage
period (Table 8). Total plate count for
T1treatment was 48×104 cfu/g and T7
treatment was 36×104 cfu/g on 12th day of
refrigerated storage. As per the FSSAI
standard maximum permissible microbial
limits of aerobic colony count for cut or
minimally processed and packed (nonthermally processed) fruit and vegetables was
1×10⁶cfu/gm. In present study microbial limit
was within the limit set by FSSAI. Therefore
sample was said to be microbially safe even
after 9th day of storage.
Effect of storage days on head space gas
concentration
Head space gas concentration of minimally
processed pineapple in ambient and
refrigeration condition was analysed and
results are given in table 7. As the storage
period increased there was significant
decrease in the O2 level and increase in CO2
level.Head space O2 in ambient storage
sample decreases from 20.90% to 0.27% and
to 10.80% in refrigerated conditionon 3rd day
of storage. Slow changes in headspace O2
composition in could be explained by the low
respiration rate of pineapple in refrigeration
storage (Montero-Calderon et al., 2008).
Anaerobic respiration of pineapple in
atmospheric stored sample has created offflavors and off-odours. The partial pressure of
O2when decreased below the fermentation
threshold limit, would lead to anaerobic
In
conclusion,
the
combination
of
preservatives, storage condition and storage
period had significant effect on quality of
minimally processed pineapple. Shelf life of
546
Int.J.Curr.Microbiol.App.Sci (2019) 8(2): 541-553
minimally processed pineapple in ambient
condition was less than three day and in
refrigerated condition it was nine days.
Refrigeration condition with preservative
treatment increased the shelf life to more than
four times than that in ambient condition. The
best preservative combination selected based
on good retention of vitamin C, colour and
texture were T1 (CaCl2+SB) and T7
(NaCl+CA+SB). The best preservative
treatments and refrigeration condition were
also efficient in suppressing growth of
microorganisms and production of CO2
during storage period.
Table.1 Combination of chemical preservatives for minimal processing of pineapple
Sl. No.
Treatment
1
Tc
Control
2
T1
CaCl2+SB
3
T2
CaCl2+CA
4
T3
SB+CA
5
T4
CaCl2+SB+CA
6
T5
NaCl+SB
7
T6
NaCl+CA
8
T7
NaCl+CA+SB
9
T8
NaCl
*CaCl2: 1% Calcium chloride; SB: 0.05% Sodium benzoate; CA: 1% Citric Acid; NaCl: 1% Sodium chloride
Table.2 Test settings of the texture analyzer to determine the firmness
Test mode
Return to start
Pre test speed
2.00 mm/s
Test speed
2.00 mm/s
Post test speed
2.00 mm/s
Distance
10 mm
Trigger force
10 g
Load cell
50 kg
Probe
5 mm cylindrical probe
547
Int.J.Curr.Microbiol.App.Sci (2019) 8(2): 541-553
Table.3 Colour values of minimally processed pineapple
L*
Refrigerated storage Ambient storage
a*
Refrigerated storage Ambient storage
b*
Refrigerated storage
Ambient storage
3rd
Day
6th
Day
9th
Day
3rd Day 6th Day
3rd
Day
6th
Day
9th
Day
3rdDa
y
6th Day
3rd
Day
6th
Day
9th
Day
3rd Day
6th Day
Control
74.57
70.05
60.96
64.25
58.51
1.22
1.18
0.57
2.04
3.30
50.87
13.67
10.90
44.05
13.77
CaCl2+SB
76.74
69.99
65.20
73.98
68.46
3.35
1.10
1.39
3.04
4.41
55.45
17.27
12.07
57.38
20.86
CaCl2+CA
73.29
59.85
60.46
70.27
64.70
3.25
4.60
3.02
6.63
4.09
51.21
22.57
15.03
48.12
20.49
SB+CA
77.03
77.52
71.76
71.74
72.74
-0.23 1.15
1.35
1.98
2.07
41.28
16.69
12.05
29.39
16.58
CaCl2+SB+C
A
71.68
73.88
61.79
68.90
65.13
8.39
2.14
1.75
4.41
4.03
57.78
17.60
11.58
55.22
16.43
NaCl+SB
73.97
74.06
70.53
73.51
70.68
5.53
2.28
1.36
4.07
3.44
53.92
18.30
13.08
45.10
21.83
NaCl+CA
75.85
75.67
61.98
75.07
67.41
4.21
1.72
0.70
7.33
5.93
49.06
20.70
14.73
45.31
22.92
NaCl+CA+SB
72.90
68.47
69.12
75.27
70.65
3.72
4.30
3.24
8.38
6.08
43.07
23.29
16.91
42.93
18.91
NaCl
75.97
75.44
69.79
66.73
68.95
1.46
1.24
0.79
4.86
2.77
49.26
14.39
10.05
48.19
18.87
Treatments
Sd. Dev.:
2.34
Sd. Dev.:
2.25
Sd. Dev.:
0.23
Sd. Dev.:
0.26
Sd. Dev.:
1.08
Sd. Dev.:
1.16
p-value:
<0.0001
p-value:
<0.0001
p-value:
<0.0001
p-value:
<0.0001
p-value:
<0.0001
p-value:
<0.0001
548
Int.J.Curr.Microbiol.App.Sci (2019) 8(2): 541-553
Table.4 Firmness (N) value of minimally processed pineapple
Refrigerated storage
Ambient storage
3rd Day
6th Day
9rd Day
3rd Day
6th Day
Control
4.88
4.58
4.43
2.70
2.00
CaCl2+SB
9.85
7.82
6.22
3.77
3.25
CaCl2+CA
7.42
7.40
7.38
4.35
3.70
SB+CA
5.21
5.03
4.74
3.14
2.75
CaCl2+SB+CA
6.74
5.92
5.38
3.76
3.33
NaCl+SB
6.47
6.05
5.31
3.14
2.73
NaCl+CA
6.59
6.24
5.86
3.56
3.19
NaCl+CA+SB
6.57
6.15
5.70
3.49
3.10
NaCl
4.57
4.43
4.30
2.95
2.61
Sd. Dev.
1.96
Sd. Dev.
1.53
p-value
<0.0001
p-value
<0.0001
Table.5 pH of minimally processed pineapple
Refrigerated storage
Ambient storage
1st Day
3rd Day
6th Day
9th Day
3rd Day
6th Day
Control
4.6
4.40
4.20
4.60
4.48
4.73
CaCl2+SB
4.62
4.16
4.18
4.18
4.16
4.20
CaCl2+CA
4.61
3.97
3.97
3.98
4.05
4.11
SB+CA
4.58
3.96
3.99
3.98
4.07
4.14
CaCl2+SB+CA 4.62
4.26
4.30
4.32
4.32
4.38
NaCl+SB
4.63
4.29
4.32
4.34
4.38
4.41
NaCl+CA
4.57
3.81
3.84
3.87
4.13
4.17
NaCl+CA+SB
4.59
3.86
3.90
3.93
4.34
4.39
NaCl
4.55
3.92
3.95
3.99
4.25
4.28
Sd. Dev.
0.24
Sd. Dev.
0.28
p-value
<0.05
p-value
>0.05
549
Int.J.Curr.Microbiol.App.Sci (2019) 8(2): 541-553
Table.6 Decay score* of minimally processed pineapple
Refrigerated storage
1st Day
Ambient storage
3rd Day
6th Day
9th Day
3rd Day
6th Day
Control
1
2.00
2.00
3.00
3.00
5.00
CaCl2+SB
1
1.00
1.00
1.00
3.00
3.00
CaCl2+CA
1
1.00
1.00
2.00
3.00
4.00
SB+CA
1
1.00
1.00
2.00
3.00
4.00
CaCl2+SB+CA
1
1.00
1.00
2.00
3.00
4.00
NaCl+SB
1
1.00
1.00
2.00
3.00
4.00
NaCl+CA
1
1.00
1.00
2.00
3.00
4.00
NaCl+CA+SB
1
1.00
1.00
1.00
3.00
4.00
NaCl
1
1.00
1.00
2.00
3.00
4.00
*1-No change; 2-Slight colour change but firm texture; 3-No juice leakage but reduced firmness and colour; 4-Juice
leakage, colour changes and loss of firmness;5-Juice leakage, colour changes, loss of firmness and bulged
packaging.
Table.7 Head space gas concentration in selected treatments
Ambient storage
Refrigerated storage
O2
O2
CO2
CO2
O2
O2
CO2
CO2
T1
T7
T1
T7
T1
T7
T1
T7
20.90
0.03
0.03
20.90
20.90
0.03
0.03
Initial 20.90
3
0.27
0.60
50.27
37.83
10.80
15.90
2.80
3.40
5
23.47
32.53
70.47
80.90
7.03
7.37
5.10
4.70
7
8.07
8.83
55.43
72.43
9.87
10.70
4.07
4.77
9
18.40
16.83
2.00
2.47
11
17.53
18.80
2.37
1.83
550
Int.J.Curr.Microbiol.App.Sci (2019) 8(2): 541-553
Table.8 Microbial analysis of selected treatments
Sl. No.
Sample
Total plate count
1st day
45×104
2
3rd day
40×104
3
6th day
38×104
4
9th day
25×104
5
12th day
48×104
1st day
46×104
7
3rd day
39×104
8
6th day
27×104
9
9th day
29×104
10
12th day
36×104
1
6
T1
T7
Fig.1 Effect of minimal processing pretreatment and storage condition on ΔE value of pineapple
551
Int.J.Curr.Microbiol.App.Sci (2019) 8(2): 541-553
Fig.2 Effect of minimally processing pretreatment and storage condition on vitamin C
temperature on the respiration rate and
texture of fresh cut pineapple. J. Food
Eng. 113: 527–533.
Bierhals, V. S., Chiumarelli, M. and
Hubinger, M. D. 2011. Effect of
Cassava Starch Coating on Quality and
Shelf Life of Fresh-Cut Pineapple
(Ananas comosus L. Merril cv
“Perola”). J. Food Sci., 76(1):E62-72.
Finnegana, E., Mahajanb, P.V., O’Connella,
M., Francisa, G.A. and O’Beirne, D.
2013. Modelling respiration in fresh-cut
pineapple and prediction of gas
permeability needs for optimal modified
atmosphere packaging. Postharvest Bio.
Technol. 79: 47–53
Acknowledgement
Present research work is financially assisted
by Indian Council of Agricultural Research
(ICAR) through National Fellow project.
References
Bartolome, A.P., Ruperez, P. and Instituto,
C.F. 1996. Non-Volatile organic acids,
pH and titratable acidity changes in
pineapple fruit slices during frozen
storage. J Sci. Food Agric. 70:475-480.
Benitez, S., Chiumenti, M., Sepulcre, F.,
Achaerandio, I. and Pujola, M. 2012.
Modeling the effect of storage
552
Int.J.Curr.Microbiol.App.Sci (2019) 8(2): 541-553
El-Ishaq, A. and Obirinakem, S. 2015. Effect
of temperature and storage on vitamin C
content in fruits juice. Int. J. Chemi
Biomol. Sci. 1(2):17-21.
Gonzalez-Aguilar, G.A., Ruiz-Cruz, S., CruzValenzuela, R., Rodriguez-Felix, A. and
Wang, C.Y. 2004. Physiological and
quality changes of fresh-cut pineapple
treated with antibrowning agents. LW.
Technol. 37, 369–376.
Iqbal, T., Rodrigues, F.A.S., Mahajan, P.V.,
Kerry, J.P., Gil, L., Manso, M.C. and
Cunha, L.M. 2008. Effect of Minimal
processing conditions on respiration rate
of carrots. J. Food Sci., 73 (8): E392402.
Latifah, M.N., Abdullah, H., Selamat, M.
Talib, Y. and Rahman, K. M. 1999.
Quality evaluation of minimally
processed pineapple using two packing
systems. J. Trop. Agric. Food Sci.
27(1): 101–107.
Manolopoulou, E. and Varzakas, T. 2011.
Effect of storage conditions on the
sensory quality, colour and texture of
fresh-cut minimally processed cabbage
with the addition of ascorbic acid, citric
acid and calcium chloride. Food Nutr.
Sci. 2: 956-963.
Marreroa, A. and Kader, A.A. 2006. Optimal
temperature and modified atmosphere
for keeping quality of fresh-cut
pineapples. Postharvest Bio. Technol.
39: 163-168.
Montero-Calderon, M., Rojas-Grau, M.A. and
Martin-Belloso, O. 2008. Effect of
packaging conditions on quality and
shelf-life of fresh-cut pineapple (Ananas
comosus). Postharvest Bio. Technol. 50
(3): 182–189.
O’connor-shaw, R.E., Robert, R., Ford, A.L.,
and Nottingham, S.M., 1994. Shelf life
of minimally processes honeydew,
kiwifruit, papaya, pineapple and
cantaloupe. J. Food sci., 59(6):12021206.
Sadashivam, S. and Manickam, A. 1992.
Biochemical methods for agricultural
sciences. Wiley Eastern Ltd., New
Delhi, pp 199-201.
Siddiqui, M. W., Chakraborty, I., AyalaZavala, J. F. and Dhua, R. S. 2011.
Advances in minimal processing of
fruits and vegetables: a review. J.S
cient. Ind. Res.70:823-834.
Soliva-Fortuny, R.C., Alos-Saiz, N., EspachsBarroso, A. and Martín-Belloso, O.
2004. Influence of maturity at
processing on quality attributes of freshcut conference pears. J. Food Sci., 69:
290–294.
Wu, Z., Zhanga, M. and Wang, S. 2012.
Effects of high-pressure argon and
nitrogen treatments on respiration,
browning and antioxidant potential of
minimally processed pineapples during
shelf life. J. Sci. Food Agric., DOI:
10.1002/jsfa.5612.
How to cite this article:
Sudheer, K.P., K.B. Sankalpa and Saranya, S. 2019. Effect of Preservatives and Temperature
on Microbial and Physico-Chemical Attributes of Minimally Processed Pineapple.
Int.J.Curr.Microbiol.App.Sci. 8(02): 541-553. doi: />
553