Phylogenetic diversity analysis of Ralstonia Solanacearum, Pseudomonas Fluorescens and Trichoderma Asperellum isolated from tomato Rhizosphere soil in Karnataka
Bạn đang xem bản rút gọn của tài liệu. Xem và tải ngay bản đầy đủ của tài liệu tại đây (479.02 KB, 8 trang )
Int.J.Curr.Microbiol.App.Sci (2019) 8(3): 381-388
International Journal of Current Microbiology and Applied Sciences
ISSN: 2319-7706 Volume 8 Number 03 (2019)
Journal homepage:
Original Research Article
/>
Phylogenetic Diversity Analysis of Ralstonia solanacearum,
Pseudomonas fluorescens and Trichoderma asperellum Isolated
from Tomato Rhizosphere Soil in Karnataka
K. Soumya1*, K. Narasimha Murthy3, C. Srinivas2 and S.R. Niranjana2
1
Department of Microbiology, Field Marshal K. M. Cariappa College, A Constituent College
of Mangalore University, Madikeri – 571201, Karnataka, India
2
Department of Studies in Biotechnology, University of Mysore, Manasagangotri,
Mysore –570 006, Karnataka, India
3
Department of Microbiology and Biotechnology, Jnanabharathi Campus, Bangalore
University, Bangalore- 560 056, India
*Corresponding author
ABSTRACT
Keywords
Molecular
identification,
phylogenetic tree,
PCR amplification,
R. solanacearum,
P. fluorescens,
T. asperellum
Article Info
Accepted:
04 February 2019
Available Online:
10 March 2019
Phylogenetic implication in bacterial genomics is important to understanding difficulties
such as population history, antimicrobial resistance and transmission dynamics. It has been
claimed that partial genome sequences would clarify phylogenetic relationships between
isolated organisms, but up to now, no sustaining approach has been proposed to use
competently these data. concatenation of sequences of different genes as well as building
of consensus trees only consider the few genes that are shared among all organisms. The
phylogenetic has been plagued by an apparent state of contradiction since the distorting
effects of recombination on phylogeny were discovered more than a decade ago. Total of
100 isolates were isolated wilted tomato plant and rhizosphere soil, amongst ten highly
virulent isolates were selected based on morphological, biochemical characteristics and
pathogenicity studies, as well as 16S rRNA gene sequencing. The rhizosphere soil samples
of healthy tomato plants were used to isolate T. asperellum and P. fluorescens were
identified based on morphological and molecular characterization. Total of fifteen isolates
among them, ten isolates of R. solanacearum, three isolates of Pseudomonas fluorescens
and two isolates of Trichoderma asperellum were isolated from soil samples collected
from different locations in Karnataka. The present work demonstrates for the identification
of R. solanacearum, P. fluorescens and T. asperellum based on molecular methods based
on 16S rRNA sequencing and NCBI BLAST search was performed, multiple sequences
alignment and phylogenetic trees were constructed using CLUSTAL X2 2.1 (Windows
version). The sequences were deposited to NCBI database.
381
Int.J.Curr.Microbiol.App.Sci (2019) 8(3): 381-388
fluorescens and T. asperellum strains (Villa et
al., 2005).
Introduction
A phylogenetic tree is a branching diagram or
"tree" showing the inferred evolutionary
relationships among various biological species
or other entities their phylogeny based upon
resemblances and dissimilarities in their
physical or genetic characteristics. More than
3000 bacterial have been sequenced and
deposited in public databases to date,
including the results of a large scale effort to
choose organisms for genome sequencing
based on their phylogenetic diversity (Wu et
al., 2009). In this method, a tree is assembled
by seeing the phenotypic resemblances of the
species without trying to understand the
evolutionary pathways of the species. Since a
tree assembled by this method does not
essentially reflect evolutionary relationships
but somewhat is designed to signify
phenotypic similarity, trees assembled via this
technique are called phenograms. A
phylogenetic tree based on such information is
often named a dendrogram (a branching order
that may or may not be the correct
phylogeny).
Phylogenetic analysis has been to determine
the diversity of strains rapidly and to a degree
of accurateness. Traditionally, phylogenies
were incidental and taxonomy established
based
on
studies
of
morphology.
Recently molecular phylogenetics has been
used to allow better elucidation of the
evolutionary connection of the species by
analyzing their DNA/protein sequences, for
example
their ribosomal
DNA.
The
phylogenetic relationships among numerous of
the sequenced genomes are unclear. When
new species are described, it is commonplace
to use a phylogeny of the gene for the small
subunit ribosomal RNA to place them in a
phylogenetic context. Within the past few
years, many studies have been reported using
DNA sequence-based phylogenetic analyses to
determine the diversity of R. solanacearum, P.
Characterization of microbial species using
classical methods is not as exact as the
genotyping methods. Genotypic techniques
involve the amplification of a phylogenetically
informative target, such as the small subunits
(18S) rRNA gene and 16S rRNA are
necessary for the survival of all cells and the
genes encoding the rRNA are highly
conserved in the fungi and bacteria
respectively. The sequences of rRNA and
proteins comprising the ribosome are
extremely conserved during evolution as they
require complex inter and intra molecular
interactions to maintain the protein synthesis
(Sacchi et al., 2002; Woese et al., 1977).
The 16S rRNA gene is a valued tool for this
determination because its sequence has
regions of both low and high conservation and
since there are now hundreds of thousands of
sequences available from both cultured and
environmental organisms. However, it is
likely that there will be differences between a
phylogenetic trees inferred using the 16S
rRNA gene versus other phylogenetic marker
genes (Eisen, 1995). Ribosomal RNA is often
considered the best tool to infer prokaryotic
phylogeny because it is supposed to be one of
the best constrained and ubiquitous molecules
available, and thus the most informative.
However, several examples of likely lateral
transfers concern molecules that are
constrained and ubiquitous (Brown et al.,
2001).
This is generally the case when linking
phylogenies reconstructed from different
genes, since they may have diverse amounts of
phylogenetic signal, evolutionary histories or
rates of evolution, and because issues like
convergence, long-branch attraction, and
hidden paralogy can lead to incorrect tree
inference (Maddison, 1997). The aim of this to
382
Int.J.Curr.Microbiol.App.Sci (2019) 8(3): 381-388
study the phylogenetic technique to examine
the diversity of selected bacterial and fungal
species in rhizosphere soil samples of tomato.
Materials and Methods
Isolation
and
identification
Solanacearum and P. fluorescens
of
R.
Virulent strains of R. solanacearum were
isolated from wilted tomato plants, identified
by morphological biochemical and molecular
characteristics and whose pathogenicity on
tomato plants had been confirmed in previous
work was used in this study. R. solanacearum
was isolated on Triphenyl tetrazolium chloride
(TZC) medium (Narasimha Murthy et al.,
2012) P. fluorescens were isolated from
rhizosphere soil of tomato fields and carried
out by serial dilution technique using King’s B
medium (King et al., 1954). The colonies were
examined for morphological characteristics
such as shape, size, structure and
pigmentation. Presence of fluorescence in UV
light was used to select putative P. fluorescens
colonies.
Molecular
Identification
of
Solanacearum and P. fluorescens
R.
Pure culture of ten isolates of R.
solanacearum, three isolates of Pseudomonas
fluorescens were used to molecular
identification.
Extraction of genomic DNA from R.
solanacearum and P. fluorescens
Both Bacterial cultures (1.5 ml) were
centrifuged at 8000rpm for 5 min and
supernatant was discarded. The pellet was
resuspended in 600μl of TE buffer and
vortexed for 1 min. To this, 30μl of 10% SDS
and 3μl o f a 2 0 mg/ml solution of proteinase
K are added, mixed and incubated for 1hour at
37°C. After incubation, 100μl of 5 M NaC1 is
added and mixed, followed by the addition of
80μl of aCTAB/NaC1 solution (0.7 M NaC1,
10% CTAB). This solution was incubated
at65°C for 10 min. following incubation, an
equal volume of chloroform: isoamylalcohol
(24:1) was added and mixed. Centrifugation
for 5 min was carried out and the aqueous
layer avoiding the interface was transferred to
a new tube. To this, equal volume of PCI
(Phenol: Chloroform: Isoamyl alcohol)
solution was added and mixed well. The tubes
were then centrifuged at 14,000 rpm for 5 min
and the supernatant was transferred to a new
tube. The first extraction with chloroform:
isoamyl alcohol alone was repeated again and
to these 0.6 volumes of isopropanol was added
and mixed gently to completely precipitate the
DNA. The tubes are then centrifuged and
isopropanol was decanted. The DNA pellets
were then washed with 70% ethanol for three
times and dried at room temperature. The
DNA was then resuspended in 50-100μl of TE
buffer and stored at 4°C.
Quantification of DNA with absorption
The reliable amounts of DNA to fingerprint
assays were obtained by further dilution of
DNA concentration in TE buffer pH 7.6 at 1:7
(v/v) and measuring the absorbance at 260 nm
and 280 nm wave lengths in a
spectrophotometer. The purity of the DNA
was checked by Gel Electrophoresis with 1%
Agarose in TBE Buffer (Ausubel et al., 1997).
PCR amplification
The genomic DNA of R. solanacearum
isolates were PCR amplified usinguniversal
primers;
Forward
primer
8F
(AGAGTTTGATCCTGGCTCAG)
and
Reverse Primer 806R (GGACTACCA
GGGTATCTAAT)
corresponding
to
16SrRNA (Seal et al., 1993). Master mixture
was prepared with PCR reagents and
distributed into 200μl PCR tubes. The reaction
383
Int.J.Curr.Microbiol.App.Sci (2019) 8(3): 381-388
volume of 50μl/ reaction was maintained
which comprised of 1μlof each primers
(20pmol Concentration), 5μl of 10X PCR
buffer, a mixture of dNTP’s each at a
concentration of 200 mM (1μl), sterile double
distilled water (40.75μl), 2.5 U of Taq
polymerase (0.25μl) and template DNA (1μl).
Reaction mixture without the Template DNA
was maintained as negative control to check
contamination. Amplification reaction was
performed in thermal cycler (Eppendorf A.G
Barkhausenweg, Germany) for 35 cycles. The
purity of the PCR product was checked by
Electophoresis with 2% agarose in TBE
Buffer.
Reactions
Temperature & Cycles
Incubation Time
Initial
Denaturation
Denaturation
94oC for 4 min
Annealing
53°C for 1 min
Extension
72°C for 1min
Final
extension
72°C for 10 min
94°C for 40s
35
cycles
Rhizosphere soil samples of healthy tomato
plants were collected and isolated using the
soil dilution plate method on potato dextrose
agar (PDA) medium. Morphological and
microscopic examination in slide culture the
shape, size, arrangement and development of
conidiophores
or
phialides
provided
identification of T. asperellum. The Two T.
asperellum isolates were sent to National
Fungal Culture Collection of India (NFCCI),
Agharkar Research Institute, Pune and further
characterized by molecular identification
based on the ITS region sequencing.
the pellets were washed with TE Buffer (1 M
Tris-HCl, 0.5 M EDTA pH 8.0), 500 µl of
lysis buffer and 10 µl of 10% SDS were
added. This mixture was maintained for 10
minutes at room temperature and then at 60ºC
for 10 minutes. Phenol: chloroform: Isoamyl
alcohol (250µl) was added in the ratio of
25:24:1 homogenized and centrifuged at
13000 rpm. One milliliter of ethanol was
added to the supernatant and centrifuged.
DNA was precipitated using 1ml of 80%
ethanol and centrifuged at 13000 rpm. Ethanol
was completely dried at 40°C. The extracted
DNA was resuspended in 30 µl of deionized
water and stored at 4°C.
Molecular identification of T. asperellum
PCR amplification
DNA extraction and PCR amplification
from T. asperellum
The PCR reactions were carried out using
ITS1-F (5-CTT GGT CAT TTA GAG GAA
GTA A-3) as forward primer and ITS-4 (5TCC TCC GCT TAT TGA TAT GC-3) as
reverse primer respectively. The ITS regions
of the rDNA repeat from the 3’end of the 18s
Isolation and identification of T. asperellum
Trichoderma asperellum were cultivated in
flasks containing malt extract broth, at 26ºC
and 170 rpm. The culture was centrifuged and
384
Int.J.Curr.Microbiol.App.Sci (2019) 8(3): 381-388
and the 5’end of the 28s gene were amplified
using the two primers, ITS A and D which
were synthesized on the basis of conserved
regions of the eukaryotic rRNA gene (White
et al., 1990).
The Thermocycler programme included
following steps, Initial denaturation (94 ºC for
4 min), 30 cycles of repeated denaturation (94
ºC for 1 min), annealing (40 ºC -increasing 0.5
ºC per second during 30s) and extension (72
ºC for 1 min) (Anderson and Cairney, 2004).
Phylogenetic analysis
The PCR products were sequenced by Sanger
dideoxy method by genome bio technologies,
Pune. Nucleotide BLAST was performed to
all the ten obtained sequences in NCBI using
blastn suite and top ten hit sequences with
more than 99% similarity to the query
sequences were selected for further
phylogenetic analysis. Multiple sequence
alignments of all these sequences were
performed by using CLUSTAL-X software
version 2.1. Phylogenetic tree was constructed
using the same software and the alignment
data was analyzed by neighbor-joining (NJ)
method. The sequences were deposited in
NCBI GenBank. Nucleotides BLAST search
was performed at the NCBI GenBank library
(Altschul et al., 1997) and compared with
each other using the CLUSTALW.
The rRNA amplicons were sequenced, aligned
using the Bio Edit Sequence Alignment Editor
to obtain the consensus sequence, and
compared to each other using CLUSTALW.
The sequences were deposited in the GenBank
database.
Phylogenetic tree was constructed using the
same software and the alignment data was
analyzed by neighbor-joining (NJ) method.
The sequences were deposited in NCBI
GenBank.
Results and Discussion
Molecular confirmation of R. solanacearum
by 16S ribosomal RNA
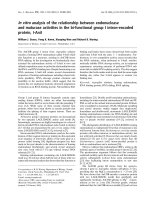
The identification of the R. solanacearum
isolates was confirmed by molecular analysis.
The BLAST analysis of the sequences showed
98% to 99% identity to several isolates of R.
solanacearum strains. Among 100 isolates, ten
highly virulent strains were characterized and
were identified as R. solanacearum RS1, RS2,
RS3, RS4, RS5 RS6, RS7, RS8, RS9 and
RS10 with Gen bank Accession numbers
KF924739,
KF924740,
KF924741,
KF924742,
KF924743,
KF924744,
KF924745,
KF924746,
KF924747and
KF924748 respectively (Figure 1).
Molecular confirmation of Pseudomonas
fluorescens by 16S ribosomal RNA
The identification rhizobacterial isolates were
subjected for molecular identification. The
16S ribosomal RNA gene was sequenced and
aligned using the BLAST algorithm. The
sequence showed 98% to 99% similarity with
several isolates of P. fluorescens. All three
isolates (Pf3, Pf5, Pf8) were identified as P.
fluorescens (Accession Numbers: KF679344,
KF679345 and KF679346). Phylogenetic
relationships of P. fluorescens isolates inferred
by neighbor-Joining (NJ) bootstrap tree
analysis of 16s rRNA sequences. Sequences
used for this comparison were obtained from
GenBank (Figure 2).
Molecular identification of T. asperellum by
ITS sequencing
The amplified PCR nucleotides of T.
asperellum
were
sequenced
and
a
phylogenetic tree was constructed. BLAST
search of the ITS sequence and multiple
alignment of sequences showed 98%
similarity with Trichoderma strains which
385
Int.J.Curr.Microbiol.App.Sci (2019) 8(3): 381-388
confirms T4 and T8 as T. asperellum (Figure
3). The sequences were deposited in NCBI
GenBank,
with
Accession
Numbers:
(T4): KF679342 and (T8): KF679343. The
greater number of samples would have to be
analyzed to statistically determine that PCR is
a significantly more sensitive technique for the
detection of bacterial and fungal in soil
samples than culture analysis. Molecular
phylogeny approaches allow, from a given set
of aligned sequences, the suggestion of
phylogenetic trees (inferred trees) which aim
at reconstructing the past of consecutive
deviation which took place during the
evolution, amongst the measured sequences
and their common ancestor.
Fig.1 Phylogenetic relationships of R. solanacearum isolates inferred by neighbor-Joining (NJ)
bootstrap tree analysis of 16s rRNA sequences. Sequences used for this comparison was obtained
from GenBank
Fig.2 Phylogenetic relationships of P. fluorescens (Pf3, Pf5 and Pf8) isolates inferred by
neighbor-Joining (NJ) bootstrap tree analysis of 16s rRNA sequences. Sequences used for this
comparison was obtained from GenBank
386
Int.J.Curr.Microbiol.App.Sci (2019) 8(3): 381-388
Fig.3 Phylogenetic relationships of Trichoderma asperellum (T4 and T8) isolates inferred by
Neighbor-Joining (NJ) bootstrap tree analysis of ITS sequences. Sequences used for this
comparison was obtained from GenBank
Reconstruction of phylogenetic trees is a
statistical problem and a reconstructed tree is an
estimate of a true tree with a given topology and
given branch length. The correctness of this
assessment should be statistically established. In
preparation, phylogenetic analyses typically
generate phylogenetic trees with correct parts
and imprecise parts. Approaches using
comparisons of base or codon arrangement have
revealed that up to 17% of the genes of bacterial
genomes maybe of alien origin, with only a few
of them recognizable as mobile elements
(Ochman et al., 2000). However, it was recently
shown that other mechanisms may explain
biases in nucleotide composition and that
unforeseen sequence patterns may not be proofs
of alien origin. Moreover, the several intrinsic
approaches tend to give very diverse
assessments of the pool of laterally transferred
genes (Ragan, 2001).
10 μM), and temperature cycles (45–95.8 °C
and 30–40 cycles) have been employed to
detect or confirm bacteria isolated soil of a PCR
reaction
such
as
deoxyribonucleotide
triphosphates (dNTPs), magnesium (Mg2+) and
buffer solutions have been used in different
concentrations to increase detection limits. A
PCR process may involve the use of one primer
single or multiple primers to detect bacterial
isolates (Adzitey et al., 2013). Comparison of
the partial 16S rDNA sequences of isolates with
GenBank database showed that they belongs ten
isolates of R. solanacearum, three isolates of P.
fluorescens and two isolates of T. asperellum
lineages. Sequences from all isolates were
completely or higher than 99% similar to other
16S rRNA sequences from GenBank database.
The phylogenetic analysis based on the partial
16S rRNA gene sequencing R. solanacearum,
P. fluorescens and T. asperellum (Figure 1-3).
Polymerase chain reaction (PCR) is an in situ
DNA replication process that allows for the
exponential amplification of target DNA in the
presence of synthetic oligonucleotides primers
and a thermostable DNA polymerase. A broad
variety of diverse concentrations or units of
DNA templates (5–25 ng), Taq DNA
polymerase (0.6–1.25 U), primers (0.11–
In conclusion, conservation 16S rRNA region in
the gene sequence could identify all isolates of
isolated from rhizosphere soil samples
successfully. This sequence can serve as a best
molecular chronometer for identification of soil
bacteria and fungi with no previous knowledge.
Conservation is considered to gene a significant
part of cell identification and this study, also,
387
Int.J.Curr.Microbiol.App.Sci (2019) 8(3): 381-388
shows that partial sequencing can provide
statistically
valid
measurements
for
evolutionary distances of both bacterial and
fungal isolates.
Maddison, W. 1997. Gene Trees in Species
Trees. Systematic Biology 46:523–536.
Narasimha Murthy, K., Srinivas, C. 2012. In
vitro screening of bioantagonistic agents
and plant extracts to control bacterial wilt
(R.
solanacearum)
of
tomato
(Lycopersicon esculentum). J. Agri.
Technol. 8(3):999 –1015.
Ochman, H., Lawrence, J.G., Groisman, E.A.
2000. Lateral gene transfer and the nature
of bacterial innovation. Nature. 405: 299–
304.
Ragan, M.A. 2001. On surrogate methods for
detecting lateral gene transfer. FEMS
Microbiol.Lett.201:187–191.
Sacchi, C.T., Whitney, A.M., Reeves, M.W.,
Mayer, L.W., Popovic, T. 2002. Sequence
diversity of Neisseria meningdidis 16S
rRNA genes and use of 16S rRNA gene
sequencing as a molecular subtyping tool.
J Clin Microbiol. 40:4520-4527.
Villa, J.E., Tsuchiya, K., Horita, M., Natural,
M., Opina, N., Hyakumachi, M. 2005.
Phylogenetic relationship of Ralstonia
solanacearum species complex strain
from Asia and other continents based on
16s rRNA, endoglucanase, and hrpB gene
sequences. J. Gen. Plant Pathol. 71:39-46.
Woese, C.R., Fox, G.E. 1977. Phylogenetic
structure of the prokaryotic domain: the
primary kingdoms. Proc. Natl. Acad. Sci.
USA. 74: 5088- 5090.
Wu, D., Hugenholtz, P., Mavromati, K., Pukall,
R., Dalin, E., et al., 2009. A phylogenydriven genomic encyclopaedia of Bacteria
and Archaea. Nature 462:1056–1060.
References
Adzitey, F., Huda, N., Ali, G.R.R. 2013.
Molecular techniques for detecting and
typing of bacteria, advantages and
application to food borne pathogens
isolated from ducks. 3Biotech, 3(2): 97–
107.
Anderson, I.C., Cairney, W.G. 2004. Diversity
and ecology of soil fungal communities:
increased understanding through the
application
of
molecular
techniques. Environ Microbiol. 6: 769779.
Altschul, S. F., Suhai, S. 1997. Theoretical and
computational methods in genome
research. New York, 1-14.
Brown, J.R., Douady, C.J., Italia, M.J.,
Marshall,
W.E.,
Stanhope,
M.J.
2001.Universal trees based on large
combined protein sequence data sets. Nat
Genet. 28:281–285.
Ja, 1995. The RecA protein as a model
molecule for molecular systematic studies
of bacteria: comparison of trees of RecAs
and 16S rRNAs from the same species. J.
Mol. Evol. 41:1105–1123.
King, E.O., Wood, M.K., Raney, D.E. 1954.
Two Simple Media for the Demonstration
of Pyocyanin and Fluorescein. J. Lab.
Clinical Med.44, 301-307.
How to cite this article:
Soumya, K., K. Narasimha Murthy, C. Srinivas and Niranjana, S.R. 2019. Phylogenetic Diversity
Analysis of Ralstonia solanacearum, Pseudomonas fluorescens and Trichoderma asperellum
Isolated from Tomato Rhizosphere Soil in Karnataka. Int.J.Curr.Microbiol.App.Sci. 8(03): 381388. doi: />
388