Molecular characterization and dna fingerprinting of superior jackfruit genotypes from Kerala using SSR markers
Bạn đang xem bản rút gọn của tài liệu. Xem và tải ngay bản đầy đủ của tài liệu tại đây (323.9 KB, 10 trang )
Int.J.Curr.Microbiol.App.Sci (2019) 8(1): 679-688
International Journal of Current Microbiology and Applied Sciences
ISSN: 2319-7706 Volume 8 Number 01 (2019)
Journal homepage:
Original Research Article
/>
Molecular Characterization and DNA Fingerprinting of Superior Jackfruit
Genotypes from Kerala using SSR Markers
P.S. Marjan1, Anu G. Krishnan2* and Anu Cyriac2
1
2
College of Horticulture, Vellanikkara, KAU P.O, Thrissur, Kerala, India
Regional Agricultural Research Station, Kumarakom, Kottayam, Kerala, India
*Corresponding author
ABSTRACT
Keywords
Jackfruit, SSR
markers, DNA
fingerprinting,
Genetic diversity,
Dendrogram
Article Info
Accepted:
07 December 2018
Available Online:
10 January 2019
The Artocarpus heterophyllus Lam commonly known as jackfruit belongs to the family
Moraceae. The Western Ghats of India is believed to be the centre of origin of jackfruit. A
study on Molecular characterization and DNA fingerprinting of promising selections of
jackfruit (Artocarpus heterophyllus Lam.) using SSR markers was carried out at Regional
Agricultural Research Station (R.A.R.S.), Kumarakom and Centre for Plant Biotechnology
and Molecular Biology, College of Horticulture, Vellanikkara, Kerala during the period
2015-2017. The objectives of the study were to characterize jackfruit varieties using SSR
markers and to develop DNA fingerprint with which the variety could be identified and its
fidelity is detected. A total of eight jack genotypes including one KAU released jack
variety (Sindhur), one Cultivar (Muttom varikka) and six superior jackfruit selections
(Veloor varikka-1, Veloor varikka-2, Kavanar varikka-1, Pathamuttom varikka-1,
Pathamuttom Varikka-2 and Chengalam varikka) identified at RARS, Kumarakom were
utilized for the study. DNA extraction was done with CTAB method with slight
modification. A set of 50 SSR primers reported from the related genera were screened for
polymorphism. The PCR products obtained from SSR analysis were separated on 3 percent
high resolution agarose gel and the amplification patterns were observed. Eleven SSR
primers which showed maximum polymorphism were selected for fingerprinting. The
amplification pattern obtained with these primers were scored and depicted to develop
fingerprint for each variety. Most of the amplicons were found to be shared among the
genotypes. However, the pattern of sharing was different and good enough to separate out
most of the varieties. Unique amplicons were observed for Sindhur, Pathamuttom varikka1, Pathamuttom varikka-2 and Chengalam varikka, which can act as specific fingerprint of
these genotypes. Among the SSR primers, MAA145 showed 100% polymorphism. The
PIC value for SSR primers ranged from 0.22 to 0.98 with an average of 0.79 and MI value
varied from 0.66 to 2.7 with an average of 1.18.
Introduction
The jackfruit (Artocarpus heterophyllus Lam.)
is a tetraploid (4n=56) which belongs to the
family Moraceae. It is native to parts of South
and Southeast Asia, and is believed to have
originated in the south western rain forests of
India (Rowe-Dutton, 1985). In Western Ghats
it is found up to 1500m and has tremendous
diversity (Muralidharan et al., 1997). India is
679
Int.J.Curr.Microbiol.App.Sci (2019) 8(1): 679-688
one of the major jackfruit producing country.
Malaysia, Bangladesh, Vietnam, Thailand,
China, Myanmar, Indonesia, Sri Lanka are the
other major jackfruit producers in world.
Jackfruit is the National fruit of Bangladesh
and is also known as “Poor man‟s food”
(Rahman et al., 1995). It is the World‟s largest
edible fruit reaching up to 50 kg in weight and
produces higher yield than any other fruit
crops (Naik, 1949).
In India, Kerala is the largest producer of
jackfruit and it is about 28 lakh tonnes from an
area of 89702 ha. Tamil Nadu, Karnataka,
Maharashtra, Andhra Pradesh, West Bengal,
Assam, Tripura, Bihar and Uttar Pradesh are
other jack growing states (APAARI, 2012).
The knowledge about genetic diversity of jack
is important to identify superior genotypes for
cultivation. In Kerala, such studies have
resulted in the release of a new jack variety
„Sindhur‟ and selection of some superior
genotypes. Regional Agricultural Research
Station (RARS), Kumarakom had conducted
studies on the variability of jack fruit in
Kuttanad region and identified few promising
genotypes (Krishnan et al., 2015). The Central
Seed Committee established under the Seed
Act 1966 insists for DNA fingerprint data for
the varieties released or proposed to be
released.
The specific fingerprint data will serve as a
mark for identifying the varieties and could be
utilized for registration and documentation of
varieties, settling IPR issues and to avoid bio
piracy. There are no reports on the DNA
fingerprinting of different jackfruit cultivars in
Kerala.
The objectives of present study were to
characterize the major jackfruit genotypes
using SSR markers and to develop DNA
fingerprint with which the variety could be
identified and its fidelity can be detected.
Materials and Methods
Plant materials
Eight selected jackfruit genotypes viz., variety
Sindhur, cultivar Muttom varikka and six
superior jack selections (Veloor varikka-1,
Veloor varikka-2, Pathamuttom varikka-1,
Pathamuttom Varikka-2, Chengalam varikka
and Kavanar Varikka) collected from
Kuttanad tract and maintained at RARS,
Kumarakom were used for the study. Tender
emerging leaves were collected from each
genotype early in the morning. After covering
with aluminium foil, the leaves were brought
to the laboratory in ice box. The leaf surface
was washed with sterile water and wiped with
70 percent ethanol and was stored at -80 °C
until use.
DNA extraction
CTAB method developed by Doyle and Doyle
(1987) was used for the extraction of genomic
DNA. CTAB isolation buffer (2X) was
preheated in a 50 ml Oakridge centrifuge tube
to 60°C in a water bath. Fresh leaf tissue (0.2
– 0.5g) is ground with a pinch of polyvinyl
pyrrolidin (PVP), 50 μl of 2-βmercaptoethanol
and liquid nitrogen. The powdered sample was
transferred to 2 ml eppendorf tube containing
1 ml of preheated CTAB solution. The sample
is incubated for 30 minutes at 60°C with
occasional gentle swirling. Equal volume of
chloroform – isoamyl alcohol (24:1) mixture
was added to the tube. It was mixed gently by
inversion and was centrifuged (Eppendorf) at
12000 rpm for 20 min at room temperature.
The content got separated into three distinct
phases. The top aqueous layer was transferred
to a sterile eppendorf tube. After transferring
the aqueous phase into a clean eppendorf tube,
0.6 ml of chilled isopropanol was added. This
was mixed by gentle inversion till the DNA
was precipitated. These tubes were kept at 20°C for half an hour for complete
680
Int.J.Curr.Microbiol.App.Sci (2019) 8(1): 679-688
precipitation. After this, it was centrifuged for
15 minutes at 12,000 rpm at 4°C. The
supernatant was gently poured off. The DNA
pellet was washed with 10-20 µl of wash
buffer with centrifugation at 1000 rpm for 5
min. The supernatant was carefully removed.
It was again washed with 70% ethanol. Again
the tubes were spun for 5 minutes at 1000 rpm
and ethanol was decanted. The remaining
pellet was air dried and RNA contamination
was removed by adding 1µl of 10 mg/l RNase
A to 50 µl of sample DNA. The purified DNA
pellets were dissolved in 50 µl of TE buffer
and stored at -20 °C until use.
(TaKaRa) and 40 ng template DNA. The
amplification was performed in Agilent PCR
machine (Super Cycler 8800) using the
programme; 94°C for 2 min, 35 cycles of
94°C for 30 sec, annealing 50-55°C (varied)
for 30 sec, 72°C for 1 min 50 sec and final
extension of 8 min. After amplification the
PCR products were resolved on 3% high
resolution agarose gel (stained with ethidium
bromide) along with 100 bp DNA ladder. The
gels were documented with Biorad Geldoc EZ
imager.
The quality and quantity of DNA were
examined
by
using
NanodropR
spectrophotometer (ND-1000). The quality
and integrity of DNA were assessed through
Agarose gel electrophoresis (Sambrook et al.,
1989).
The bands were scored by visual observation
for their presence (1) or absence (0) on the gel.
The sizes of bands were detected based on the
ladder size. Genetic variability was estimated
based on this manually scored bands using
NTSYS version 2.1 (Rohlf, 1992) and cluster
analysis was done using Unweighted Pair
Group Method (UPGMA) (Sneath and Sokal,
1973). Fingerprints were developed using the
scored bands of selected primers using
Microsoft office excel. Different colour codes
were provided to the bands of different
genotypes based on their molecular weight,
same colours were provided to the amplicones
of same size. The Polymorphic information
content (PIC) of the markers were calculated
using the formula PICi =1-Σ pi2, Where, pi is
the frequency of ith allele (Milbourne et al.,
(1997). Marker index (MI) of the markers
were calculated using the formula MI = PIC ×
No. of polymorphic bands (Powell et al.,
1996).
SSR primer screening
A set of 50 SSR primers reported from the
related genera, mulberry (Mathithumilan et
al., 2013) and breadfruit (Witherup et al.,
2013; De Bellis et al., 2016) were selected for
the study. Screening was done using bulked
DNA from eight jackfruit genotypes. Out of
the fifty SSR primers eleven primers were
selected for further analysis based on
polymorphism. PCR amplified product of
these primers were resolved on 3 % high
resolution agarose gel along with 100 bp DNA
ladder (Thermo scientific) and scored for
developing fingerprints and molecular
characterization.
Data analysis
Results and Discussion
PCR amplification
The PCR amplifications of DNA with SSR
primers were carried out in 25 µl reaction mix
consisted of 1X Taq buffer with 1.5 mM
MgCl2, 125 µM dNTPs, 0.5 picomoles of each
primers, 0.5 unit Taq DNA polymerase
Fifty SSR primer sets were screened for
polymorphism in eight jack genotypes studied
after bulking the DNA. Eleven SSR primer
sets were selected based on their amplification
pattern for developing fingerprints of eight
jack genotypes. Witherup et al., (2013)
681
Int.J.Curr.Microbiol.App.Sci (2019) 8(1): 679-688
reported 13 SSR markers and De Bellis et al.,
(2016) reported 21 SSR makers in jackfruit.
Six of the selected primers belonged to
mAaCIR series and five belonged to MAA
(Table 1). These primers yielded a total
number of 29 alleles with an average of 2.63
alleles per primer (Table 2). An average of
1.81 polymorphic alleles was produced by
each primer. The percentage of polymorphism
varied from 50 % (mAaCIR 0049, mAaCIR
0078, mAaCIR 0127, mAaCIR 0134,
mAaCIR 0141 and MAA 122) to 100 %
(mAaCIR 0115 and MAA 145). Calculated
SSR PIC value for selected SSR primers were
ranged between 0.22 (MAA 54a) to 0.98
(mAaCIR 0078, mAaCIR 0134, mAaCIR
0141 and MAA 122) with an average of 0.75.
The Marker index for SSR primers varied
between 0.60 (mAaCIR 0115) to 2.7 (MAA
196a) with an average 1.18 (Table 2). This
showed the efficiency of selected primers to
determine the genetic diversity. Mandal et al.,
(2016) conducted discrimination analysis and
obtained that MI was the most efficient
parameter for the identification of most
capable primer. In jackfruit, only a few SSRs
markers were reported.
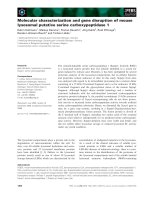
DNA fingerprinting
Distinct polymorphic bands generated for
eight jackfruit genotypes using eleven SSR
primer sets were consolidated and was
depicted in the colour chart. The fingerprint
was generated using polymorphic bands which
were shared among maximum three
genotypes. All the selected SSR primers
yielded at least one useful polymorphic band.
Amplification with 11 SSR primers yielded 28
useful distinct polymorphic bands over eight
jackfruit genotypes (Fig. 1). Molecular size of
these selected bands ranged from 100 bp to
340 bp. Among these, 9 bands were unique,
two were shared by two genotypes and five
were shared by three genotypes. Maximum
number of 6 amplicons were observed in
Pathamuttom varikka-2 and Sindhur, whereas,
the genotypes Veloor varikka-1 and Veloor
varikka-2 had only one useful amplicon. The
primer MAA 105 generated maximum number
of amplicons (7).
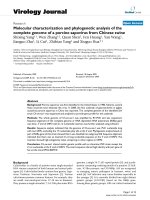
Among these selected primers, seven of them
produced specific bands which can acts as
variety specific DNA fingerprints. Primers
mAaCIR 0078 (at 150 bp) and MAA 122 (at
270 bp) produced unique band in
Pathamuttom varikka-1. Amplification with
mAaCIR 0134 (at 240 bp) and MAA 105 (at
265 bp) yielded unique bands in Pathamuttom
varikka-2. At a length of 230 bp, primer
mAaCIR 0141 poduced a specific band in
Sindhur. In Pathamuttom varikka-2 and
Sindhur unique bands were developed by the
primer MAA 196a at 340 bp and 320 bp
respectively. The primer MAA 145 generated
unique band in Pathamuttom varikka-2 at 287
bp and Chengalam varikka at 280 bp (Fig. 3).
Apart from these unique bands, amplicons
which were shared among maximum of three
varieties were also selected for developing
final SSR fingerprints for each genotypes.
Amplification with mAaCIR 0049 yielded
polymorphic bands in Kavanar varikka-1 and
Muttom varikka at 100 bp. A polymorphic
band (at 175 bp) shared by Pathamuttom
varikka-1, Pathamuttom varikka-2 and
Sindhur, when amplified with the primer
mAaCIR 0115. Polymorphic amplicones at
200 bp generated by the primer mAaCIR 0127
was shared by Kavanar varikka-1, Chengalam
varikka and Muttom varikka. Polymorphic
band at 220 bp obtained by amplification with
the primer MAA 54a was observed in Kavanar
Varikka-1, Muttom varikka and Sindhur. On
amplification with the primer MAA 105,
Kavanar Varikka-1, Muttom varikka and
Sindhur shared a polymorphic band at 290 bp
and Veloor varikka-1, Veloor varikka-2 and
Chengalam varikka shared a band at 270 bp.
682
Int.J.Curr.Microbiol.App.Sci (2019) 8(1): 679-688
Amplification with the primer MAA 196a
developed a polymorphic band at 290 bp in
Pathamuttom varikka-2 and Sindhur. In the
present investigation the genotypes Veloor
varikka -1, Veloor varikka -2 and Kavanar
varikka -1, Muttom varikka could not be
distinguished with unique band in SSR
marker systems. This may be because only 11
SSR primers were used in this study and if
more primers were screened, unique bands
could be brought out for these varieties also.
However the DNA fingerprints developed
were unique for all the other genotypes.
analysis and cultivar fingerprinting in Ficus
carica. De Bellis et al., (2016) developed and
validated 50 SSR markers in breadfruit
(Artocarpus altilis) by next generation
sequencing, which are polymorphic in 39
bread fruit accessions. Similar DNA
fingerprint utilizing SSR markers were
developed in eight cocoa varieties released
from Kerala Agricultural University (Sujith,
2016). Gopalsamy et al., (2012) reported
molecular
marker
(RAPD)
based
fingerprinting to estimate genetic diversity
among five jackfruit accessions at GKVK,
Bangalore. Kanupriya et al., (2011)
characterized 9 guava cultivars using 23
microsatellite markers and developed
molecular barcodes.
Literature on DNA fingerprinting using SSR
markers of jackfruit cultivar was not
available. Baraket et al., (2011) opined that
SSR markers are suitable for diversity
Table.1 List of polymorphic SSR markers amplified in jackfruit genotypes
Sl.
No.
1
Primer
mAaCIR 0049
Annealing
temperature (oC)
53
2
mAaCIR 0078
53
3
mAaCIR 0127
52
4
mAaCIR 0134
55
5
mAaCIR 0141
55
6
MAA 54a
55
7
MAA 105
55
8
MAA 122
55
9
MAA 145
55
10
MAA 196a
55
Nucleotide sequence
F:5’-TACATACAAGCCAACTTCCA-3’
R:5’-CCTTTGTGAGGAAGACCA-3’
F:5’-CTTCAACTATTACTACTGCTGCT-3'
R:5’-CTGTTCAGGTTGGTGCT-3’
F:5’-TGATTCTCTCTTTACAGGCAC-3’
R:5’-GCTCAGGTGCTTACTTGTTC-3’
F:5’-AGCTGCCAATGATCCC-3’
R:5’-ATGTGAAAAGGTTGGATTTG-3’
F:5’-TCAAGCCCCTCACTCAA-3’
R:5’-ATGGCATAGCACAACACAA-3’
F:5’-AACCTCCAAACACTAGGACAAC-3’
R:5’-AGCTACTTCCAAAACGTGACA-3’
F:5’-GTTGGGACACTGTGAACTATTC-3’
R:5’-AAAAGCTAGTGGATTAGATGCA-3’
F:5’-CTGGCCTTCAGTTTTGTCAAC-3’
R:5’-CACCAGGCTTCAAGATGAAA-3’
F:5’-CCAACGCATAGCCAAATC-3’
R:5’-AAATCCCAAACCCAACGT-3’
F:5’-GGAATGTGGTAGATGAAACTCC-3’
R:5’-CGACAAAAAAACAAAGGAAGAC-3’
683
Int.J.Curr.Microbiol.App.Sci (2019) 8(1): 679-688
Table.2 Details of DNA amplification with Selected 11 SSR primers
Sl.
No
SSR
Primer
Total no
of alleles
No of
Polymorphism Polymorphic Maker
polymorphic
(%)
information Index
alleles
content
(MI)
(PIC)
1
mAaCIR
2
1
50
0.94
0.94
2
1
50
0.98
0.98
2
2
100
0.30
0.60
2
1
50
0.86
0.86
2
1
50
0.98
0.98
2
1
50
0.98
0.98
4
3
75
0.22
0.66
4
3
75
0.70
2.1
2
1
50
0.98
0.98
3
3
100
0.40
1.2
4
3
75
0.90
2.7
Total
29
20
725
8.24
12.98
Average
2.63
1.81
65.90
0.75
1.18
0049
mAaCIR
2
0078
mAaCIR
3
0115
mAaCIR
4
0127
mAaCIR
5
0134
mAaCIR
6
0141
MAA
7
54a
MAA
8
105
MAA
9
122
10
MAA
145
11
MAA
196a
684
Int.J.Curr.Microbiol.App.Sci (2019) 8(1): 679-688
Fig.1 DNA fingerprint of six genotypes of jackfruit using SSR markers
Mol.
Size(bp)/
Primer
340
320
Veloor
varikka-1
Veloor
varikka-2
Pathamuttom
vaikka-1
Pathamuttom
varikka-2
Kavanar
varikka-1
Chengalam
varikka
Sindhur
MAA 196a
290
MAA 196a
MAA 105
287
280
270
Muttom
varikka
MAA
105
MAA
196a
MAA
196a
MAA
105
MAA 145
MAA 105
MAA
105
MAA 145
MAA 105
MAA 122
265
240
230
MAA 105
mAa 0134
220
MAA 54a
200
mAa 0127
175
mAa 0115
150
100
mAa 0078
mAa 0127
MAA
54a
mAa
0127
mAa 0115
mAa
0115
mAa 0049
mAa
0049
Colour codes for bands
1
1.
2.
Unique band
Polymorphic band shared between two genotypes
3.
Polymorphic band shared between three genotypes
2
3
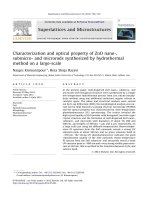
Fig.2 Dendrogram based on similarity coefficient for SSR analysis of jackfruit genotypes
685
mAa
0141
MAA
54a
Int.J.Curr.Microbiol.App.Sci (2019) 8(1): 679-688
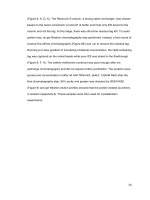
Fig.3 DNA amplification pattern generated with primer MAA 54a
M-Molecular weight marker (100bp), 1- Veloor varikka-1, 2- Veloor varikka-2, 3- Pathamuttom varikka1, 4- Pathamuttom varikka-2, 5- Kavanar varikka-1, 6- Chengalam varikka, 7- Muttom varikka, 8Sindhur
SSR markers. The specific DNA fingerprints
developed for the jack variety Sindhur,
promising selections Pathamuttom varikka-1,
Pathamuttom varikka-2 and Chengalam
varikka could be utilized for varietal
identification and settling IPR issues.
Cluster analysis
Polymorphism generated with SSR primers
for the eight jack genotypes were also used
for constructing dendrogram (Fig. 2). At 0.76
similarity coefficient, the jackfruit genotypes
were clustered into six groups. Cluster I and
III were formed with two members each i.e.,
cluster I contained Veloor varikka-1 and
Veloor varikka-2 and Cluster III included
Kavanar varikka-1 and Muttom varikka.
Other four clusters were formed with only one
member i.e., Cluster II, IV, V and VI with
Pathamuttom varikka-1, Sindhur, Chengalam
varikka
and
Pathamuttom
varikka-2
respectively. Maximum variability observed
was 48 percent for the variety Pathamuttom
varikka-2. Studies on genetic diversity
analysis in jack genotypes using SSR markers
were meager. Shyamalamma et al., (2008)
evaluated genetic diversity among 50 jackfruit
accessions was using 16 AFLP markers.
Cluster analysis of these 50 accessions
formed three major clusters. This information
will be useful for further tree breeding
programmes in jackfruit.
References
APAARI. 2012. Jackfruit Improvement in the
Asia-Pacific Region – A Status Report.
Asia-Pacific
Association
of
Agricultural Research Institutions,
Bangkok, Thailand. 182 p.
Baraket, G., Chatti, K., Saddoud, O.,
Abdelkarim, A.B., Messaoud, M.,
Trifi, M., and Hannachi, A.S.
2011.Comparative assessment of SSR
and AFLP markers for resources in
Tunisia. Plant Mol. Biol. Rep. 29:171184
De Bellis, F., Malapa, R., Kagy, V., Lebegin,
S., Billot, C., and Labouisse, N. P.
2016.
New
development
and
validation of 50 SSR markers in bead
fruit (Artocarpus altilis, moraceae) by
next-generation sequencing. Appl.
Plant Sci. 4 (8): 1-7.
Doyle, J. J. and Doyle, J. L. 1987. A rapid
The present study has revealed the genetic
relationship of eight Jackfruit genotypes using
686
Int.J.Curr.Microbiol.App.Sci (2019) 8(1): 679-688
DNA isolation procedure for small
quantities of fresh leaf tissue.
Phytochem. Bull. 19 (1): 11-15.
Gopalsamy,
J.,
Agnburaj,
J.,
Sundaravadivelan, C., Kuberan, T.,
Kumar, P., Starlin, T., and Mariselvan,
M. 2012. Molecular marker (RAPD)
based fingerprinting on jackfruit to
estimate the genetic diversity. Int. J.
Appl. Biores. 7: 1-7.
Kanupriya., Latha, P. M., Aswath, C., Reddy,
L., Padmakar, B., Vasugi, C., and
Dinesh, M. R. 2011. Cultivar
identification
and
genetic
fingerprinting of guava (Psidium
guajava) using microsatellite markers.
Int. J. Fruit Sci.11 (2): 184-196.
Krishnan, A. G., Jayalakshmi, G., Varghese,
S. G., and Thomas, A. V. 2015a.
Evaluation of jack genotypes in
Kuttanad region of Kerala. In:
Ajithkumar, K.G., Bijukumar, A.,
Sureshkumar, C. (eds.), Proceedings
of National Seminar on JackfruitLivelihood opportunities; 15-16 May;
2015, Aranmula, Pathanamthitta, pp
31-34.
Mandal, R., Nag, S., Tarafdar, J., and Mitra,
S. 2016. A comparison of efficiency
parameters of SSR markers and
genetic
diversity
analysis
in
Amorphophallus
paeoniifolius
(Dennst.) Nicolson. Braz. arch. biol.
technol.
[online].
Available:
[6 June 2017].
Mathithumilan, B., Kadam, N. N., Biradar, J.,
Reddy, S. H., Ankaiah, M.,
Narayanan, M. J., Makarla, U.,
Khurana, P., and Sreeman, S. M.
2013.
Development
and
characterization of microsatellite
markers for Morus spp. and
assessment of their transferability to
other closely related species. BMC
Pant Biol. 13: 194-214.
Milbourne, D., Meyer, R., Bradshaw, J.E.,
Baird, E., Bonar, N., Provan, J.,
Powell, W. and Waugh, R. (1997).
Comparison of PCR-based marker
systems for the analysis of genetic
relationships in cultivated potato. Mol.
Breed,. 3: 127-136.
Muralidharan, V. K., Ganapathy, M. M.,
Velayudhan, K. C., and Amalrai.
1997. Collecting jackfruit germplasm
in western ghats. Indian J. Pl. Gen.
Res. 10: 227-231.
Naik, K.C. 1949. South Indian Fruits and
Their Culture. P. Varadachery & Co.,
Madras, pp. 300-302.
Powell, W., Morgante, M., Andre, C.,
Hanafey, M., Voges, J., Tingey, S.,
and Rafalski, A. 1996. Comparison of
RAPD, RFLP, AFLP and SSR
(microsatellite)
markers
for
germplasm analysis. Mol. Breed. 2:
230-236.
Rahman, A. K. M. M., Huq, E., Mian, A. J.
and Chesson, A. 1995. Microscopic
and chemical changes occurring
during the ripening of two forms of
jackfruit (Artocarpus heterophyllus
L). Food Chem. 52: 405-410.
Rowe-Dutton,
P.
1985.
Artocarpus
heterophyllus- Jackfruit. In: Garner, J.
R. and Chaudhury, S. A. (eds.). The
Propagation of Tropical Fruit Trees.
FAO/CAB, London: 269-290.
Sambrook, J., Fritsch, E. F. and Maniatis, T.
1989.
Molecular
Cloning
A
Laboratory Mannual. Academic press,
New York, USA, 123p.
Shyamalamma, S., Chandra, S. B. C., Hegde,
M., and Naryanswamy, P. 2008.
Evaluation of genetic diversity in
jackfruit (Artocarpus heterophyllus
Lam.) based on amplified fragment
length polymorphism markers. Genet.
Mol. Res. 7(3): 645-656.
Sneath, P. H. and Sokal, R. R. 1973.
Numerical taxonomy: the principles
687
Int.J.Curr.Microbiol.App.Sci (2019) 8(1): 679-688
and
practice
of
numerical
classification.
San
Francisco,
Freeman, 573p.
Sujith, S. S. 2016. DNA fingerprinting of
promising Cocoa (Theobroma cacao
L.) varieties of KAU. M. Sc. (Ag.)
thesis, Kerala Agricultural University,
Thrissur, 85 p.
Witherup, C., Ragone, D., Wiesner-Hanks, T.,
Irish, B., Scheffler, B., Simpson, S.,
Zee, F., Zuberi, M. I., and Zerega, N.
J. C. 2013. Development of
microsatellite loci in Artocarpus altilis
(Moraceae) and cross amplification in
congeneric species. Appl. Plant Sci.
1(7): 1-6.
How to cite this article:
Marjan, P.S., Anu G. Krishnan and Anu Cyriac. 2019. Molecular Characterization and DNA
Fingerprinting of Superior Jackfruit Genotypes from Kerala using SSR Markers.
Int.J.Curr.Microbiol.App.Sci. 8(01): 679-688. doi: />
688