Structural characterization and biochemical analysis of ID2, an inhibitor of DNA binding 1
Bạn đang xem bản rút gọn của tài liệu. Xem và tải ngay bản đầy đủ của tài liệu tại đây (3.57 MB, 30 trang )
STRUCTURAL CHARACTERIZATION AND
BIOCHEMICAL ANALYSIS OF ID2, AN INHIBITOR OF
DNA-BINDING
MARIE VIVIAN WONG TZU YENN
(B.Sc.), University of Melbourne
A THESIS SUBIMTTED
FOR THE DEGREE OF PHILOSOPHY OF
SCIENCE
DEPARTMENT OF BIOLOGICAL SCIENCES
NATIONAL UNIVERSITY OF SINGAPORE
2012
!
i!
ACKNOWLEDGEMENTS
I would like to thank my supervisor Dr Prasanna R. Kolatkar for the opportunity to
work in his lab and for the valuable insight given during the course of this project.
I would like to thank Dr Paaventhan Palasingham and Dr Jeremiah Joseph for
their mentorship and help in the structural determination at various stages.
I am grateful to Dr Robert Robinson and Dr Howard Robinson for their assistance
with X-ray beamtime and data collection.
I am thankful to my parents and sister who are always there when help is needed.
I am also grateful to my husband for his support.
Finally, I would like to acknowledge all the students and lab mates who made life
in the lab a great experience.
!
ii!
TABLE OF CONTENTS
!
TABLE OF CONTENTS ii!
SUMMARY v!
LIST OF TABLES vi!
LIST OF FIGURES vii!
LIST OF SYMBOLS xi!
CHAPTER 1: INTRODUCTION 1!
!"!! #$%&&'&()*(+%&,-(.'$,/0$))1 0.'$,/(2+3435(16)7',8&("""""""""""""""""""""""""""""""""""""""""""""""""""""""""""""""""""""(!!
!"9! +343(&76:-7:6'&(""""""""""""""""""""""""""""""""""""""""""""""""""""""""""""""""""""""""""""""""""""""""""""""""""""""""""""""""""""""""""""""""""""""(;!
!";! <=&(%6'(>6): 1(= (34 3(1 6)7' ,8&("""""""""""""""""""""""""""""""""""""""""""""""""""""""""""""""""""""""""""""""""""""""""""""""""""""""""""(?!
!"@! <=(16)7',8&(,8(A'B '$)1C'87("""""""""""""""""""""""""""""""""""""""""""""""""""""""""""""""""""""""""""""""""""""""""""""""""""""""""""""(!9!
!"D! <=(16)7',8&(%8A (C E)F '8 '&,&(""""""""""""""""""""""""""""""""""""""""""""""""""""""""""""""""""""""""""""""""""""""""""""""""""""""""""""(!@!
!"G! <=(16)7',8&(%8A (8': 6) F' 8'& ,&("""""""""""""""""""""""""""""""""""""""""""""""""""""""""""""""""""""""""""""""""""""""""""""""""""""""""(!@!
!"?! <=&(,8(-%8-'6("""""""""""""""""""""""""""""""""""""""""""""""""""""""""""""""""""""""""""""""""""""""""""""""""""""""""""""""""""""""""""""""""""""""""""(!G!
!"H! I6)1'67,'&(%8A(6)$'&()*(<=9(""""""""""""""""""""""""""""""""""""""""""""""""""""""""""""""""""""""""""""""""""""""""""""""""""""""""""""""(!?!
!"J! K,C(%8A(L-)1'()*(I6)M'-7(""""""""""""""""""""""""""""""""""""""""""""""""""""""""""""""""""""""""""""""""""""""""""""""""""""""""""""""""""(9N!
CHAPTER 2: MATERIALS and METHODS 22!
9"!! #$)8,8F(""""""""""""""""""""""""""""""""""""""""""""""""""""""""""""""""""""""""""""""""""""""""""""""""""""""""""""""""""""""""""""""""""""""""""""""""""""""(99!
9"9! L,7'(A,6'-7'A(C:7%F'8'&,&(""""""""""""""""""""""""""""""""""""""""""""""""""""""""""""""""""""""""""""""""""""""""""""""""""""""""""""""""(9@!
9";! I6)7',8('/16'&&,)8()17,C,O%7,)8("""""""""""""""""""""""""""""""""""""""""""""""""""""""""""""""""""""""""""""""""""""""""""""""""""(9G!
9"@! P%7,B'(16)7',8('/16'&&,)8(""""""""""""""""""""""""""""""""""""""""""""""""""""""""""""""""""""""""""""""""""""""""""""""""""""""""""""""""(9G!
9"D! L'$'8)0Q'7.,)8,8'(2L'0Q'75(&:+&7,7:7'A(16)7',8('/16'&&,)8(""""""""""""""""""""""""""""""""""""""""""""(9?!
9"G! #'$$(3%6B'&7,8F(""""""""""""""""""""""""""""""""""""""""""""""""""""""""""""""""""""""""""""""""""""""""""""""""""""""""""""""""""""""""""""""""""""""(9?!
9"?! I6)7',8(I:6,*,-%7,)8(""""""""""""""""""""""""""""""""""""""""""""""""""""""""""""""""""""""""""""""""""""""""""""""""""""""""""""""""""""""""""""(9H!
9"H! R$'-76)1.)6'7,-(C)+,$,7E(&.,*7(%&&%E(""""""""""""""""""""""""""""""""""""""""""""""""""""""""""""""""""""""""""""""""""""""""""""(9H!
!
iii!
!"#! $%&'()**+,)(+ /"""""""""""""""""""""""""""""""""""""""""""""""""""""""""""""""""""""""""""""""""""""""""""""""""""""""""""""""""""""""""""""""""""""""/!#!
!"01! 23%)&/4)() /5-**65(+ /).4/7%-56''+.8/"""""""""""""""""""""""""""""""""""""""""""""""""""""""""""""""""""""""""""""""""""""""/91!
CHAPTER 3: RESULTS and DISCUSSION 31!
(Expression to X-ray Data Collection) 31!
9"0! $* +.8/).4/:;)**3'5)*6/<%-(6+./=>7%6''+ /""""""""""""""""""""""""""""""""""""""""""""""""""""""""""""""""""""""""""""/90!
9"!! <%-(6+./=>7%6''+ /).4/<?%+@+5)(+ /"""""""""""""""""""""""""""""""""""""""""""""""""""""""""""""""""""""""""""""""""""""""""""/9A!
9"9! <%-(6+./B46.(+@+5)(+ /"""""""""""""""""""""""""""""""""""""""""""""""""""""""""""""""""""""""""""""""""""""""""""""""""""""""""""""""""""""""""/9#!
9"C! $%&'()**+,)(+ /"""""""""""""""""""""""""""""""""""""""""""""""""""""""""""""""""""""""""""""""""""""""""""""""""""""""""""""""""""""""""""""""""""""""/C1!
9"A! D)()/$-**65(+ /"""""""""""""""""""""""""""""""""""""""""""""""""""""""""""""""""""""""""""""""""""""""""""""""""""""""""""""""""""""""""""""""""""""/C!!
CHAPTER 4: RESULTS and DISCUSSION 46!
(Structure Solution and Insights) 46!
C"0! :(%?5(?%6/'-*?(+ /).4/E6@+.6;6.(/""""""""""""""""""""""""""""""""""""""""""""""""""""""""""""""""""""""""""""""""""""""""""""""/CF!
C"!! GH6%)**/:(%?5(?%6/""""""""""""""""""""""""""""""""""""""""""""""""""""""""""""""""""""""""""""""""""""""""""""""""""""""""""""""""""""""""""""""""""/A1!
C"9! D+;6%/B.(6%@)56/"""""""""""""""""""""""""""""""""""""""""""""""""""""""""""""""""""""""""""""""""""""""""""""""""""""""""""""""""""""""""""""""""""""/A9!
C"9"0! I&4%-7J-K+5/$-%6/""""""""""""""""""""""""""""""""""""""""""""""""""""""""""""""""""""""""""""""""""""""""""""""""""""""""""""""""""""""""""""/A9!
C"9"!! I&4%-86./L 4'/""""""""""""""""""""""""""""""""""""""""""""""""""""""""""""""""""""""""""""""""""""""""""""""""""""""""""""""""""""""""""""""""/A9!
C"9"9! $-;7)%+' /-@/BD9/J-;-*-8&/;-46*/J-;-4+;6%/+.(6%)5(+ '/""""""""""""""""""""""""""""""""""""/AM!
C"9"C! D+'?*@+46/K 4/+./BD!/J-;-4+;6%/@-%;)(+ /"""""""""""""""""""""""""""""""""""""""""""""""""""""""""""""""""""""""/A#!
C"C! N 7/%68+ /"""""""""""""""""""""""""""""""""""""""""""""""""""""""""""""""""""""""""""""""""""""""""""""""""""""""""""""""""""""""""""""""""""""""""""""/A#!
C"A! O3(6%; +. )*/I6*+>30/%68+ /""""""""""""""""""""""""""""""""""""""""""""""""""""""""""""""""""""""""""""""""""""""""""""""""""""""""""""""""/F0!
CHAPTER 5: RESULTS and DISCUSSION 64!
(Biochemical Studies) 64!
A"0! BD!/7%-(6+./)5 (+H+(&/"""""""""""""""""""""""""""""""""""""""""""""""""""""""""""""""""""""""""""""""""""""""""""""""""""""""""""""""""""""""""""""/FC!
A"!! BD/J6(6%-4+; 6% /K+.4 +.8 /'765+@+5+(& /).4 /)@@+.+(& /""""""""""""""""""""""""""""""""""""""""""""""""""""""""""""""""""""""/FF!
A"9! BD/J6*+>30/%6'+4?6'/+./K+.4+.8/'765+@+5+(&/"""""""""""""""""""""""""""""""""""""""""""""""""""""""""""""""""""""""""""""""""""/FP!
A"C! =>7*-%+.8/-(J6%/4+@@6%6.56'/+./BD/%6'+4?6'/""""""""""""""""""""""""""""""""""""""""""""""""""""""""""""""""""""""""""""""""/M0!
!
iv!
5.5! MASH1(and(the(ID(proteins( (76!
CHAPTER 6: CONCLUSION and FUTURE DIRECTIONS 78!
6.1! Conclusions( (78!
6.2! Future(Directions( (81!
BIBLIOGRAPHY: 83!
LIST OF PUBLICATIONS 97!
Appendix 1: Protein Sequences (Human) 98!
Appendix 2: Purified proteins used in EMSA studies 99!
Appendix 3: E47 & MYOD1 cloning, expression and purification for EMSA studies 100!
Appendix 4: Summary of expression and purification protocols for ID mutants 103!
Appendix 5: ID1 & ID3 cloning, expression and purification 104!
Appendix 6: ID2 as a dimer in solution. Gel filtration profile 105!
Appendix 7: ID2 coordinates 106!
!
v!
SUMMARY
!
!
The ID proteins, a class of transcription regulators, were named for their role as
inhibitors of DNA-binding and differentiation. They contained a helix-loop-helix
(HLH) domain without a basic DNA-binding domain and worked by dimerizing with
basic-HLH transcription factors to inactivate their DNA-binding abilities. Although the
HLH domain was highly conserved and shared similar topology, the IDs preferentially
antagonized group A bHLHs such as E47 (TCF3) but not the group B MYC.
In general, group A bHLHs contained proteins that bound the enhancer-box (E-
box) motif CANNTG and the consequences of their transcriptional inactivation were
implicated in cell cycle regulation, cell lineage determination, differentiation,
myogenesis, neurogenesis and tumourigenesis.
ID2, a member of the ID family, was used to study this protein family. Cloning
strategies to overcome the instability of this protein family were explored in addition
to the expression and purification approaches required to produce enough soluble
protein for crystallization.
The crystal structure of ID2 was solved to 2.1 Å using a seleno-methionine
template model in molecular replacement. The structure showed for the first time, a
loop ion that was previously unreported in HLH structures. Residues involved in ion-
interactions were investigated for their roles in the structure of ID2. Besides the
hydrophobic core, an inspection of the ID2 structure showed that specific hydrogen
bonds were required for dimerization. Comparisons of the ID2 crystal structure with
homology models, previous studies of specific residues, and the ID3 NMR structure
were done to examine how these residues might play a role in the structure and
function of ID2.
Finally, mutations to key residues would be made and their activities tested in
competitive EMSAs to gauge their importance in dimerization of the ID protein family.
!
vi!
LIST OF TABLES
Table 1: Representative structures of bHLH-containing proteins from the PDB for
each group. 4!
Table 2: ID2 constructs and their theoretical biochemical properties estimated by
ProtParam (Wilkins, et al., 1999). Constructs described in detail (yellow
highlight) 23!
Table 3: Primer base for BP cloning (Invitrogen) to create the entry clone for
Gateway LR reaction (Invitrogen). attB sites (italics), sequence transferred
into pDonr vector during BP reaction (bold), protease sites (underlined). Final
selected protease is highlighted in yellow. 23!
Table 4: Sequences for each construct were added to the primer base in Table 3 to
complete the primer sequences used for BP cloning. 23!
Table 5: Mutagenesis primers. Mutation shown after first underscore and changed
residue denoted by red bold letter. Forward and reverse primers denoted by
_F and _R respectively. Changed nucleotide (s) denoted by grey highlight. 24!
Table 6: Domain prediction results for ID2 from Ensembl release 67 32!
Table 7: LC/MS/MS mass spectrometry top hits for the purified proteins (Figure 8).
Searches were done against all nr as well as human nr to show that the
fragments captured always belonged to ID2. Note that the N-HLH-82-L
contained the intact N-terminus (matched peptides in bold red) whereas the
shorter form HLH24-82-L and the seleno-methionine version did not. 39!
Table 8: Crystallographic Data Collection Statistics. 44!
Table 9: Phasing statistics of Se-Met construct HLH24-82-L-Se-Met. 47!
Table 10: Refinement statistics for native ID2 N-HLH82-L construct. 48!
Table 11: Positions of 3 residues thought to be important for heterodimerization with
MYOD1. 62!
Table 12: Constructs created for use in protein expression for E47 and MYOD1
human proteins showing their theoretical biochemical properties estimated by
ProtParam(Wilkins, et al., 1999) 100!
Table 13: Changes to ID2 protocol for expression and purification of ID2 and ID3
mutants 103!
Table 14: ID1 & ID2 constructs and their theoretical biochemical properties estimated
by ProtParam(Wilkins, et al., 1999) 104!
Table 15: Changes to ID2 protocol for expression and purification of ID1 and ID3
HLH domains 104!
!
vii!
LIST OF FIGURES
Figure 1: Hydrophobic core packing of bHLH-containing proteins. 5!
Figure 2: Cartoon representation of ID3 (PDB: 2LFH) NMR structure. Monomer
shown as dark blue N-terminal residual tag, green unfolded N-terminus, pale
red helix 1, green loop, red helix 2. 6!
Figure 3: T-coffee multiple alignment of full length ID proteins to show the highly
conserved HLH region and the divergent N & C-termini with only a few small
regions of similarity such as the D-box (destruction box) element 9!
Figure 4: Reported binders and non-binders of ID proteins. The general structure of
binders had shorter helices unlike non-binders, such as MYC, which had the
additional leucine zipper. Overall, topology conformed to the same 4 helical
bundle. 10!
Figure 5: Cartoon representation of ID3 (PDB: 2LFH) aligned with E47 (Ellenberger
private communication) to illustrate how the heterodimerization might take
place. ID3 in red, E47 in blue. 11!
Figure 6: Representative small-scale protein expression tests. 33!
Figure 7: Stability of HLH24-82-L containing polypeptide stabilizer over 6 days at
room temperature (25°C). SDS-PAGE 12% gel: marker (lane M), Day 0 (lane
1), Day 1 (lane 2), Day 3 (lane 3), Day 6 (lane 4) 35!
Figure 8: ID2 proteins’ expression and purification 37!
Figure 9: ID2 proteins’ purity check by SDS_PAGE: marker (lane M, kDa). N-HLH82-
L (gel A, lane 1), HLH24-82-L (gel B, lane 2), HLH24-82-L-Se-Met (gel C,
lane 3) 38!
Figure 10: HLH24-82-L crystals in 0.1 M MES pH 6.5, 2.5 M Lithium Acetate grown at
18°C 41!
Figure 11: Crystals from manual hanging-drop optimization grown at 18°C 42!
Figure 12: HKL view of reflections in the kl plane in reciprocal space for N-HLH82-L
crystal at 2.1Å resolution. 45!
Figure 13: Ramachandran plot of ID2 N-HLH82-L by RAMPAGE (http://www-
cryst.bioc.cam.ac.uk/rampage/) (Lovell, et al., 2003) 49!
Figure 14: Diagrammatic representation of ID2 HLH structure 51!
Figure 15: Cartoon representation of the crystal structure of ID2 at 2.1Å resolution
showing the positive loop ion and missing basic region. 52!
Figure 16: Ribbon representations of ID2 homodimer interactions. ID2: chain A in
purple, chain B in brown, loop in green and potassium ion in grey 55!
Figure 17: Loop region mutants of ID2 and ID3. SDS-PAGE: marker (kDa, lane M),
before induction (lane U), insoluble pellet fraction (lane P), soluble fraction (S).
!
viii!
Red boxes denote expected expression region. Gel A and B expression
vector was pDest-565 induced at 17°C. Gel C expression vector was pDest-
HisMBP induced at 17°C. 56!
Figure 18: Predicted interactions based on ID3 homology model (Wibley, et al., 1996)
were not found in either the ID2 crystal structure nor ID3 NMR structure. 58!
Figure 19: Structural alignment of the bHLH domain of ID proteins and their binding
partners. Alignments were done manually using Pymol’s align function as a
guide. 58!
Figure 20: E47 homodimer showing the network of glutamines that were predicted to
form hydrogen bonds but the distances were too far for most of them.
Perhaps E47 also had a positive ion in the loop coordinated by two of the
glutamines that held it rigid? (grey sphere). 60!
Figure 21: Ribbon representation of ID2 and ID3 opposing chains to illustrate 3
residues thought to play an important role in heterodimerization with MYOD1.
Residues from ID2 (Y37, D41) and ID3 (D42, H46) pointed away from the
dimer interface. ID2-K47 and potentially ID3-R52 had interactions with the
loop ion that was necessary for homodimer formation of ID2. 63!
Figure 22: EMSA controls 64!
Figure 23: EMSA 6% native gel showing that increasing concentration of ID2
inhibited E47 binding to DNA. Lanes without ID2 (lanes 1 and 2) denoted by
“-“. Number of “+” denoted relative concentration of ID2 added. All lanes
contained 2 μM E47. This showed that the purified ID2 used for crystallization
was active. 65!
Figure 24: EMSA 6% native gel showing the different ID-HLH binding affinities to 0.05
µM human E47. Residues for each human ID protein given in parentheses. “+”
denoted presence of E47. All lanes contained 200nM DNA. Concentrations of
each ID protein provided in the table above the gel. All ID proteins bound E47
to varying degrees. 66!
Figure 25: EMSA 6% native gel showing the different ID-HLH binding affinities to 0.2
µM human MYOD1 (tagged with His-MBP). Residues for each human ID
protein given in parentheses. “+” denoted presence of MYOD1. All lanes
contained 100nM DNA. Concentrations of each ID protein provided in the
table above the gel. ID1 and ID2 showed weak interactions with MYOD1
where a large fraction seemed to form an intermediate rather than complete
inhibition. ID3 did not bind MYOD1. 67!
Figure 26: EMSA 6% native gel showing the different ID-HLH binding affinities to 0.2
µM human MYOD1 (tagged with His-MBP) heterodimerized with E47
(0.05µM). Residues for each human ID protein given in parentheses. “+”
denotes presence of MYOD1 and/or E47. All lanes contained 200nM DNA.
Concentrations of each ID protein provided in the table above the gel.
MYOD1 had high propensity to bind E47. All IDs showed the same binding
pattern as seen in Figures 24 and 25. 67!
!
ix!
Figure 27: EMSA 6% native gel showing ID2 helix-1 mutants binding affinities to 0.2
µM human E47. “+” denotes presence of E47. All lanes contained 100nM
DNA. Concentrations of each ID protein provided in the table above the gel.
All mutants bound to E47. 69!
Figure 28: EMSA 6% native gel showing ID2 helix-1 mutants binding affinities to 0.2
µM human MYOD1 (HisMBP tagged). “+” denotes presence of MYOD1. All
lanes contained 100nM DNA. Concentrations of each ID protein provided in
the table above the gel. All ID2 helix-1 mutants bound to MYOD1 weakly just
like wild-type ID2. 69!
Figure 29: EMSA 6% native gel showing ID2 helix-1 mutants binding affinities to 0.2
µM human MYOD1 (HisMBP tagged) heterodimerized with 0.2 µM E47. “+”
denotes presence of MYOD1 and/or E47. All lanes contained 100nM DNA.
Concentrations of each ID protein provided in the table above the gel. IDs
bound with similar affinities as with the E47 and MYOD1 homodimers. 70!
Figure 30: EMSA 6% native gels showing ID2 loop region mutants. wt = wild-type ID2,
E47 concentration=100nM, DNA concentration=100nM, MYOD1
concentration=200nM. Concentrations of ID2 are labeled. Top gel shows
binding to E47, bottom gel to MYOD1. Apart from the double mutant, the
other ID2 mutants bound to E47 and MYOD1 as well as wild-type ID2. 72!
Figure 31: EMSA 6% native gel showing ID2 loop mutants. wt = wild-type ID2, E47
concentration=100nM, DNA concentration=100nM, MYOD1
concentration=200nM. Concentrations of ID2 are labeled. Top gel shows
binding to E47, bottom gel to MYOD1. Both mutants showed partial binding
loss compared to wild-type ID2. 73!
Figure 32: EMSA 6% native gels showing ID3 loop region mutants. wt = wild-type ID3
(His-MBP tag), E47 concentration=100nM, DNA concentration=100nM,
MYOD1 concentration=200nM. Concentrations of ID3 are labeled. Top gel
shows binding to E47, bottom gel to MYOD1. R60Q and R60A were both
tagged with His-MBP. R60Q appeared to bind better than wild-type ID3. 74!
Figure 33: EMSA 6% native gels showing ID3 loop region mutants. wt = wild-type ID3
(His-MBP tag), E47 concentration=100nM, DNA concentration=100nM,
MYOD1 concentration=200nM. Concentrations of ID3 are labeled. Top gel
shows binding to E47, bottom gel to MYOD1. R60Q and R60A were both
untagged. Tagged (Figure 32) or untagged, R60Q showed better binding than
wild-type ID3. 75!
Figure 34: EMSA 6% native gel showing ID proteins bound to MASH1 (left gel) and
MASH1-E47 heterodimer (right gel). E47 concentration=50nM, MASH1
concentration = 0.5µM, DNA concentration=100nM. Concentrations of ID2
are labeled on top of the gels. IDs did not bind MASH1, only E47. 76!
Figure 35: EMSA 6% native gel showing ID proteins bound to MASH1-MYOD1
heterodimer. MYOD1 concentration=0.2µM, MASH1 concentration = 0.5µM,
DNA concentration=100nM. Concentrations of ID2 are labeled on top of the
gel. IDs bound weakly to MYOD1 but did not bind to MASH1. 77!
!
x!
Figure 36: SDS-PAGE 4-12% gels showing proteins used in EMSA studies in
Chapter 5. Marker in kDa (lane M), U = before induction. Gel A & B are the
ID2 helix-1 mutants. Gel C is ID1-HLH, Gel D is His-MBP-ID3 fusion protein.
Gel E is E47. Gel F has both the fusion MYOD1 as well as untagged MYOD1.
99!
!
xi!
LIST OF SYMBOLS
°C – degrees celsius
Å – Angstrom
Ala (A) – Alanine
Arg (R) – Arginine
Asn (N) – Asparagine
Asp (D) – Aspartate
bHLH – basic-helix-loop-helix
BP – lambda recombination reaction involving attB & attP sites
cDNA – complementary DNA
Cy5 – Cyanine 5
C-terminal – carboxy-terminal
D-box – destruction box
E-box – enhancer box
emc – extramachrochaetae gene in Drosophila melanogaster
EMSA – Electrophoretic mobility shift assay
Gln (Q) – Glutamine
Glu (E) – Glutamate
Gly (G) – Glycine
GST – glutathioine S transferase
His (H) – Histidine
His6 (6His) – Hexa-histidine
HLH – helix-loop-helix
Ile (I) – Isoleucine
IPTG – Isopropyl β-D-1-thiogalactopyranoside
!
xii!
LB – Luria broth
Leu (L) – Leucine
LR – lambda recombination reaction involving attL & attR sites
MBP – maltose binding protein
MAD – multiple anomalous disperson
Met (M) – Methionine
MCK – muscle creatine kinase
N-box – variation of enhancer box (E-box)
N-terminal – amino terminal
TB – Terrific broth
PAGE – polyacrylamide gel electrophoresis
PCR – polymerase chain reaction
Pro (P) – Proline
SAD – single anomalous disperson
SDS – sodium dodecyl sulphate
Se-Met – seleno-methionine
TEV – Tobacco Etch Virus
TF – Transcription factor
TG – Tris glycine
Val (V) – Valine
wt – wild-type
!
1!
CHAPTER 1: INTRODUCTION
Helix-loop-helix (HLH) proteins are characterized by two alpha helices linked
together by a loop of varying lengths. A group of transcription factors (TF) containing
this domain are found in virtually all eukaryotes. In addition, these TFs include a
basic domain usually found at the N-terminal end of the HLH that binds DNA and
initiates transcription. They tend to exist as dimers and have key roles in the
regulation of developmental events such as cell lineage determination and
differentiation as well as developmental processes such as neurogenesis and
myogenesis.
With over 200 known helix-loop-helix proteins identified from yeast to humans,
this section aims to introduce some of the members of the basic-helix-loop-helix
(bHLH) family of transcription factors and then focus on a special group of HLH-
containing proteins that antagonizes the function of these bHLH TFs.
1.1 Classes of basic helix-loop-helix (bHLH) proteins
!
The bHLH family of transcription factors are generally known for their ability to
homo- or hetero-dimerize on the canonical Enhancer box (E-box) motif (CANNTG)
(Ephrussi, et al., 1985) that is found in the muscle creatine kinase (MCK) promoter.
Due to the large number of bHLH-containing proteins identified, and the sheer
diversity of their functions, several groups have come up with classification
mechanisms to cluster them.
According to the classical groupings done by tissue distributions, dimerization
capabilities and DNA-binding specificities (Murre, et al., 1994), bHLHs were broken
up into 7 classes. Class I contained ubiquitous proteins such as E12 and E47 (Murre,
et al., 1989), Class II were the tissue specific MyoD (Davis, et al., 1987) and NeuroD
(Poulin, et al., 1997). Class III contained the Myc family of transcription factors
!
2!
(Depinho, et al., 1986), Class IV contained Myc-dimerizing proteins such as Mad
(Ayer, et al., 1993) and Max (Blackwood, et al., 1991). Class V contained the
inhibitors of Class I and II proteins such as ID (Benezra, et al., 1990) and Class VI
contained proteins like Hairy (Klambt, et al., 1989) which has a proline in its basic
region. Finally, Class VII contained proteins like Arnt (Crews, 1998) which has a
bHLH-PAS domain.
Some years later, a different classification method based on phylogenetic
profiling of 242 HLH-containing proteins using evolutionary relationships gave rise to
four major groups A-D (Atchley, et al., 1997). Each group was based not only on their
DNA-binding specificities but also on conservation of residues at specific positions.
Group A contained all proteins that bound to the specific E-box motif (CAGCTG) such
as E12 and MyoD. Group B contained those that bound to motif CACGTG such as
Myc and HAIRY. These two groups were further characterized based on specific
amino acids at defined positions. Group C contained Group B derived proteins but
with no defined amino acid configuration such as Arnt and finally Group D proteins
were those without the basic domain such as ID (Atchley, et al., 1997).
More recently, with many newly sequenced genomes, these original phylogenetic
groups were updated and extended to incorporate two new groups, E and F (Ledent,
et al., 2002). Group A now contained CAGCTG or CACCTG binding proteins such as
MyoD and E47. Group B contained CACGTG or CATGTTG binding proteins such as
Myc, Mad and Max. Group C contained the PAS domain containing proteins that
bound to ACGTG or GCGTG such as Arnt. Group D remained the same, containing
proteins that lacked a basic domain such as ID. The new Group E contained Hairy
which bound preferentially to N-box motifs (CACGCG or CACGAG) and contained an
additional orange domain. And finally Group F contained proteins with an additional
COE domain such as Coe (Vervoort, et al., 1999).
!
3!
1.2 bHLH structures
!
The protein data bank (PDB) (Berman, et al., 2000) currently has over 60 bHLH
transcription factors representing a cross section of five out of the seven different
groups of bHLH-containing proteins as either homo- or heterodimers bound or
unbound to DNA as shown in Table 1. As the structures show, bHLHs exist as
dimers conforming to a parallel 4-helix bundle with varying N and C termini. The
dimeric form is the functional form of bHLHs and monomers are unable to activate
transcription (Murre, et al., 1989).
!
4!
Table 1: Representative structures of bHLH-containing proteins from the PDB for each group.
Protein
PDB
ID
Structure
Group
Reference
E47-
NeuroD1
heterodimer
on DNA
2QL2
A
(Longo, et
al., 2008)
c-Myc (red)
–Max (blue
heterodimer
on DNA
1NKP
B
(Nair, et al.,
2003)
Arnt-HIF2A
heterodimer
2A24
C
(Card, et al.,
2005)
ID3
homodimer
2LFH
D
unpublished
EBF3
(COE3)
3N50
F
(Siponen, et
al., 2010)
!
5!
It was found that dimerization required only the HLH domain (Murre, et al., 1989,
Sun, et al., 1991, Voronova, et al., 1990). Hydrophobic packing between the
adjoining helices of the two monomers created a core that stabilized the HLH into the
recognized four-helix bundle (Figure 1) (Ellenberger, et al., 1994, Ma, et al., 1994).
Besides these hydrophobic interactions, Group A proteins like E47 have been shown
to contain a network of hydrogen bonds that stabilized the loop (Ellenberger, et al.,
1994, Ma, et al., 1994).
Figure 1: Hydrophobic core packing of bHLH-containing proteins.
!
!
6!
Group B proteins like Myc-Max contained an extra leucine zipper (Leucines at
every 7
th
position) C-terminal of the HLH in addition to the basic residues N-terminal
of the HLH (Murre, et al., 1989). The leucine zipper possibly aided in dimerization by
adding to the hydrophobic core that brought the monomers together (Kajimoto, et al.,
1994, Landschulz, et al., 1988). The very recently deposited ID3 NMR structure
(Group D) had none of these added structures and contained only the HLH (Figure 2)
with a random coil at the N-terminus. The C-terminus from residue 84 onwards was
not included in the deposition.
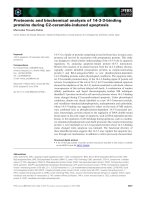
Figure 2: Cartoon representation of ID3 (PDB: 2LFH) NMR structure. Monomer shown as dark
blue N-terminal residual tag, green unfolded N-terminus, pale red helix 1, green loop, red helix 2.
!
7!
For structures with DNA bound, arginines at fixed positions within the basic
domain conferred DNA-binding specificity to the E-box element (Murre, et al., 1989).
Binding would take place as the basic residues of the dimer fixed in the major groove
of the DNA and held together by hydrogen bonds between these residues and the
phosphates in the E-box motif (Ellenberger, et al., 1994, Sun, et al., 1991). Deletion
of this region or point mutations to conserved residues abolished DNA-binding but
did not prevent dimerization (Voronova, et al., 1990).
Some bHLH transcription factors were able to form homodimers on DNA and
activate transcription of downstream genes such as the muscle creatine kinase
(MCK) gene. An example of this was the E47 homodimer which strongly activated
the immunoglobulin genes (Church, et al., 1985). Others such as the tissue-specific
MyoD, homodimerized weakly on DNA but were not efficient in transcriptional
activation unless heterodimerized with a ubiquitous HLH such as E47 (Lassar, et al.,
1991).
1.3 IDs are Group D, HLH-containing proteins
!
The ID proteins fall into the D group of HLHs. The ID genes were named for their
roles as i nhibitors of DNA-binding and differentiation. They were unique in that they
did not contain the customary basic domain and therefore had no propensity to bind
DNA (Benezra, et al., 1990). Instead, they disrupted the DNA-binding ability of a
variety of transcription factors that contained a basic-helix-loop-helix (bHLH)
(Benezra, et al., 1990, O'Toole, et al., 2003) motif by heterodimerizing with them. As
such, their primary function was within the nucleus (Kurooka, et al., 2005, O'Toole, et
al., 2003, Tu, et al., 2003) of many tissues where they exhibited distinctive
expression patterns particularly during growth and development (Cooper, et al., 1997,
Jen, et al., 1996, Jen, et al., 1997). In general, ID mRNAs were detected at high
!
8!
levels during development but were reduced in mature, differentiated tissues (Israel,
et al., 1999).
Although the full complement of ID binding partners has yet to be established,
several studies have shown that many of them are transcription factors that are
specific to Group A. As previously mentioned, this group contained the ubiquitously
expressed E proteins (e.g. E12/ELSPBP1, E47/TCF3) and the tissue specific
myogenic and neurogenic proteins (e.g. MYOD1, NEUROD1) (Massari, et al., 2000,
Murre, et al., 1989). In binding to these transcription factors, ID proteins inactivated
their transcriptional function and in so doing, regulated cell fate and differentiation not
only in muscle tissue but in a variety of cell lineages (Benezra, et al., 1990, Jen, et al.,
1992, Kee, 2009, Yokota, 2001) as well. There was also evidence to suggest that IDs
bound to non-bHLH-containing proteins (Hara, et al., 1996, Iavarone, et al., 1994,
Lasorella, et al., 1996) such as retinoblastoma protein (pRb), a tumour suppressor.
This added promiscuity enhanced their functionality into the areas of cell cycle and
tumourigenesis (Norton, 2000) besides their known roles in modulating myogenesis
and neurogenesis.
There were four mammalian ID paralogs discovered by various groups (Benezra,
et al., 1990, Biggs, et al., 1992, Christy, et al., 1991, Riechmann, et al., 1994, Sun, et
al., 1991). The mammalian family consisted of four members, namely ID1, ID2, ID3
and ID4 (Norton, 2000) and the human forms were mapped to chromosomes 20q11,
2p25, 1p36 and 6p22 respectively (Norton, et al., 1998). Ensembl (Flicek, et al.,
2012) genome browser reported that orthologous ID proteins had an overall identity
of over 90% in primates and over 80% in higher vertebrates. They even shared an
average 25% identity to the emc gene in Drosophila (Riechmann, et al., 1994) whose
function was similar to the dominant negative regulation of bHLH transcription factors
in its mammalian counterparts (Campuzano, 2001). Multiple alignment by T-coffee
!
9!
(Di Tommaso, et al., 2011) is given in Figure 3 to show the peptide sequence
conservation of the HLH region.
Figure 3: T-coffee multiple alignment of full length ID proteins to show the highly conserved
HLH region and the divergent N & C-termini with only a few small regions of similarity such as
the D-box (destruction box) element
!
10!
Although the longest human isoforms varied in size - ID1 has 155 residues, ID2
has 134 residues, ID3 has 119 residues and ID4 has 161 residues - their gene
structure and organization were highly similar at the intron-exon boundaries. Thus, it
had been suggested that they evolved via duplication events from a single ancestral
gene (Deed, et al., 1994, Mantani, et al., 1998, Mathew, et al., 1995, Rigolet, et al.,
1998). Protein sequence alignments of ID paralogs showed a high degree of
conservation within the HLH domain but a divergence at the N and C-termini apart
from small pockets of similarity (Pagliuca, et al., 1995). This HLH domain
conservation was preserved beyond the IDs to other HLHs such as E47, MYOD, Max
and Mad (Phillips, 1994) from multiple sequence alignment analysis. Overall protein
identity across the different IDs and other bHLH-containing proteins was fairly low,
averaging around 35%. Yet, crystal structures of E47, MYOD, Myc, Max and Mad
showed a similar topology of the conserved HLH region consisting of a parallel, four-
helix bundle (Wibley, et al., 1996) (Figure 4).
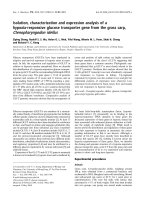
Figure 4: Reported binders and non-binders of ID proteins. The general structure of binders had
shorter helices unlike non-binders, such as MYC, which had the additional leucine zipper.
Overall, topology conformed to the same 4 helical bundle.
!
11!
With such a high conservation of both the HLH domain and structure, Wibley et
al used these structures as a template to create a 3D homology model of ID3 in order
to predict how the ID homodimers could exist as well as how they functioned to
disrupt DNA-binding in their heterodimerization with other bHLH transcription factors
(Wibley, et al., 1996). They postulated that IDs were able to homodimerize without
DNA for stability mainly because of better hydrophobic core packing and that they did
not bind DNA due to a non-basic, coiled-coil structure in the corresponding basic
region of other bHLH-containing proteins (Wibley, et al., 1996). Since then, the NMR
structure of ID3 (2LFH) (Eletsky, et al., 2011) was deposited into the PDB and will be
discussed in detail in a future chapter. To illustrate a possible heterodimer of ID3 with
E37, the structures were structurally aligned and a monomer from each removed to
reveal the much shorter helix of ID3 at the N-terminal end where the basic domain of
E47 would normally be located in (Figure 5).
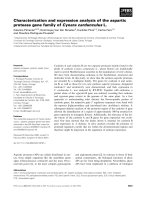
Figure 5: Cartoon representation of ID3 (PDB: 2LFH) aligned with E47 (Ellenberger private
communication) to illustrate how the heterodimerization might take place. ID3 in red, E47 in blue.
The next few sections serve to highlight the role of IDs in development,
neurogenesis, myogenesis and tumourigenesis.