Study on association of bio-physiological parameters with grain yield in sorghum genotypes under post flowering moisture stress conditions
Bạn đang xem bản rút gọn của tài liệu. Xem và tải ngay bản đầy đủ của tài liệu tại đây (581.66 KB, 12 trang )
Int.J.Curr.Microbiol.App.Sci (2019) 8(2): 1601-1612
International Journal of Current Microbiology and Applied Sciences
ISSN: 2319-7706 Volume 8 Number 02 (2019)
Journal homepage:
Original Research Article
/>
Study on Association of Bio-physiological Parameters with Grain Yield in
Sorghum Genotypes under Post Flowering Moisture Stress Conditions
D. Devkumar1*, V. Padma2, H.S. Talwar3 and Farzana Jabeen4
1
Department of Crop Physiology, College of Agriculture, Prof. Jayashankar Telangana State
Agricultural University (PTSAU), Rajendranagar, Hyderabad-30, India
2
Department of Crop Physiology, Lam form Guntur, India
3
Department of Plant Physiology, Indian institute of Millet Research (IIMR), Rajendranagar,
Hyderabad -30, India
4
Department of Genetics and Plant Breeding, College of Agriculture, Prof. Jayashankar
Telangana State Agricultural University (PTSAU), Rajendranagar, Hyderabad-30, India
*Corresponding author
ABSTRACT
Keywords
SPAD Clorophyll
Meter Reading
(SCMR),
Photosynthetic rate,
Transpiration rate,
Stomatal resistance,
Grain yield,
Sorghum genotypes
Article Info
Accepted:
10 January 2019
Available Online:
10 February 2019
A field experiment was conducted during rabi 2012-13 at research farm of
Directorate of Sorghum Research, Rajendranagar, Hyderabad. The experiment
was laid out in a split plot design, replicated thrice, with 10 Sorghum genotypes as
main treatment (well watered and water stress conditions) and with 10 genotypes
are sub treatments CRS 4, CRS 19, CRS 20, PEC 17, CSV 18, M 35-1, Phule
chitra, Phule moulee, EP 57 and CRS 1). Photosynthetic rate and stomatal
resistance at 15 and 30 DAF were positively and significantly correlated with
grain yield while the transpiration rate at 15 and 30 DAF exhibited negative
correlation with grain yield. SPAD chlorophyll meter reading (15 and 30 DAF)
and chlorophyll content at 30 DAF had positively significant correlation with
grain yield.
Introduction
Sorghum (Sorghum bicolor (L.) Moench) is
one of the world’s most important nutritional
cereal crops and also the major staple food
crop of millions of people in semi-arid tropics
(SAT). It is considered as the king of millets
and extensively grown in Africa, China, USA,
Mexico and India. Sorghum ranks fourth
among the world’s most important crops after
wheat, rice and maize. Its current world
production stands at 64.6 million tonnes while
in India current production is 7.4 million
tonnes. In India, Sorghum is cultivated in both
rainy and post rainy (rabi) season, mainly as a
rain fed crop with about 85% of the
production concentrated in Maharashtra,
Karnataka and Andhra Pradesh. The national
average productivity of Sorghum is very low
(880 kg/ha). In India, it is the major dry land
1601
Int.J.Curr.Microbiol.App.Sci (2019) 8(2): 1601-1612
crop currently grown in about 7.69 m ha
during both kharif (3.2 m ha) and rabi (4.50
m ha) seasons with a production of 7.73 m t.
data on were analyzed statistically by
applying the technique of split plot design
taken from (Panse and Sukhatme, 1978).
The rabi Sorghum is normally grown under
stored and receding soil moisture conditions
with increasing temperature after flowering.
Thus, it experiences both soil and atmospheric
water deficit (drought). The limited
availability of water causes moisture stress
which affects various metabolic processes of
the plant. The limited availability of water
causes moisture stress which affects various
metabolic processes of the plant. The major
limitations for Sorghum productivity are the
occurrence of various biotic (shoot fly, stem
borer, charcoal rot etc) and abiotic (drought,
salinity and temperature, etc.) stresses at
different crop growth stages.
The spacing maintained was 60 cm between
rows and 15 cm between plants. A basal dose
of 20 kg ha-1 N and 20 kg ha-1 P2O5 was
applied before final ploughing. The seed were
hand sown and the field was irrigated to
saturate the soil profile with water to ensure
uniform germination. The crop was thinned to
two plants per hill after 10 days of emergence
and then to one plant per hill after about a
week. Around 20 days after emergence, an
additional 20 kg ha-1 N as urea was applied
and irrigated.
Results and Discussion
SPAD Chlorophyll Meter Reading (SCMR)
Materials and Methods
The treatments comprised to screen the
promising germplasm, advanced breeding
lines and landraces to identify the new
sources and traits associated with post
flowering drought tolerance in sorghum. The
crop was sown under well watered and water
stress condition to examine the potential of
Sorghum genotypes to adapt to the post
flowering drought. Well Watered and Water
Stress (two main treatments) conditions and
10 Sorghum genotypes viz; CRS 4, CRS 19,
CRS 20, PEC 17, CSV 18, M 35-1, Phule
chitra, Phule moulee, EP 57 and CRS 1. The
experiment was laid out in split plot design
and replicated thrice. The SPAD-502 (Soil
Plant Analytical Development) meter was
used for measuring the relative chlorophyll
content of leaves. The readings were taken
from top third fully expanded leaf. Mean of
five values from five hills was obtained. The
photosynthetic rate, transpiration rate and
stomatal resistance were measured in the 3rd
fully expanded leaf from the top by using
Infra Red Gas Analyzer (Model TPS-1). The
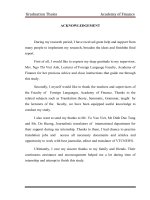
The data on SPAD reading revealed
significant differences among the genotypes
both at 15 and 30 DAF and the maximum
SPAD readings was recorded at 15 DAF by
all the genotypes compared to 30 DAF are
presented in table 1 and figure 1.
At 15 DAF, the genotype PEC 17 (51) had the
maximum SPAD reading and the lowest
SPAD reading was CRS 1 (38). At 30 DAF
the maximum SPAD readings was recorded in
PEC 17 (37). The lowest SPAD reading at
this stage was recorded in the genotype CRS
1 (24). Significant differences were also
observed between the treatments, during well
watered and water stress conditions. The
SPAD readings decreased in all the genotypes
due to the moisture stress imposed during post
flowering period. The SPAD chlorophyll
meter readings had significant and positive
correlation with grain yield both at 15 DAF (r
= 0.80) and 30 DAF (r = 0.50).
So, SCMR can be used to evaluate the
performance of Sorghum genotypes under
1602
Int.J.Curr.Microbiol.App.Sci (2019) 8(2): 1601-1612
post flowering drought condition. In general,
higher SCMR means greater nitrogen and
chlorophyll and thus these values can be taken
as an index for evaluation of Sorghum
genotypes for drought tolerance. The results
observed in the present study are in
conformity with the results of Xu et al.,
(2000) Rao et al., (2003) (Talwar et al., 2011)
and Sudhakar et al., (2006).
Photosynthetic rate ( mol CO2 m-2 s-1)
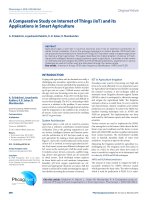
The data on photosynthetic rate revealed
significant differences among the genotypes
both at 15 and 30 DAF and the maximum
photosynthetic rate was recorded at 15 DAF
by all the genotypes compared to 30 DAF
(Table 2 and Fig. 2).
At 15 DAF, the genotype PEC 17 (36.5 μmol
CO2 m2 s-1) had the maximum photosynthetic
rate followed by M 35-1 (35.5 μmol CO2 m2
s-1) and CSV 18 (32.5 μmol CO2 m2 s-1), and
the lowest photosynthetic rate was in CRS 1
(25.5 μmol CO2 m2 s-1). At 30 DAF the
maximum photosynthetic rate was recorded in
PEC 17 (26.5 μmol CO2 m2 s-1) followed by
M 35-1 (25.5 μmol CO2 m2 s-1).
The lowest photosynthetic rate at this stage
was recorded by the same genotype CRS 1
(16.5 μmol CO2 m2 s-1). Such variation in
photosynthetic rate among genotypes was also
reported by Watling et al., (2003), Rao et al.,
(2001), Pawar et al., (2005) and
Channappagoudar et al., (2008). There was
significant difference between the treatments,
during well watered and water stress. The
photosynthetic rate decreased in all the
genotypes due to the moisture stress impose
during
post
flowering
period.
The
photosynthetic rate was positively and
significantly correlated with grain yield at
15DAF (r = 0.71) and 30 DAF (r = 0.57).
Transpiration rate (μ mol H2O m2 s-1)
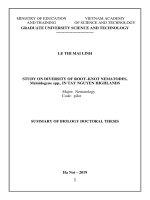
The data on transpiration rate revealed
significant differences among the genotypes
at 15 and 30 DAF and the maximum
transpiration rate was recorded at 15 DAF
compared to 30 DAF (Table 3 and Fig. 3).
At 15 DAF, maximum transpiration rate was
recorded in CRS 1 (4.28 μ mol H2O m2 s-1)
followed by CRS 20 (4.17 μ mol H2O m2 s-1).
The lowest transpiration rate at this stage was
recorded in the genotype PEC 17 (2.43 μ mol
H2O m2 s-1) and M 35-1 (2.69 μ mol H2O m2
s-1). Similarly, at 30 DAF, the maximum
transpiration rate was recorded in CRS 1
(2.70 μ mol H2O m2 s-1) followed by CRS 20
(2.58 μ mol H2O m2 s-1). The lowest
transpiration rate was recorded in PEC 17
(0.87 μ mol H2O m2 s-1) and M 35-1 (0.96 μ
mol H2O m2 s-1). Similarly, the genotypic
variations in transpiration rate were also
reported by several workers (Dhopte et al.,
1987 and Yadav et al., 1991). Significant
differences were also observed between the
treatments, during well watered and water
stress conditions. There was increase in
transpiration rate in all the genotypes due to
the moisture stress induced during post
flowering period. Higher transpiration
efficiency was desirable for higher grain yield
and biomass productivity under post anthesis
drought stress situations was earlier reported
by Rao et al., 2001. The transpiration rate was
negatively and significantly correlated with
grain yield both at 15 DAF (r=-0.54) and 30
DAF (r = 0.56) (Table 5).
Under receding soil moisture situation,
maintenance of low transpiration rate is an
important factor for yield stability. The lower
transpiration rate as a trait can be incorporated
into the hybrids for better yields under
receding soil moisture situation (Ashok
Surveshi et al., 2011).
1603
Int.J.Curr.Microbiol.App.Sci (2019) 8(2): 1601-1612
Table.1 SPAD readings at 15 DAF and 30 DAF of Sorghum genotypes under well watered and
water stress conditions
Genotypes
CRS 4
CRS 19
CRS 20
PEC 17
CSV 18
M35-1
Phule Chitra
Phule Moulee
EP 57
CRS 1
Mean
CD
Genotypes (G)
Treatments (T)
GXT
CV
SPAD – 15DAF
WW
WS
Mean
50
45
48
44
40
42
48
43
46
52
49
51
46
45
46
49
45
47
45
43
44
45
41
43
46
42
44
39
37
38
46
43
45
4.63
2.25
7.12
9.33
SPAD – 30DAF
WW
32
33
27
38
32
34
32
37
33
24
32
WS
28
30
25
35
32
31
29
34
31
23
30
4.23
Mean
30
32
26
37
32
33
31
36
32
24
31
2.23
7.06
13.37
WW-Well Watered, WS- Water Stress.
Table.2 Photosynthetic rate (μ mol CO2 m2 s-1) at 15 DAF and 30 DAF of Sorghum genotypes
under well watered and water stress conditions
Genotypes
CRS 4
CRS 19
CRS 20
PEC 17
CSV 18
M35-1
Phule Chitra
Phule Moulee
EP 57
CRS 1
Mean
CD
Genotypes (G)
Treatments (T)
GXT
CV
Photosynthetic rate - 15DAF
WW
WS
Mean
31
30
30.5
30
27
28.5
27
26
26.5
37
36
36.5
33
32
32.5
36
35
35.5
27
26
26.5
28
26
27.0
33
31
32.0
26
25
25.5
31
30
30.5
2.22
0.84
2.66
7.77
Photosynthetic rate - 30DAF
WW
WS
Mean
20
19
19.5
20
20
20.0
18
17
17.5
27
26
26.5
21
20
20.5
26
25
25.5
18
16
17.0
19
17
18.0
22
20
21.0
17
16
16.0
21
20
20.5
1.67
0.84
2.66
3.26
WW-Well Watered, WS- Water Stress.
1604
Int.J.Curr.Microbiol.App.Sci (2019) 8(2): 1601-1612
Table.3 Transpiration rate (μ mol H2O m2 s-1) at 15 DAF and 30 DAF of Sorghum genotypes
under well watered and water stress conditions
Genotypes
CRS 4
CRS 19
CRS 20
PEC 17
CSV 18
M35-1
Phule Chitra
Phule Moulee
EP 57
CRS 1
Mean
CD
Genotypes (G)
Treatments (T)
GXT
CV
Transpiration rate -15DAF
WW
WS
Mean
3.40
3.73
3.56
3.20
3.34
3.27
4.15
4.18
4.17
2.32
2.53
2.43
2.93
3.10
3.02
2.54
2.84
2.69
3.57
3.74
3.66
4.01
4.06
4.04
3.05
3.12
3.09
4.23
4.33
4.28
3.34
3.50
3.42
0.14
0.06
0.19
3.26
Transpiration rate -30DAF
WW
WS
2.27
2.42
2.07
2.11
2.53
2.63
0.84
0.89
1.14
1.17
0.91
1.00
2.33
2.40
2.64
2.72
1.19
1.24
2.65
2.74
1.86
1.93
0.08
Mean
2.35
2.09
2.58
0.87
1.16
0.96
2.37
2.68
1.22
2.70
1.90
0.06
0.19
6.08
WW-Well Watered, WS- Water Stress
Table.4 Stomata resistance (s.cm-1) at 15 DAF and 30 DAF of Sorghum genotypes under well
watered and water stress conditions
Genotypes
CRS 4
CRS 19
CRS 20
PEC 17
CSV 18
M35-1
Phule Chitra
Phule Moulee
EP 57
CRS 1
Mean
CD
Genotypes (G)
Treatments (T)
GXT
CV
Stomatal resistance -15DAF
WW
WS
Mean
45
44
44.5
42
41
41.5
35
34
34.5
54
53
53.5
47
46
46.5
52
51
51.5
43
42
42.5
38
37
37.5
50
49
49.5
36
34
34.5
44
43
43.5
1.10
Stomatal resistance -30DAF
WW
WS
Mean
29
28
28.5
26
25
25.5
23
22
22.5
37
36
36.5
31
30
30.5
33
33
33.0
26
25
25.5
28
27
27.5
31
30
30.5
25
24
24.5
29
28
28.5
1.38
0.63
2.00
2.69
0.61
1.95
4.03
1605
Int.J.Curr.Microbiol.App.Sci (2019) 8(2): 1601-1612
Table.5 Correlation Coefficient among fifteen yield and yield related attributes in 10 genotypes
of Sorghum
Characters
PH
GLAR 10
PH
GLAR10
GLAR 20
GLAR 30
GLAR 40
PSR 15
PSR 30
1.00000
0.74955
0.56558
0.74505
0.76535
0.45749
0.31157
1.00000
0.76666
0.75924
0.81673
0.66750
1.00000
0.78614
0.78170
1.00000
GLAR 20
GLAR 30
GLAR 40
TRAS 30
STOM
15
STOM 30
SPAD 15
-0.52112
-0.38139
0.46524
0.40532
0.72213
0.57251
-0.68575
-0.62819
0.60310
0.56893
0.79546
0.47241
0.48748
-0.59095
-0.55425
0.46550
0.34905
0.52267
0.92397
0.37803
0.36612
-0.50432
-0.35114
0.36082
0.25450
0.56451
1.00000
0.44195
0.39801
-0.53670
-0.41178
0.41128
0.36596
0.69483
1.00000
0.93217
-0.93434
-0.92832
0.93381
0.94319
0.73645
1.00000
-0.90752
-0.87254
0.86114
0.88265
0.61612
1.00000
0.94382
-0.95700
-0.88733
-0.64545
1.00000
-0.92537
-0.87505
-0.55245
1.00000
0.92285
0.64516
1.00000
0.65296
1.00000
PSR 15
PSR 30
TRAS 15
TRAS 15
TRAS 30
STOM 15
STOM 30
SPAD 15
PH
0.48181
0.40671
0.21529
0.23607
0.49609
0.53381
0.34717
0.49170
No
Grains
per
panicle
0.69721
0.59234
0.50869
GLAR 10
0.60293
0.61462
0.54715
0.47557
0.53517
0.43580
0.50709
0.53641
0.64479
0.67829
0.66093
GLAR 20
0.40050
0.48520
0.43800
0.34156
0.25355
0.68761
0.44809
0.59485
0.62873
0.55128
0.27237
GLAR 30
0.43024
0.32470
0.25703
0.26102
0.27778
0.60753
0.34445
0.57896
0.74304
0.56010
0.30798
GLAR 40
0.58200
0.44763
0.30556
0.31126
0.39531
0.61981
0.50042
0.66013
0.67872
0.68520
0.47684
PSR 15
0.63724
0.94841
0.90911
0.86078
0.78182
0.29867
0.56543
0.38855
0.40838
0.67004
0.71594
PSR 30
0.57334
0.89585
0.90141
0.91585
0.64511
0.30617
0.51505
0.42145
0.41373
0.69083
0.57892
TRAS 15
-0.67680
-0.91599
-0.83443
-0.78232
-0.67073
-0.49802
-0.57436
-0.51755
-0.44591
-0.65210
-0.53955
TRAS 30
-0.54711
-0.92177
-0.86935
-0.72392
-0.62204
-0.45570
-0.55184
-0.42222
-0.27355
-0.60292
-0.56452
STOM 15
0.64676
0.92555
0.79782
0.77433
0.65443
0.33882
0.47695
0.32245
0.31607
0.59949
0.56848
STOM 30
0.72119
0.96940
0.86006
0.87122
0.74686
0.22516
0.61112
0.37231
0.27032
0.66100
0.69925
SPAD 15
0.63797
0.67609
0.55359
0.59953
0.78576
0.30853
0.50596
0.43915
0.68566
0.71577
0.80475
SPAD 30
1.00000
0.73445
0.55918
0.60357
0.62288
0.32374
0.82722
0.65336
0.35218
0.57278
0.50430
1.00000
0.90815
0.86886
0.74944
0.37629
0.69990
0.48934
0.33893
0.65170
0.65086
1.00000
0.91038
0.71761
0.30344
0.63435
0.45291
0.38183
0.45255
0.51861
1.00000
0.67531
0.15494
0.52818
0.36415
0.42784
0.51902
0.51316
1.00000
0.34468
0.68815
0.53798
0.55946
0.48976
0.72169
1.00000
0.54386
0.82000
0.59558
0.35277
0.03855
1.00000
0.84791
0.38413
0.46841
0.44820
1.00000
0.63354
0.45358
0.22574
1.00000
0.39835
0.28708
1.00000
0.78341
Charecters
Chloro
N content
K content
Panicle length
SPAD 30
Chlorophyll
content
N conent
K conent
Panicle
length
Pl wt
1000 seed wt
GWP
No of grains per
panicle
HI
Panicle
weight
1000
seed wt
GWP
HI
GY
1.00000
GY
1606
Int.J.Curr.Microbiol.App.Sci (2019) 8(2): 1601-1612
Fig.1 SPAD readings at 15 DAF and 30 DAF of Sorghum genotypes under well watered and
water stress conditions
1607
Int.J.Curr.Microbiol.App.Sci (2019) 8(2): 1601-1612
Fig.2 Photosynthetic rate (μmol CO2 m2 s-1) at 15 DAF and 30 DAF of Sorghum genotypes
under well watered and water stress conditions
1608
Int.J.Curr.Microbiol.App.Sci (2019) 8(2): 1601-1612
Fig.3 Transpiration rate (μ mol H2O m2 s-1) at 15 DAF and 30 DAF of Sorghum genotypes as
under well watered and water stress conditions
1609
Int.J.Curr.Microbiol.App.Sci (2019) 8(2): 1601-1612
Fig.4 Stomata resistance (s.cm-1) at 15 DAF and 30 DAF of Sorghum genotypes under well
watered and water stress conditions
Stomatal resistance (s.cm-1)
The data on stomatal resistance revealed
significant differences among the genotypes
both at 15 and 30 DAF and the maximum
stomatal resistance was recorded at 15 DAF
by all the genotypes compared to 30 DAF
(Table 4, Fig. 4).
At 15 DAF, the genotype PEC 17 had the
maximum stomatal resistance followed by M
35-1 and EP 57. The lowest stomatal
resistance was observed in CRS 1. At 30 DAF
also the maximum stomatal resistance was
recorded by PEC 17 followed by M 35-1 and
EP 57. The lowest stomatal resistance at this
stage was recorded in the genotype CRS 1.
1610
Int.J.Curr.Microbiol.App.Sci (2019) 8(2): 1601-1612
The interaction between genotypes and stress
treatments was significant and among the
genotypes PEC 17 recorded highest stomatal
resistance at 15 DAF in well watered (54
s.cm-1) and water stress (53 s.cm-1)
conditions. The lowest stomatal resistance in
well watered (38 s.cm-1) and water stress (37
s.cm-1) conditions was observed in the
genotype CRS 1. Similar trend was observed
at 30 DAF with highest stomatal resistance in
PEC 17 in well watered (37 s.cm-1) and water
stress (36 s.cm-1) conditions. The lowest
stomatal resistance in well watered (25 s.cm-1)
and water stress (24 s.cm-1) conditions was
observed in the genotype CRS 1.
It was observed in our study that the
transpiration rate decreased from 15 DAF to
30 DAF in all the genotypes. In general, the
genotypes which had maximum transpiration
rate had low stomatal diffusive resistance. At
30 DAF, the maximum transpiration rate was
observed in CRS 1 which also had the
minimum stomatal diffusive resistance. While
at 15 and 30 DAF, the genotypes PEC 17 also
had low transpiration rate and considerably
more stomatal diffusive resistance. This
clearly indicates that these genotypes were
able to maintain low leaf temperature which is
a desirable character. These results are in
accordance with the findings of Rao et al.,
(2001) and Pawar et al., (2005).
References
Ashok Surwenshi, V.P., Chimmad, R.L.,
Ravikumar. 2007. Comparative Studies
of
Hybrids
and
Parents
for
Physiological Parameters and Yield in
Sorghum
Karnataka
Journal
of
Agricultural Sciences. 20 (1): 25 - 28.
Channappagoudar, B.B., Biradar, N.R.,
Bharamagoudar, T.D and Rokhade, J.
2008. Morpho-physiological Traits of
Sorghum Parental Lines Determining
Grain Yield and Biomass Karnataka
Journal of Agricultural Sciences. 21(2):
168-170.
Dhopte, A.M., Raghangadale, S.L and
Jamadar, S.L. 1987. Physiological
evaluation of forty exotic and wild
sorghum lines in relation to stomatal
factors involved in drought resistance.
Annals of Plant Physiology, 1: 143 –
150.
Pawar, K.N., Biradar, B.D., Shamarao
Jahagirdar, M.R and Ravikumar. 2005.
Identification of Germplasm sources for
adaptation under receding soil moisture
situations in rabi Sorghum Agriculture
Science Digest 25 (1): 56 – 58.
Rao, S.S., Seetharama, N., Kiran Kumar,
K.A and Vanderlip, R.L. 2001.
Characterization of sorghum growth
stages NRCS Bulletin Series NO. 14.
National Research Centre for Sorghum
Rajendranagar. Hyderabad AP. pp: 115.
Rao, S.S., More, P.R., Solunke, V.D.,
kusalkar, D.V., Jirali, D.I., Pawar, K.N.,
Channappagoudar, B.B., Chimmad,
V.P., Prabhakar and Rana, B.S. 2003.
Physiological approaches for improving
drought tolerance in rabi Sorghum.
Proceedings of National Seminar on
‘Role of Plant Physiology for
Sustaining Quality and Quantity of
Food Production in relation to
Environment’. held at University of
Agricultural Sciences. Dharwad. 26-32.
Sudhakar, P., Latha, P., Babitha, M.,
Prasanthi, L., Reddy, P.V. 2006.
Physiological traits contributing to grain
yields under drought in black gram and
green gram Indian Journal of Plant
Physiology.11 (4): 391-396.
Talwar, H.S., Prabhakar, M., Elangovan,
Aruna, K., Rao, S.S., Mishra, J and
Patil, V.J. 2011. Strategies to Improve
Post flowering Drought Tolerance in
Rabi Sorghum for Predicted Climate
Change Scenario. Crop Improvement.37
1611
Int.J.Curr.Microbiol.App.Sci (2019) 8(2): 1601-1612
(2): 93-98.
Watling, J.R., Press, M.C. and Quick, W.P.
2003.
Elevated
CO2
induces
biochemical and ultra structural changes
in leaves of the C4 cereal Sorghum.
Plant Physiology. 123(3): 1143-1152.
Xu, W., Rosenow, D.T and Nguyen, H.T.
2000. Stay green trait in grain sorghum:
relationship between visual rating and
leaf
chlorophyll
concentration.
PlantBreeding. 119(4): 365-367.
Yadav, S., Jyothi Lakshmi, N., Maheshwari,
M. and Venkateswarlu, B. 1991.
Influence of water deficit at vegetative,
anthesis and grain fillings stages on
water relation and grain yield in
sorghum. Indian Journal of Plant
Physiology. 10(1): 20-24.
How to cite this article:
Devkumar, D., V. Padma, H.S. Talwar and Farzana Jabeen. 2019. Study on Association of Biophysiological Parameters with Grain Yield in Sorghum Genotypes under Post Flowering
Moisture Stress Conditions. Int.J.Curr.Microbiol.App.Sci. 8(02): 1601-1612.
doi: />
1612