High performance liquid chromatographic determination of some guaiphenesin-containing cough-cold preparations
Bạn đang xem bản rút gọn của tài liệu. Xem và tải ngay bản đầy đủ của tài liệu tại đây (726.42 KB, 10 trang )
Journal of Advanced Research (2011) 2, 121–130
Cairo University
Journal of Advanced Research
ORIGINAL ARTICLE
High performance liquid chromatographic determination
of some guaiphenesin-containing cough-cold preparations
Mohamed A. Korany *, Ossama T. Fahmy, Hoda Mahgoub, Hadir M. Maher
Department of Pharmaceutical Analytical Chemistry, Faculty of Pharmacy, University of Alexandria, Alexandria 21521, Egypt
Received 8 May 2010; revised 11 August 2010; accepted 13 August 2010
Available online 25 October 2010
KEYWORDS
Salbutamol sulfate;
Guaiphenesin;
Ascorbic acid;
Paracetamol;
Ambroxol hydrochloride;
HPLC
Abstract This paper presents different HPLC methods for the simultaneous determination of some
guaiphenesin-containing cough-cold preparations. Three pharmaceutically available combinations
were analyzed: salbutamol sulfate (SAL) and guaiphenesin (GUA), combination I; ascorbic acid
(ASC), paracetamol (PAR) and guaiphenesin (GUA), combination II; and theophylline anhydrous
(THE), guaiphenesin (GUA) and ambroxol hydrochloride (AMB), combination III. A
250 · 4.6 mm C-18 column was used for all combinations. The mobile phase for the three combinations consisted of a mixture of methanol and 0.01 M aqueous phosphate buffer solution. The pH of
the mobile phase was adjusted to 3.2, 6.2 and 3.8 for combinations I, II and III, respectively. The proposed HPLC methods were successfully applied to the determination of the investigated drugs, both in
synthetic mixtures and in pharmaceutical preparations, without any matrix interference and with high
precision and accuracy. Different aspects of analytical validation are presented in the text.
ª 2010 Cairo University. Production and hosting by Elsevier B.V. All rights reserved.
Introduction
Due to the vast number of papers dealing with the analysis of
the investigated drugs, only recent papers were mentioned in
our literature review. Among the recent publications, the
* Corresponding author. Tel.: +20 3 4871317; fax: +20 3 4873273.
E-mail address: (M.A. Korany).
2090-1232 ª 2010 Cairo University. Production and hosting by
Elsevier B.V. All rights reserved.
Peer review under responsibility of Cairo University.
doi:10.1016/j.jare.2010.09.005
Production and hosting by Elsevier
determination of SAL in pharmaceuticals by liquid chromatography–mass spectrometry (LC–MS) [1], capillary electrophoresis (CE) [2], cyclic voltammetry [3] present there.
Different methods including high-performance liquid chromatography (HPLC) [4] and capillary electrochromatography
(CEC) [5] have been applied for the enantiomeric separation
of SAL. SAL has been determined in biological media using
LC–MS [6], CE [2] and HPLC [7].
Several methods have been reported for the determination
of GUA in pharmaceutical mixtures. These include the analysis of anti-cough preparations by spectrophotometry [8,9],
micellar electrokinetic chromatography (MEKC) [10] and
HPLC [8,9]. Enantioseparation of GUA has been reported
using simulated moving bed chromatography [11]. For the assay of GUA in plasma, liquid chromatography (LC) [12] methods have been applied.
Literally, thousands of papers have been published for the
determination of ASC. Multivitamin preparations containing
122
M.A. Korany et al.
ASC have been assayed for its vitamin contents by LC [13] and
MEKC [14]. HPLC [15] has been applied for the determination
of anti-cold pharmaceutical mixtures containing ASC. For the
determination of ASC in fruit juices, various methods including HPLC [16] have been found beneficial.
PAR has been determined using many reported methods.
Pharmaceutical combinations containing PAR have been analyzed by spectrophotometry [17], LC [18] and MEKC [19]. In
biological fluids, PAR has been determined using HPLC [20].
Several methods have been reported for the determination
of THE. In pharmaceutical preparations, THE has been determined by HPLC [21]. Mixtures containing THE could be assayed using different analytical methods that include infrared spectroscopy [22], HPLC [23] and CEC [24]. THE has been
determined in biological fluids by HPLC [25]. HPLC [26] and
LC–MS [27] have been applied for the determination of THE
and its metabolites in serum. Tea samples have been analyzed
for THE content by HPLC [28]. Separation of the drug enantiomers has been accomplished using HPLC [29].
Different methods have been reported for the determination of AMB either in biological fluids or in pharmaceutical
preparations. Simultaneous determination of AMB with other
drugs in pharmaceutical mixtures has been applied using
HPLC [30,31]. AMB has been determined in biological fluids
by HPLC [32].
GUA may be given with SAL, combination I, as an expectorant and cough-sedative or with ASC and PAR, combination II, as analgesic, antipyretic and expectorant useful in
influenza and common cold. Also GUA can be given in combination with THE and AMB, combination III, as mucolytic,
expectorant and bronchodilator.
Review of the literature reveals that the resolution of multicomponent mixtures containing SAL and GUA along with
methyl paraben and propyl paraben preservatives has been
accomplished in their syrup by using numerical spectrophotometric methods such as partial least squares (PLS-1) and principal component regression (PCR) [8]. In addition an HPLC
method was also developed for the same purpose [8]. Simultaneous assay of SAL and GUA in pharmaceutical preparations
by microbore column liquid chromatography has also been reported [33].
Also the simultaneous determination of GUA, THE together with diphenhydramine hydrochloride, methylparaben,
propylparaben and sodium benzoate in pharmaceutical syrup
has been developed [9]. This was performed using two chemometric methods; partial least squares (PLS-1) and principal
component regression (PCR), and an HPLC method. Both
HPLC methods [8,9] were developed using a RP C18 column
with mobile phase consisting of acetonitrile–phosphate buffer
with UV detection. The methods were validated in terms of
accuracy, specificity, precision and linearity in the range of
Table 1
*
Combination I
SAL
GUA
tRa
Nb
K0 c
2.86
1394
0.68
4.90
4444
1.88
Combination II
ASC
2.00
1708
0.18
PAR
3.10
GUA
1672
4.40
3654
1.59
2304
0.76
3.76
AMB
a
b
c
d
e
f
6.30
4702
5289
Rs e
2.77
7.33
Tff
1.01
1.07
1.02
4.67
4.00
1.93
4.89
0.82
Combination III
THE
3.00
GUA
ad
1.07
1.08
1.08
1.58
3.20
2.24
8.89
1.21
1.12
2.70
1.18
Retention time, in min.
Number of theoretical plates.
Capacity factor.
Selectivity, between each two successive peaks.
Resolution, between each two successive peaks.
Tailing factor.
20–60 lg/ml for GUA and 1–3 lg/ml for SAL [8] or 5.0–
33.0 lg/ml for THE and 3–21 lg/ml for GUA [9].
In addition, an HPLC method has been developed for the
simultaneous estimation of GUA, AMB along with terbutaline
sulfate in their formulations [30]. The separations were
achieved on a RP C18 column using a mobile phase consisting
of a mixture of water and acetonitrile containing sodium hexane sulphonate (pH 3.0).
To our knowledge, no analytical method has been reported
for the simultaneous determination of the studied combinations (II–III) in their multicomponent pharmaceutical mixtures. Only one HPLC method [9] was reported for the
determination of combination I in syrup.
This work describes three rapid, specific, reliable and sensitive analytical methods based on reversed-phase high performance liquid chromatography with UV detection for the
quantitative determination of drugs in the three combinations
whether in synthetic mixtures or in their pharmaceutical preparations. The applied methods depend on the use of methanol
Chromatographic conditions used for combinations I, II and III.
Combination
I
II
III
Table 2 Chromatographic characteristics of drug combinations I, salbutamol sulfate (SAL) and guaiphenesin (GUA), II,
ascorbic acid (ASC), paracetamol (PAR) and guaiphenesin
(GUA) and III, theophylline (THE), guaiphenesin (GUA) and
ambroxol hydrochloride (AMB) by the proposed HPLC
methods.
Flow rate
(ml/min)
1.5
1
1
Mobile phase composition
Run time (min)
Detection wavelength (nm)
*
MeOH Aqueous phase% (v/v) pH of the system
% (v/v)
40
50
60
60
50
40
0.01 M sodium dihydrogenphosphate solution.
3.2
6.2
3.8
10
5
10
275
225
225 nm for the first 4.5 min then 248 nm
HPLC analysis of some cough-cold preparations
123
as the organic modifier unlike the previous methods which
use acetonitrile in the mobile phase [8,9]. So they can be
successfully applied when only methanol is available. Moreover,
the proposed HPLC methods are more sensitive compared
with previously published methods [8,9] except for SAL in
reference [8].
50 mg THE, 30 mg GUA and 15 mg AMB per 5 ml of the
syrup. All reagents were of analytical grade, namely: methanol
(Panreac Co., E.U.), sodium dihydrogenphosphate, orthophosphoric acid and sodium hydroxide (BDH, Poole, England).
The water for HPLC was double glass distilled.
Chromatographic conditions
Experimental
Instrumentation
The chromatographic system consisted of S 1121 solvent delivery system (Sykam GmbH, Germany), S 3210 variable-wavelength UV–VIS detector (Sykam GmbH, Germany) and S
5111 Rheodyne injector valve bracket fitted with a 20 ll sample loop. HPLC separations were performed on a stainlesssteel ThermoHypersil C-18 analytical column (250 · 4.6 mm)
packed with 5 lm diameter particles. Data were processed
using EZChromä Chromatography Data System, version 6.8
(Scientific Software, Inc., CA, USA) on an IBM-compatible
PC connected to a printer.
In the three combinations, the mobile phase consisted of
methanol and an aqueous phase, which was 0.01 M sodium
dihydrogenphosphate aqueous solution. The pH of the mobile
phase was adjusted to the required value by dropwise addition
of either 0.1 M H3PO4 or 0.1 M NaOH solutions. The used
chromatographic conditions are summarized in Table 1. The
corresponding chromatographic characteristics are mentioned
in Table 2.
The mobile phase was degassed and filtered by passing
through a 0.45 lm pore size membrane filter (Millipore,
Milford, MA, USA) prior to use. All determinations were
performed at ambient temperature.
Standard solutions and calibration graphs
Materials and reagents
Standards of SAL, GUA, ASC, PAR, THE and AMB were
kindly supplied by Pharco Pharmaceuticals Co. (Alex, Egypt).
For combination I, BronchoventÒ syrup was obtained from
Pharco Pharmaceuticals Co. (Alex, Egypt), labeled to contain
2 mg SAL and 50 mg GUA per 5 ml. For combination II,
G.C.MOLä effervescent sachets were obtained from Pharco
Pharmaceuticals Co. (Alex, Egypt) and each sachet is labeled
to contain 250 mg ASC, 325 mg PAR and 100 mg GUA. For
combination III, FarcosolvinÒ syrup was obtained from
Pharco Pharmaceuticals Co. (Alex, Egypt), labeled to contain
For combination I, stock solutions were prepared by dissolving SAL and GUA in methanol to obtain concentrations of
100 and 200 mg%, respectively. For combination II, stock
solutions were prepared by dissolving ASC, PAR and GUA
in methanol to obtain concentrations of 20, 20, and 20 mg%,
respectively. For combination III, stock solutions were prepared by dissolving THE, GUA and AMB in methanol to obtain concentrations of 10, 10, and 20 mg%, respectively. These
stock solutions were further diluted with the mobile phase
(Table 1) to obtain working standard solutions of suitable
concentrations (corresponding to the linearity range stated in
Table 3 Regression and statistical parameters for the determination of drug combinations I, salbutamol sulfate (SAL) and
guaiphenesin (GUA), II, ascorbic acid (ASC), paracetamol (PAR) and guaiphenesin (GUA) and III, theophylline (THE), guaiphenesin
(GUA) and ambroxol hydrochloride (AMB) by the proposed HPLC methods.
Linearity range (lg/ml)
Regression data
a
b
Sy/xd
Sae
Sbf
LODg (lg/ml)
LOQh (lg/ml)
c
a
b
r
Combination I
SAL
8–600
GUA
10–500
À43,214
À51,505
169,666
292,280
0.9995
0.9994
132,456
139,546
87,731
88,610
2606
5792
5.00
5.00
8.00
9.00
Combination II
ASC
4–100
PAR
1–60
GUA
2–75
À31,263
À72,934
1016
499,467
15,50,820
15,06,982
0.9992
0.9995
0.9992
31,033
92,807
37,006
321,452
97,606
38,954
11,668
27,249
35,334
2.00
0.20
0.50
4.00
0.90
2.00
Combination III
THE
0.5–40
GUA
1.5–45
AMB
1–80
2023
12,329
6862
334,825
240,105
110,185
0.9998
0.9998
0.9997
6628
5605
2465
5579
4718
2073
2751
2326
1407
0.30
0.40
0.40
0.40
1.20
0.60
a
b
c
d
e
f
g
h
Intercept.
Slope.
Correlation coefficient.
Standard deviation of residuals.
Standard deviation of intercept.
Standard deviation of slope.
Limit of detection.
Limit of quantitation.
124
M.A. Korany et al.
Table 4 Evaluation of the precision and accuracy for the determination of drug combinations I, salbutamol sulfate (SAL) and
guaiphenesin (GUA), II, ascorbic acid (ASC), paracetamol (PAR) and guaiphenesin (GUA) and III, theophylline (THE), guaiphenesin
(GUA) and ambroxol hydrochloride (AMB) in laboratory-made mixtures by the proposed HPLC methods.
Recovery (%) ± SDa
Nominal value in lab-made
mixture (lg/ml)
RSDb (%)
SAL
GUA
SAL
GUA
SAL
GUA
Combination I
400
300
20
10
8
20
100
500
400
500
99.6 ± 0.54
100.2 ± 1.12
100.8 ± 1.00
99.3 ± 0.36
99.6 ± 0.15
99.9 ± 0.54
101.5 ± 1.12
100.1 ± 1.00
99.2 ± 0.56
100.9 ± 0.25
0.54
1.12
1.00
0.36
0.15
0.54
1.12
1.00
0.56
0.25
ASC
PAR
GUA
ASC
PAR
GUA
ASC
PAR
GUA
Combination
10
15
40
5
40
II
30
60
52
40
5
15
60
16
10
70
99.6 ± 0.21
99.9 ± 0.53
99.7 ± 1.00
100.1 ± 0.30
99.5 ± 0.12
99.6 ± 0.32
99.3 ± 0.53
99.9 ± 0.38
99.7 ± 0.55
100.2 ± 0.35
99.6 ± 0.46
99.6 ± 0.40
99.1 ± 0.45
99.1 ± 0.31
99.9 ± 0.25
0.21
0.53
1.00
0.30
0.12
0.32
0.53
0.38
0.55
0.35
0.46
0.40
0.45
0.31
0.25
THE
GUA
AMB
THE
GUA
AMB
THE
GUA
AMB
Combination
40
35
20
10
5
III
24
25
35
10
5
12
24
50
60
80
100.8 ± 0.84
100.9 ± 1.02
101.1 ± 1.10
98.8 ± 0.56
99.9 ± 0.75
100.1 ± 0.05
100.2 ± 1.00
100.1 ± 0.12
99.0 ± 0.10
100.2 ± 0.25
100.1 ± 0.73
100.1 ± 0.12
100.0 ± 0.32
99.9 ± 0.53
100.2 ± 0.14
0.84
1.02
1.10
0.56
0.75
0.05
1.00
0.12
0.10
0.25
0.73
0.12
0.32
0.53
0.14
a
b
Mean ± standard deviation of three determinations.
Percentage relative standard deviation.
Table 3). Triplicate 20-ll injections were made for each concentration and were chromatographed under the conditions
mentioned in Table 1. The area of each peak was plotted
against the corresponding concentration to obtain the calibration graph for each compound.
10-ml volumetric flasks and diluted to volume with the mobile
phase (Table 1) such that the ratios between drugs are as mentioned in Table 4. Triplicate 20-ll injections were made for
each mixture solution and were chromatographed under the
conditions described above in Table 1.
Assay of laboratory-made mixtures
Analysis of pharmaceutical formulations
Accurate volumes of each of SAL and GUA (combination I),
ASC, PAR and GUA (combination II) or of THE, GUA and
AMB (combination III) stock solutions were transferred into
For combination I, 0.5 ml of the syrup was accurately transferred into a 10-ml volumetric flask and completed to volume
with the mobile phase (Table 1). For combination (II), the
Table 5 Determination of drug combinations I, salbutamol sulfate (SAL) and guaiphenesin (GUA), II, ascorbic acid (ASC),
paracetamol (PAR) and guaiphenesin (GUA) and III, theophylline (THE), guaiphenesin (GUA) and ambroxol hydrochloride (AMB)
in pharmaceutical preparations by the proposed HPLC methods.
% Found ± SDa
Nominal value (lg/ml)
SAL
GUA
Combination I
20
ASC
PAR
SAL
500
RSDb (%)
GUA
99.4 ± 0.33
SAL
100.6 ± 0.52
GUA
0.33
0.52
GUA
ASC
PAR
GUA
ASC
PAR
GUA
Combination II
40
52
16
100.1 ± 0.36
99.9 ± 0.34
99.2 ± 0.61
0.36
0.34
0.61
THE
AMB
THE
GUA
AMB
THE
GUA
AMB
12
99.0 ± 0.26
99.8 ± 0.72
99.9 ± 0.47
0.26
0.72
0.47
GUA
Combination III
40
24
a
b
Mean ± standard deviation of five determinations.
Percentage relative standard deviation.
HPLC analysis of some cough-cold preparations
content of one sachet was accurately transferred into a beaker
containing 100 ml of water and left for 5 min till no effervescence
was observed then the clear solution was quantitatively transferred into 250-ml volumetric flask and completed to volume
with water. 0.4 ml of this stock solution was further diluted
to 10 ml in 10 ml volumetric flask using the corresponding mobile phase (Table 1). For combination III, 0.1 ml of the syrup
was diluted with the mobile phase (Table 1) to a 25 ml volumetric flask. The prepared solutions of the three combinations
were then chromatographed exactly as under the assay of mixtures containing combinations I, II and III as presented in
Table 5.
125
Results and discussion
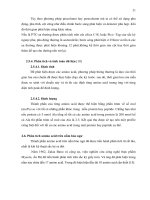
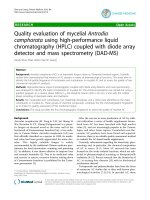
For combination I, an HPLC method was developed for the
simultaneous determination of SAL (0.4 mg/ml) and GUA
(10 mg/ml) in their syrup. The wavelength of 275 nm which
corresponds to kmax of SAL had to be used in the simultaneous
analysis, as the quantity of the drug, GUA was several times
higher than SAL. The selected method allowed the simultaneous determination of SAL and GUA peaks at retention
times of 2.86 and 4.90 min, respectively (Fig. 1).
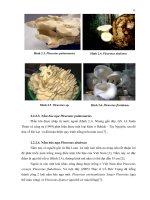
The wavelength of 225 nm was selected for the simultaneous determination of combination II components (250 mg
Fig. 1 A typical chromatogram of a 20 ll injection of a standard mixture of 300 lg/ml SAL (1) and 100 lg/ml GUA (2), combination I,
using the optimized mobile phase.
Fig. 2 A typical chromatogram of a 20 ll injection of a standard mixture of 5 lg/ml ASC (1), 15 lg/ml PAR (2) and 7.5 lg/ml GUA,
combination II, using the optimized mobile phase.
126
M.A. Korany et al.
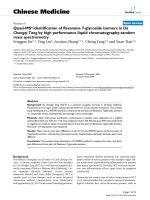
Fig. 3 A typical chromatogram of a 20 ll injection of a standard mixture of 35 lg/ml THE (1), 25 lg/ml GUA (2) and 24 lg/ml AMB,
combination III, using the optimized mobile phase.
(a)
SAL
GUA
25
35
ASC
PAR
30
GUA
Retention time (min)
Retention time (min)
(b)
30
20
15
10
5
25
20
15
10
5
0
0
15
25
35
10
45
30
Methanol (%)
(c)
18
70
THE
16
GUA
AMB
14
Retention time (min)
50
Methanol (%)
12
10
8
6
4
2
0
35
45
55
65
75
Methanol (%)
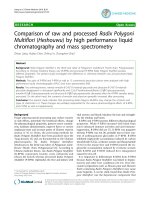
Fig. 4 Variation of the retention times of combinations: I (a), II (b) and III (c) components as a function of the percentage of methanol
in the mobile phase.
HPLC analysis of some cough-cold preparations
ASC, 325 mg PAR and 100 mg GUA per sachet) in the effervescent sachets with high sensitivity. Fig. 2 shows the typical
Fig. 5
127
chromatogram of a laboratory-made mixture of the three
compounds. The method permitted adequate resolution of
Variation of the retention times of combinations: I (a), II (b) and III (c) components as a function of the pH of the mobile phase.
Fig. 6 A chromatogram of the prepared syrup solution of 20 lg/ml SAL (1), and 500 lg/ml GUA (2), combination I, (a) methyl
paraben.
128
M.A. Korany et al.
the mixture components within reasonable run-time, ASC
being eluted at 2.0 min, PAR at 3.1 and GUA at 4.4 min.
The simultaneous determination of combination III components (THE (10 mg/ml), GUA (6 mg/ml) and AMB (3 mg/ml))
in their syrup required the application of the following
wavelength programming, 0–4.5 min at 225 nm then 4.5–
10 min at 248 nm which corresponds to kmax of AMB since
no intermediate wavelength could be used to analyze the three
components in the required proportions simultaneously. The
method allowed the determination of the mixture components
within a reasonable run-time. THE was eluted at 3.0 min,
GUA at 3.76 and AMB at 6.3 min (Fig. 3).
The chromatographic characteristics of the three combinations are summarized in Table 2 which indicates that the proposed HPLC methods permitted adequate resolution of the
mixtures’ components (good resolution and selectivity values)
within reasonable run-time (suitable capacity factors). In addition, high column efficiency was indicated from the large number of theoretical plates. The degree of peak asymmetry was
also evaluated using the tailing factor which did not exceed
the critical value (1.2) indicating acceptable degree of peak
asymmetry.
Optimization of chromatographic conditions
To optimize the HPLC assay conditions, for the three combinations, the effects of methanol percentage as well as the pH of
the mobile phase were studied.
Effect of methanol percentage in the mobile phase
The mobile phases used were 0.01 M sodium dihydrogenphosphate mixed with various proportions of methanol and
adjusted to pH values of 3.2, 6.2 or 3.8 for combinations I, II
and III, respectively. Mixtures of standards of the three
combinations were thus injected and run with mobile phases
of different composition. Fig. 4a–c show the retention times
obtained for combinations I, II and III, respectively as a func-
Fig. 7
tion of methanol percentage in the mobile phase. Methanol %
of 40, 50 and 60, for combinations I, II and III, respectively,
provided optimum resolution with the most symmetric and
well-defined peaks. At lower methanol content, separation
did occur but with marked tailing and prolonged retention
times. Increasing methanol content led to loss of resolution
and overlapped peaks in some cases.
Effect of pH
The influence of the pH of the mobile phase was studied by
using mobile phases consisting of mixtures of methanol and
0.01 M sodium dihydrogenphosphate in a ratio of (40: 60,
v/v), (50: 50, v/v) or (60: 40,v/v) for combinations I, II and III,
respectively at various pH values between 3.2 and 6.8 (adjusted
using 0.1 M ortho-phosphoric acid or sodium hydroxide).
These solutions were used as the mobile phases for standard
mixtures of the three combinations. The pH had only a
marked effect on the retention of SAL in combination I and
ASC in combination II, where increased pH values led to an
increase in the retention of SAL and a decrease in that of
ASC (Fig. 5a and b). A pH values of 3.2 and 6.2, for combinations I and II, respectively, were selected as they provided optimum resolution for both combinations. For combination III,
the pH had nearly no effect on the retention times of THE,
GUA and AMB (Fig. 5c). However, the separation was carried
out at pH 3.8 since the highest symmetry and peak height were
observed at such pH for AMB.
From the optimization of chromatographic conditions
mentioned above, experimental conditions were selected based
on best peak shape, highest symmetry, optimum resolution
along with reasonable run-time for the analysis of the three
combinations as follows; the mobile phase for the three combinations consisted of a mixture of methanol and 0.01 M aqueous phosphate buffer solution in a ratio of (40:60), (50:50) or
(60:40) for combinations I, II and III, respectively, all are v/v.
For combination I, the pH of the mobile phase was adjusted
to 3.2 and the separation was carried out at a flow rate of
A chromatogram of the prepared sachet solution of 40 lg/ml ASC (1), 52 lg/ml PAR (2) and 16 lg/ml GUA (3), combination II.
HPLC analysis of some cough-cold preparations
129
Fig. 8 A chromatogram of the prepared syrup solution of 40 lg/ml THE (1), 24 lg/ml GUA (2) and 12 lg/ml AMB (3), combination
III, (a) saccharin and (b) methyl paraben.
1.5 ml/min, with UV detection at 275 nm. For combination II,
the mobile phase was adjusted to pH 6.2 and a flow rate of
1.0 ml/min with UV detection at 225 nm was used. For combination III, the mobile phase was adjusted to pH 3.8 and a flow
rate of 1 ml/min, with wavelength programming, UV detection
at 225 nm for 4.5 min then at 248 nm for 5.5 min, was applied.
Statistical analysis of results
Concentration ranges and calibration graphs
Under the above described experimental conditions, linear
relationships were observed by plotting drug concentrations
against peak area for each compound, the corresponding concentration ranges for the three combinations are listed in Table 3.
The slopes, intercepts and correlation coefficients obtained by
the linear least squares regression treatment of the results
are also given. The high values of the correlation coefficients
(r values greater than 0.999) with negligible intercepts indicate
the good linearity of the calibration graphs. Standard deviations of residuals (Sy/x), of intercept (Sa), and of slope (Sb)
are presented for each compound. (Sy/x) is a measure of the extent of deviation of the found (measured) y-values from the
calculated ones. The Sy/x value is also involved in the calculation of Sa and Sb values [34].
Detection and quantitation limits
Limit of detection (LOD) is defined in the BP as the concentration which has a signal-to-noise ratio of 3:1. For limit of quantitation (LOQ), the ratio considered is 10:1 with an RSD value
less than 10%. LOD and LOQ for each compound were calculated and are presented in Table 3.
shown in Table 4 indicate good accuracy and precision of
the proposed procedure.
Analysis of pharmaceutical formulations
Assays of sample preparations for combinations I, II and III
were carried out as described under the Experimental section.
Then the prepared solutions were chromatographed under
the conditions described in Table 1. Figs. 6–8 represent the
chromatograms of the prepared pharmaceutical preparations
for combinations I, II and III, respectively. Excipients in the
preparations did not interfere in the analysis. For combination
I, the peak appearing at 7.90 min (a) corresponds to methyl
paraben preservative (Fig. 6) while for combination III, the
peaks appearing at 2.48 (a) and 4.71 min (b) correspond to
saccharin (sweatening agent) and methyl paraben (preservative), respectively (Fig. 8). The results obtained are listed in
Table 5. The accuracy and precision were satisfactory to the
label claim.
Conclusion
The proposed HPLC methods can be readily applied for the
simultaneous determination of SAL and GUA (combination I),
of ASC, PAR and GUA (combination II) or of THE, GUA
and AMB (combination III) in their laboratory-made mixtures and in pharmaceutical preparations. The proposed methods are specific and there is no interference from any of
the sample components. The methods are quite selective, sensitive and are suitable for routine quality control of the three
combinations. The proposed HPLC methods are more sensitive compared with the previously published methods [8,9] except for SAL [8].
Precision and accuracy
In order to assess the precision, as percentage relative standard
deviation (RSD%), and the accuracy, as percentage relative error (Er%), of the proposed HPLC method, triplicate determinations were carried out on laboratory-made mixtures of
different proportions, for the three combinations. The data
References
[1] Naidong W, Chen YL, Shou W, Jiang X. Importance of
injection solution composition for LC–MS–MS methods. J
Pharm Biomed Anal 2001;26(5–6):753–67.
130
[2] Sirichai S, Khanatharana P. Rapid analysis of clenbuterol,
salbutamol, procaterol and fenoterol in pharmaceuticals and
human
urine
by
capillary
electrophoresis.
Talanta
2008;76(5):1194–8.
[3] Ganjali MR, Norouzi P, Ghorbani M, Sepehri A. Fourier
transform cyclic voltammetric technique for monitoring
ultratrace amounts of salbutamol at gold ultra microelectrode
in flowing solutions. Talanta 2005;66(5):1225–33.
[4] Halabi A, Ferrayoli C, Palacio M, Dabbene V, Palacios S.
Validation of a chiral HPLC assay for (R)-salbutamol sulfate. J
Pharm Biomed Anal 2004;34(1):45–51.
[5] Fanali S, Catarcini P, Quaglia MG. Use of vancomycin silica
stationary phase in packed capillary electrochromatography: III.
Enantiomeric separation of basic compounds with the polar
organic mobile phase. Electrophoresis 2002;23(3):477–85.
[6] Ventura R, Ramı´ rez R, Monfort N, Segura J. Ultraperformance
liquid chromatography tandem mass spectrometric method for
direct quantification of salbutamol in urine samples in doping
control. J Pharm Biomed Anal 2009;50(5):886–90.
[7] Mazhar SHRA, Chrystyn H. New HPLC assay for urinary
salbutamol concentrations in samples collected post-inhalation.
J Pharm Biomed Anal 2009;50(2):175–82.
[8] El Gindy A, Emara S, Shaaban H. Development and validation
of chemometrics-assisted spectrophotometric and liquid
chromatographic methods for the simultaneous determination
of two multicomponent mixtures containing bronchodilator
drugs. J Pharm Biomed Anal 2007;43(3):973–82.
[9] El Gindy A, Emara S, Mostafa A. Application and validation of
chemometrics-assisted
spectrophotometry
and
liquid
chromatography for the simultaneous determination of sixcomponent pharmaceuticals. J Pharm Biomed Anal 2006;41(2):
421–30.
[10] Xu X, Stewart JT. MEKC determination of guaifenesin,
pseudoephedrine and dextromethorphan in a capsule dosage
form. J Liq Chromatogr Related Technol 2000;23(1):1–13.
[11] Schulte M, Strube J. Preparative enantioseparation by simulated
moving bed chromatography. J Chromatogr A 2001;906(1–2):
399–416.
[12] Stavchansky S, Demirbas S, Reyderman L, Chai CK.
Simultaneous determination of dextrorphan and guaifenesin in
human plasma by liquid chromatography with fluorescence
detection. J Pharm Biomed Anal 1995;13(7):919–25.
[13] Nova´kova´ L, Solichova´ D, Solich P. Hydrophilic interaction
liquid chromatography – charged aerosol detection as a straightforward solution for simultaneous analysis of ascorbic acid and
dehydroascorbic acid. J Chromatogr A 2009;1216(21):4574–81.
[14] Hu Q, Zhou T, Zhang L, Li H, Fang Y. Separation and
determination of three water-soluble vitamins in pharmaceutical
preparations
and
food
by
micellar
electrokinetic
chromatography with amperometric electrochemical detection.
Anal Chim Acta 2001;437(1):123–9.
[15] Li X, Franke AA. Fast HPLC-ECD analysis of ascorbic acid,
dehydroascorbic acid and uric acid. J Chromatogr B
2009;877(10):853–6.
[16] De Quiro´s ARB, Ferna´ndez Arias M, Lo´pez Herna´ndez J. A
screening method for the determination of ascorbic acid in fruit
juices and soft drinks. Food Chem 2009;116(2):509–12.
[17] Lavorante AF, Pires CK, Reis BF. Multicommuted flow system
employing pinch solenoid valves and micro-pumps. Spectrophotometric determination of paracetamol in pharmaceutical
formulations. J Pharm Biomed Anal 2006;42(4):423–9.
[18] McEvoy E, Donegan S, Power J, Altria K. Optimisation and
validation of a rapid and efficient microemulsion liquid
chromatographic (MELC) method for the determination of
paracetamol (acetaminophen) content in a suppository
formulation. J Pharm Biomed Anal 2007;44(1):137–43.
M.A. Korany et al.
[19] Ne´meth T, Jankovics P, Ne´meth Palota´s J, Koszegi Szalai H.
Determination of paracetamol and its main impurity 4-aminophenol in analgesic preparations by micellar electrokinetic
chromatography. J Pharm Biomed Anal 2008;47(4–5):746–9.
[20] Jensen LS, Valentine J, Milne RW, Evans AM. The
quantification of paracetamol, paracetamol glucuronide and
paracetamol sulphate in plasma and urine using a single highperformance liquid chromatography assay. J Pharm Biomed
Anal 2004;34(3):585–93.
[21] Evgen’ev MI, Budnikov GK. Electrochemical detection in highperformance liquid chromatography of organic compounds. J
Anal Chem 2000;55(11):1085–91.
[22] Huck CW, Guggenbichler W, Bonn GK. Analysis of caffeine,
theobromine and theophylline in coffee by near infrared
spectroscopy (NIRS) compared to high-performance liquid
chromatography (HPLC) coupled to mass spectrometry. Anal
Chim Acta 2005;538(1–2):195–203.
[23] Brunetto MDR, Gutie´rrez L, Delgado Y, Gallignani M,
Zambrano A, Go´mez A´, et al. Determination of theobromine,
theophylline and caffeine in cocoa samples by a highperformance liquid chromatographic method with on-line
sample cleanup in a switching-column system. Food Chem
2007;100(2):459–67.
[24] Guan Y, Wei W, Wang R, Luo G. Reversed phase-capillary
electrochromatographic determination of theophylline and
phenobarbital in aminophylline and lumina tablets. Fenxi
Huaxue 1999;27(1):100.
[25] Aresta A, Palmisano F, Zambonin CG. Simultaneous determination of caffeine, theobromine, theophylline, paraxanthine and
nicotine in human milk by liquid chromatography with diode
array UV detection. Food Chem 2005;93(1):177–81.
[26] Kanazawa H, Kizu J, Matsushima Y. Simultaneous
determination of theophylline and its metabolites by HPLC.
Yakugaku Zasshi 2000;120(10):1051–60.
[27] Kanazawa H, Atsumi R, Matsushima Y, Kizu J. Determination
of theophylline and its metabolites in biological samples by
liquid chromatography-mass spectrometry. J Chromatogr A
2000;870(1–2):87–96.
[28] Lee BL, Ong CN. Comparative analysis of tea catechins and
theaflavins by high-performance liquid chromatography and
capillary electrophoresis. J Chromatogr A 2000;881(1–2):
439–47.
[29] Kagan
MZ.
Normal-phase
high-performance
liquid
chromatographic separations using ethoxynonafluorobutane as
hexane alternative – I. Analytical and chiral applications. J
Chromatogr A 2001;918(2):293–302.
[30] Shenoy KPR, Krishnamurthy KS, Vasundhara I. HPLC
method for simultaneous determination of terbutaline,
guaiphenesin and ambroxol in formulations. Indian Drugs
2001;38(8):428–32.
[31] Shaikh KA, Patil SD, Devkhile AB. Development and
validation of a reversed-phase HPLC method for simultaneous
estimation of ambroxol hydrochloride and azithromycin in
tablet dosage form. J Pharm Biomed Anal 2008;48(5):1481–4.
[32] Wen A, Hang T, Chen S, Wang Z, Ding L, Tian Y, et al.
Simultaneous determination of amoxicillin and ambroxol in
human plasma by LC–MS/MS: validation and application to
pharmacokinetic study. J Pharm Biomed Anal 2008;48(3):
829–34.
[33] Shelke M, Sharma S, Beohar B, Sanghi SK. Simultaneous assay
of salbutamol sulphate and guaiphenesin in pharmaceutical
preparations by microbore column liquid chromatography.
Indian Drugs 2003;40(6):345–9.
[34] Miller JN, Miller JC. Statistics and chemometrics for analytical
chemistry. 4th ed. Harrow, UK: Pearson Education/Prentice-Hall;
2000.