Effects of red wine tannat on oxidative stress induced by glucose and fructose in erythrocytes in vitro
Bạn đang xem bản rút gọn của tài liệu. Xem và tải ngay bản đầy đủ của tài liệu tại đây (653.32 KB, 9 trang )
Int. J. Med. Sci. 2015, Vol. 12
Ivyspring
International Publisher
478
International Journal of Medical Sciences
Research Paper
2015; 12(6): 478-486. doi: 10.7150/ijms.10529
Effects of Red Wine Tannat on Oxidative Stress Induced
by Glucose and Fructose in Erythrocytes in Vitro
Camila Eliza Fernandes Pazzini 1, Ana Ceolin Colpo 2, Márcia Rósula Poetini 1, Cauê Ferreira Pires 1,
Vanessa Brum de Camargo 2, Andreas Sebastian Loureiro Mendez 3, Miriane Lucas Azevedo 1, Júlio César
Mendes Soares 1, Vanderlei Folmer 2,
1.
2.
3.
Universidade Federal do Pampa (UNIPAMPA), campus Itaqui, Rua Joaquim de Sá Brito, s/n, 97650-000, Itaqui, Brasil
Universidade Federal do Pampa (UNIPAMPA), campus Uruguaiana, BR 472, Km 592, 97500-970, Uruguaiana, Brasil
Universidade Federal do Rio Grande do Sul (UFRGS), Faculdade de Farmácia, Avenida Ipiranga 2752, 90610-000, Porto Alegre-RS, Brazil
Corresponding author: Tel.: +55 55 8111-1104; E-mail: Present address: Universidade Federal do Pampa
(UNIPAMPA), campus Uruguaiana, BR 472, KM 592, 97500-970 - Caixa Postal 118, Uruguaiana, Rio Grande do Sul, Brasil.
© 2015 Ivyspring International Publisher. Reproduction is permitted for personal, noncommercial use, provided that the article is in whole, unmodified, and properly cited.
See for terms and conditions.
Received: 2015.01.27; Accepted: 2015.02.09; Published: 2015.06.01
Abstract
The literature indicates that red wine presents in its composition several substances that are
beneficial to health. This study has investigated the antioxidant effects of Tannat red wine on
oxidative stress induced by glucose and fructose in erythrocytes in vitro, with the purpose to
determine some of its majoritarian phenolic compounds and its antioxidant capacity. Erythrocytes
were incubated using different concentrations of glucose and fructose in the presence or absence
of wine. From these erythrocytes were determined the production of thiobarbituric acid reactive
species (TBARS), glucose consumption, and osmotic fragility. Moreover, quantification of total
phenolic, gallic acid, caffeic acid, epicatechin, resveratrol, and DPPH scavenging activity in wine
were also assessed. Red wine showed high levels of polyphenols analyzed, as well as high antioxidant potential. Erythrocytes incubated with glucose and fructose had an increase in lipid peroxidation and this was prevented by the addition of wine. The wine increased glucose uptake into
erythrocytes and was able to decrease the osmotic fragility of erythrocytes incubated with
fructose. Altogether, these results suggest that wine leads to a reduction of the oxidative stress
induced by high concentrations of glucose and fructose.
Key words: Diabetes, antioxidant activity, phenolic compounds, lipid peroxidation, wine.
Introduction
Oxidative stress occurs when there is an imbalance between pro-oxidants and antioxidants in the
organism, so that, the first is predominant, producing
toxic or harmful compounds for tissue, denominated
free radicals or reactive oxygen species (ROS) [1]. The
excess of free radicals induces harmful effects such as
lipid peroxidation, damage to DNA, proteins, enzymes and carbohydrate [2]. Studies have shown a
strong relationship between hyperglycemia and oxidative stress [3,4,5,6]. Consequently, there is a great
deal of interest in foods that contain antioxidants and
health-promoting phytochemicals as potential therapeutic agents. In this context, several experiments,
both in vitro and in vivo, have been conducted with
numerous antioxidants components, including polyphenols from red wine [7,8].
This interest in phenolic compounds of wine
started in 1992 with the publication of the "French
Paradox” theory. In France, there is a high consumption of saturated fats, but mortality from heart disease
is a third lower than in the United Kingdom, for example. One of the French habits is drink red wine
with their main dishes, and this seems to be an important differential. A research conducted by Renaud
and De Longeril [9] observed low mortality from
heart disease associated with the consumption of this
Int. J. Med. Sci. 2015, Vol. 12
drink. Withehead et al, [10] revealed that the ingestion
of 300 mL red wine, led to an 18% increase in the serum antioxidant capacity after 1 hour. Moreover,
Napoli et al, [11] in a study made from nine diabetic
patients, who intake 360 mL of red wine per day for
two weeks, observed an improvement in insulin sensitivity.
Red wine presents in its composition more than
600 phenolic compounds that are beneficial to health.
However, the studies are limited primarily to the
presence of resveratrol, but other phenolic compounds such as flavonoids, quercetin and catechins,
integrated in large quantities the red wine. Furthermore, most studies evaluated the effects of this drink
for cardiovascular diseases prevention, making required additional studies to confirm the beneficial
effects of red wine in other diseases, such as Diabetes
mellitus.
Diabetes mellitus may cause a series of secondary complications, including atherosclerosis, renal
failure, cataract, retinopathy, and some others, which
are caused by oxidative stress generated by hyperglycemia (Brito and others 2007). So studies using
bioactive compounds that may be able to minimize
this process, are relevant. Thus, the aim of the present
study was to observe the antioxidant effect of Tannat
red wine (vintage 2006) produced in Itaqui – RS –
Brazil, according to oxidative stress induced by glucose and fructose in erythrocytes in vitro, in addition
to determine some of its majoritarian phenolic compounds (gallic acid, caffeic acid, epicatechin and
resveratrol) and their antioxidant capacity.
Materials and Methods
Red wine samples
Red wine used in this study was the Tannat
(2006 vintage), containing 13% (v/v) ethanol, provided by a winery, located in Itaqui (Rio Grande do
Sul – Brazil).
Chemicals
Thiobarbituric
acid
(TBA),
malonaldehyde-bis-dimethyl acetal (MDA), 2,2-diphenyl-1picrylhydrazyl (DPPH), caffeic acid, gallic acid, epicatechin and resveratrol were purchased from Sigma
Aldrich (St. Louis, MO, USA). Folin-Ciocalteau’s
phenol reagent was obtained from Merck (Darmstadt,
Germany).
Preparation of erythrocytes
Discarded blood bags have been donated by
transfusion agency located São Patricio Hospital,
Itaqui, Brazil. The experimental protocol of this study
was approved by the Ethics Committee of the Universidade Federal do Pampa (number 002 2012).
479
The test tubes containing 2.5 mL of erythrocytes
were centrifuged at 2,000 g for five minutes and the
supernatant was replaced by saline solution 0.9%
NaCl in the same proportion. This procedure was
performed twice, after, the red blood cells where resuspended with a hematocrit 50% (erythrocyte suspension: solution 0.9% NaCl, v/v), and fructose or
glucose concentrations corresponding to 5, 10, 30 and
100 mM, in 100 mM Tris-HCl buffer (pH 7.4). These
values were defined based on other studies that investigate the effects of high glucose and fructose
concentrations in vitro [12,13].
Erythrocytes were incubated at 37 ºC for 24
hours in the presence or absence of red wine in
amounts of 0.075, 0.15 and 0.225 mL of wine/mL incubated erythrocytes. This corresponds to 0.33, 0.66
and 0.99 mg/L GAE of total polyphenols, conforming
to the respective of wine volumes used. The wine
quantities used were calculated based on a wine
consumption of 150, 300 and 450 mL (one, two and
three glasses, respectively) for an adult man (average
body weight of 70 kg) containing around 5 liters of
blood circulating in his body. So, we made a linear
interpolation to calculate the amount of wine being
incubated with 2.5 mL of erythrocytes.
According to the World Health Organization
(WHO) [14] the moderate wine consumption (one or
two glasses) represents low risk for the onset diseases.
This explains the volumes used in our study (lower,
intermediate and higher volume of wine).
Evaluation of lipid peroxidation
Production of thiobarbituric acid reactive species
(TBARS) was determined according to Ohkawa et al,
[15]. Briefly, after washing erythrocytes with 0.9%
NaCl twice, the samples, containing glucose or fructose, added or not of red wine in the volumes described above, were precipitated with 40% acetic acid
in the ratio 1:2 and centrifuged at 2,000 g for separating from the supernatant. The amount TBARS produced was measured in spectrophotometer Biospectro
UV-Vis, model SP-220 (Curitiba, PR, Brazil), at 532
nm, using malondialdeide (MDA) to construct standards curves.
Quantification of glucose uptake
The quantification of glucose uptake is based on
the disappearance of glucose in erythrocytes quantitated before and after incubation for 24 hours. We
used a glucose oxidase enzymatic colorimetric kit
(Labtest, Minas Gerais, Brazil).
Osmotic fragility test
After incubation of the erythrocytes with the
same concentration of glucose or fructose (5, 10, 30
and 100 mM) and red wine (0.075, 0.15 and 0.225 mL
Int. J. Med. Sci. 2015, Vol. 12
480
of wine/mL incubated erythrocytes) were washed
with 150 mM NaCl solution (twice) and tested for
osmotic fragility. The resistance of erythrocytes to
hemolysis was evaluated by measuring as a function
of decreasing NaCl concentration. According to Fernandez and Fink [16] it was determined the concentration of hemoglobin in the supernatant using a
commercial kit (Labtest, Minas Gerais, Brazil).
In order to discard the interference of phenolic
compounds in preventing the hemoglobin oxidation
by cyanide of the Drabkin's solution, an assay was
performed measuring hemoglobin from erythrocytes
incubated with wine, adding 0.5 mM of hydrogen
peroxide plus 2.5 mM of sodium azide.
25 ± 1 °C.
For standard preparation, gallic acid, caffeic acid, epicatechin, and resveratrol were dissolved in
ethanol and mixed to obtain a solution containing
gallic acid at 120.0 µg/mL and other standards at
200.0 µg/mL. For wine analysis, the samples were
injected directly, as marketed. All solutions were filtered through a 0.45-μm membrane filter from Millipore (Milford, MA, United States) before injection.
The quantitation of compounds is also based on some
references applied to wine samples, whose concentration range and limits of detection and quantitation
were established [20,19,21,22] .
Determination of phenolics in wine
Free radical scavenging activities of wine were
measured by the DPPH assay described by
Brand-Williams et al, [23]. A volume of 100 mL of red
wine was added to 3.9 mL of methanol solution of
DPPH. The tubes were agitated and kept in the dark
for 30 min before reading at 517 nm in a spectrophotometer Biospectro UV-Vis, model SP-220 (Curitiba,
PR, Brazil).
The antioxidant capacity was represented as %
radical scavenging capacity (RSC) remaining after 30
min of reaction according to the following equation:
The concentration of total polyphenols was determined by the colorimetric method of Folin-Ciocalteau described by Singleton and Rossi [17].
The concentration of phenolic compounds was expressed as gallic acid equivalents (GAE). UV-Vis absorbance was measured in a Perkin Elmer Lambda 35
UV/Vis Double array Spectrophotometer (Norwalk,
CT, United Sates) with 1-cm quartz cells. The anthocyanins were evaluated by the method described by
Lee and Francis [18] with modifications, conducting
readings in a spectrophotometer Biospectro UV-Vis
model SP-220 (Curitiba, PR, Brazil) at 520 nm, results
were expressed in mg/L of wine.
Caffeic acid, gallic acid, epicatechin, and
resveratrol were also quantified by HPLC in a Prominence Liquid Chromatograph Shimadzu (Shimadzu
Corporation, Kyoto, Japan) equipped with a LC-20AT
pump, a SIL-20A auto sampler, a SPD-20AT PDA
detector and a CTO-20A column oven. LC Solution V.
1.24 SP1 system software was used to control the
equipment and to obtain data and responses from the
LC system.
A reversed phase ODS-Hypersil Thermo Scientific C18 column (250 x 4.6 mm i.d., 5-µm particle size)
(Bellefonte, United States) was used for chromatographic separation. The analyses were performed
according to the procedure previously described by
Quirós et al, [19] in a gradient elution mode with a 0.8
mL/min flow, employing two mobile phases: A (water/acetonitrile/acetic acid, 67:32:1, v/v/v) and B
(water/acetic acid, 99:1, v/v). The gradient profile
was 0-4 min, 20-30% A and 80-70% B; 4-8 min, 30-40%
A and 70-60% B; 8-12 min, 40-65% A and 60-35% B;
12-16 min, 65-80% A and 35-20% B; 16-20 min, 80-95%
A and 20-5% B; 20-22 min, 95-97% A and 5-3% B; 22-24
min, 97-100% A and 3-0% B; and 24-35 min, 100% A,
followed by re-equilibration of the column for 5 min.
Detection was performed at 280 nm. The injection
volume was 20 µL and all analyses were conducted at
DPPH radical scavenging assay
where absorbance of control represents the absorbance of the DPPH solution alone measured at zero
time, and absorbance of sample is the absorbance for
each sample 30 min after the addition of the DPPH
solution.
Statistical analysis
Graphpad Prism 5 software was used for statistical analysis and for plotting graphs. The results were
analyzed using one-way ANOVA. Differences between groups were determined using Bonferroni´s
post hoc test. Differences were considered statistically
significant at p < 0.05. All data are reported as mean ±
standard deviation (S.D.).
Results and discussion
Polyphenols, phenolic compounds and free
radical scavenging (DPPH)
Red wines made from Vitis vinifera cv. Tannat
grapes, are known to possess high contents of tannins
and have an intense color due to the presence of pigments such as anthocyanins [24]. The concentration of
total anthocyanins found in this study was 107.2
mg/L (Table 1). Concentration lower than observed
by Zocche [25], who used similar methodology to our
study with cv. Tannat wines (2008 vintage) of Rio
Int. J. Med. Sci. 2015, Vol. 12
481
Grande do Sul, whose concentration obtained was
667.36 mg/L. This fact may be explained by the wine
age investigated, because anthocyanins are responsible for the intense color of young red wines. Meanwhile, they are combined among themselves or with
other tannins present in wine, producing larger molecules that tend to precipitate over time. Thus, the
wines will become less stained, acquiring a brownish
red tint [27, 26]. Another study carried out by McRae
et al, [27] investigated the color parameters, concentrations of tannins and anthocyanins, and tannins
composition of a 50 year series of Cabernet Sauvignon
wines from Australia confirmed this effect. They
found a concentration of anthocyanins less than 200
mg/L for wines with age of 5 years and 627 mg/L for
younger wine.
The concentration of total polyphenols is also
shown in Table 1. Tannat wine contained high concentration of total phenolics (4,410 mg/L GAE) and,
this concentration was greater than obtained by
Freitas [28] in his study with Tannat wines from Bento
Gonçalves (RS, Brazil), whose value obtained was
2,282.2 mg/L GAE. Polyphenols are responsible for
protecting plants from physical attacks, as the sun’s
ultraviolet radiation and biological attacks by fungi,
bacteria and viruses, and they are distributed in the
leaves, seed and the grapes skin. Its concentration in
the wine depends on several factors including the
grape variety, weather conditions, grapes cultivation
techniques and winemaking [1]. A factor that may
have favored the biosynthesis of polyphenols in the
Campaign Gaúcha is that during budding and flowering of wines the days are sunny, dry and there is
little precipitation, unlike Bento Gonçalves, were this
period is characterized by exacerbated rain. This explains the high concentrations of polyphenols found
in the analyzed wine.
Table 1: Polyphenolic constituents and free radical scavenging
(DPPH) of the red wine Tannat (vintage 2006).
Total Polyphenols a
Total Anthocyanins b
Gallic Acid c
Caffeic Acid c
Epicatechin c
Resveratrol c
DPPH d
a
4,410 mg/L GAE
107.2 mg/L
12.63 mg/L
7.81 mg/L
26.55 mg/L
9.08 mg/L
71%
Method of Folin-Ciocalteau; b Lee & Francis (1972); c HPLC; d DPPH assay
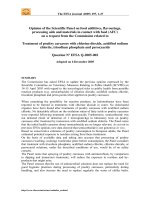
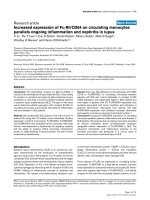
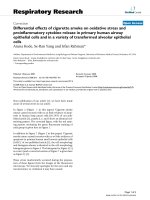
The chromatogram illustrated in Figure 1 shows
the presence of gallic acid, caffeic acid, epicatechin,
and resveratrol, identified by their retention times
(about 6, 20, 21, and 30 minutes for 1, 2, 3, and 4 respectively) . Among phenolics, epicatechin (26.55
mg/L) and gallic acid (12.63 mg/L) were identified as
major compounds whereas, resveratrol (9.08 mg/L)
and caffeic acid (7.81 mg/L) showed a minor contribution in this wine (Table 1). Epicatechins are responsible for astringency, bitterness and the body of
wine as well as gallic acid antioxidant properties, antimicrobial and antimutagenic [29,1]. Similar results
were found by Fanzone et al, [30] obtaining values
between 15.6-20.9 mg/L of gallic acid and 21.1-30.8
mg/L of epicatechin for Argentinian Cabernet
Sauvignon wines.
Figure 1: HPLC chromatograms (detection at 280nm) showing the polyphenolic
constituents detected in Tannat red wine (vintage 2006). (A) Chromatogram of
standards; (B) chromatogram of polyphenolic constituents detected in wine. Peak
identification: (1) gallic acid; (2) caffeic acid; (3) epicatechin; (4) resveratrol.
Recently, caffeic acid and its derivatives have
attracted considerable attention because of their biological activity and pharmacological properties including antioxidative activities, such as metal chelating capacity [31]. Study has also confirmed that caffeic
acid has a copigmentation effect on anthocyanin and
that the antioxidant activity of the complex anthocyanin, caffeic acid, was greater than the antioxidant
activity of the anthocyanin alone [32]. The concentration of caffeic acid found in this study was similar to
the concentration found by Fanzone et al [30], for
Argentine wines.
Finally, we reference resveratrol, a polyphenol
mostly studied in recent years, and noticed in considerable concentrations (9.08 mg/L) in the wine analyzed. It is synthesized in grape skins in response to
stress caused by fungal attack, mechanical damage or
ultraviolet irradiation; moreover the incidence of
sunlight and little rainfall are climatic factors with
Int. J. Med. Sci. 2015, Vol. 12
marked performance in formation, content and class
of resveratrol [33]. Souto et al, [34] quantified, using
high performance liquid chromatography, the concentration of trans-resveratrol of 36 red wines samples
produced in southern Brazil and found a concentration between 0.82-5.75 mg/L, being the highest concentration for Sangiovese wine.
Importantly, the lack of studies correlating the
phenolic compounds present in red wine with situations of hyperglycemia in vitro or in vivo. From the few
studies, a large part investigates the effect of resveratrol on Diabetes Mellitus. Szkudelska and Szkudelski
[35] verified that the use of resveratrol for a long time
decreased the blood glucose in diabetic animals and,
interestingly, this compound did not affect glucose
levels in animals with normal glycemic level. Venturini et al, [36] in a red wine study (Merlot varietal)
containing 3.2 µg/ml resveratrol, observed that the
red wine provoked antioxidant effect in hippocampus
of diabetic rats.
Summarizing, Tannat wine showed good concentrations of polyphenols and a possible explanation
for this may be climatic conditions conducive to grape
growing, as low winter temperatures, which favors
the growth of these vines, low rainfall and sunny days
with temperatures above 18ºC in fall, which favors
flowering [37]. Between all of these climatic factors,
the most preponderant, for the development of the
grape berry, is sunlight. It influences the synthesis of a
key enzyme in the production of phenolic compounds, phenylalanine amonioliase - PAL. This enzyme has its activity increased in vegetables exposed
to stressful situations such as water deficit and incidence of sunlight [33]. In fact, in 2006, the weather in
Rio Grande do Sul was characterized by summer with
high temperatures, severe drought and rigorous
winter [38].
Finally, the radical scavenging activity of the
wine was tested using the DPPH assay and was observed that the antioxidant capacity of wine was 71%
(Table 1). In accordance to the classification described
by Melo et al, [39], there is a strong antioxidant capacity when the percentage of radical scavenging activity exceeds 70%.
In a study with 73 red wines of five Vitis vinifera
red grape varieties (Merlot, Malbec, Pinot Noir, Cabernet Sauvignon, and Syrah) from South America,
Granato et al, [40] using also the method of DPPH,
observed the highest antioxidant activity for the Cabernet Sauvignon from Brazil (66.44%), Syrah from
Argentina (64.12%) and Malbec from Chile (66.70%).
Our objectives are not to establish a correlation
between the phenolic constituents of Tannat wine and
its antioxidant capacity because we believe that this
good antioxidant potential of the analyzed wine is
482
due to the set of all polyphenols.
Lipid peroxidation assay
Lipid peroxidation occurs when there is a metabolic imbalance allowing ROS attack polyunsaturated fatty acids in cell membranes. This mechanism
results in changes of the membrane lipids and this
loses its architectural features to become firmer and
less flexible. With this, appear "ionic cracks" which
alter the membrane permeability and enhances the
indiscriminate flow of metabolites and cellular debris.
The degree of phospholipids peroxidation can be determined by the concentrations of malondialdehyde
(MDA) and the method commonly employed is the
thiobarbituric acid reactive substances (TBARS) [2].
Erythrocytes have high polyunsaturated fatty
acids contained in their membranes, and possess high
hemoglobin concentration. These characteristics make
human erythrocytes a good field of reference for the
study of biomembranes oxidation [41,6] demonstrating that ROS’ attack to the erythrocyte membrane
induces oxidation of lipids and proteins, and leads to
hemolysis [42].
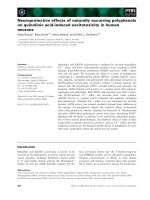
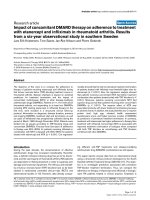
In our study lipid peroxidation in erythrocytes
was induced with glucose or fructose. The high glucose and fructose concentration resulted in a significant increase in erythrocytes TBARS levels (p < 0.05)
when compared to erythrocytes incubated with 5 mM
glucose or fructose (physiological condition) (Figure
2A and B). Similar result was observed by Salgueiro et
al, [6] in human erythrocytes incubated with high
glucose concentrations (250 and 500 mM), at both 24
and 48 hours incubation, and Soares et al [13], in research on ebselen and its modification in hemoglobin
glycation and osmotic fragility of blood at high concentrations of glucose or fructose. It has also been
shown that the auto-oxidation of glucose is an important source of free radicals in Diabetes Mellitus
[43,3,44]. In this study, this additional source of free
radicals generated by hyperglycemia is a plausible
contributing factor to the increased of TBARS levels.
In addition, increased glucose levels (above 9 mM)
activate the polyol pathway that leads to a depletion
of NADPH, which is highly detrimental to the erythrocyte [13].
The addition of different wine volumes provoked a significant decrease (p < 0.05) in MDA levels
of erythrocytes incubated with glucose (Figure 2A).
However, for the erythrocytes incubated with fructose, this effect was only observed for high fructose
concentrations (30 and 100 mM) (Figure 2B). We can
infer that red wine could prevent lipid peroxidation
caused by hyperglycemia. This advantage was observed until the lowest wine volume used (0.075 mL),
which can be considered a positive factor, since ex
Int. J. Med. Sci. 2015, Vol. 12
aggerated consumption of alcoholic beverages can be
detrimental. Similar results were observed for Montilla et al, [7] in experiments with diabetic Wistar rats
streptozotocin induced, and the protective effect of
red wine Montilla-Moriles on oxidative stress. This
red wine protective effect may be related to their high
content of polyphenols, which can interact with
membranes or reduce/counteract the formation of
ROS [6].
Effect of wine on erythrocytes incubated with
glucose
Figure 3A shows the glucose uptake before and
after incubation of erythrocytes with glucose during
24 hours at concentrations of 5, 10, 30 and 100 mM.
According to Habib and Othman [5], the glucose is
transported into erythrocytes by facilitated diffusion.
In Figure 3A can be seen that after 24 hours there
is a significant reduction (p < 0.05) in the concentration of glucose in erythrocytes incubated with 5 and
10 mM of glucose. This fact was not observed in
erythrocytes incubated with 30 and 100 mM of glucose. One possible explanation is that chronic hyperglycemia causes many changes in erythrocytes, such
as reduced life time, low deformability, aggregation of
red cells increased, reduction of cholesterol and sialic
acid of membrane [45]. Such changes can affect glucose uptake by erythrocytes. These alterations suffered by the erythrocytes in hyperglycemic conditions
may be attributed to oxidative stress, which may lead
to lipid peroxidation and osmotic fragility in vitro [45].
Another point to be discussed, in order to better understand, is that the lipid peroxidation and accumulation of MDA can disturb organization of phospholipids in the erythrocyte membrane bilayer, which
may lead to a decrease in glucose uptake by erythrocytes and, therefore, increase the glucose level in
483
plasma [2].
Figure 3B shows the glucose uptake after incubation of erythrocytes with glucose concentrations of
5, 10, 30 and 100 mM added to 0.075 mL of red wine.
A significant decrease (p < 0.05) can be observed in
glucose concentration in erythrocytes incubated with
100 mM of glucose in the presence of red wine. So, we
can infer that the consumption of glucose by the
erythrocytes incubated with high concentration of
glucose was reestablished, i.e., the wine was able to
prevent the inhibition of glucose uptake in erythrocytes. Erythrocytes added with the other volumes of
wine (0.15 and 0.225 mL) did not observe significant
changes (p > 0.05).
Wine has been extensively studied as a source of
phenolic compounds and adjuvant therapy for various diseases [1], but there are no in vitro studies investigating the specific effect of wine in glucose uptake. Habib and Othman [5] in a study with diabetic
patients and Rhaphanus sativa extract, observed that
glucose uptake by erythrocytes of diabetic patients
were decreased with increasing the glucose. This effect was reversed after the addition of 50 µL from the
extract mentioned.
Effect of wine on osmotic fragility of
erythrocytes
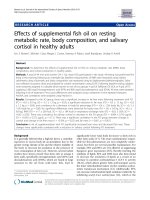
Hypotonic concentrations of NaCl induced progressive lyses on the erythrocytes, and previous incubation of erythrocytes for 24 hours with fructose (30
and 100 mM) caused a significant increase (p < 0.05) in
cell lyses when compared to erythrocytes exposed to
fructose 5 mM (Figure 4A). Red wine at different
volumes, partially suppressed fructose-induced hemolysis (Figure 4B and C). The osmotic fragility test
for erythrocytes incubated with glucose showed no
significant differences (p > 0.05) (data not shown).
Figure 2: Lipid peroxidation in erythrocytes incubated with different concentrations of glucose (A) or fructose (B) in presence or absence of wine. Tubes incubated only glucose
or fructose (I); tubes incubated with glucose or fructose and 0.075 mL of wine (II); tubes incubated with glucose or fructose and 0.15 mL of wine (III); tubes incubated with glucose
or fructose and 0.225 mL of wine (IV). * Significant at p < 0.05, compared with untreated erythrocytes (without addition of wine); ** significant at p < 0.05, Glucose 5mM vs
Glucose 100mM; Fructose 5mM vs Fructose 100mM incubated only glucose or fructose. Values are means ± SD.
Int. J. Med. Sci. 2015, Vol. 12
Figure 3: Glucose concentration in erythrocytes before and after incubation with
different glucose concentrations (5, 10, 30, and 100 mM) for 24 hours (A). Glucose
concentration in erythrocytes after incubation with different glucose concentrations
and 0.075 mL of wine for 24 hours (B). * Significant at p < 0.05, compared to
erythrocytes before incubation for 24 hours; ** significant at p < 0.05, compared with
untreated erythrocytes (without addition of wine). Values are means ± SD.
484
Erythrocytes are constantly exposed to reactive
oxygen species and this can be enhanced by hyperglycemia. A research carried out by Soares et al, [13]
indicate that patients with uncontrolled diabetes are
more sensitive to osmotic shock than from patients
with controlled diabetes and control subjects in relation to increased production of free radicals in vivo. As
previously discussed the oxidation of erythrocytes
has been extensively studied as a model of oxidative
damage to biomembranes, since the free radicals attack erythrocyte membranes, oxidizing lipids and
proteins. These alterations in membrane structure can
subsequently cause hemolysis [42].
The present study shows that erythrocytes exposed to high concentrations of fructose have increased susceptibility to osmotic lysis, which was also
accompanied by an increase of lipid peroxidation.
This was not observed in erythrocytes incubated with
glucose, since these have not had a significant increase
in osmotic fragility. The addition of different volumes
of red wine in erythrocytes incubated with the fructose were also able to reduce the osmotic fragility in
erythrocyte incubated with 30 and 100 mM fructose.
This is interesting because it has been shown that
ethanol can increase the rate of hemolysis by decreasing the hydrophobic force, which decreases the
membrane stability [46]. So we can say that the polyphenols present in large quantities in wine were able
to overcome this denaturing effect of ethanol, and also
reducing the osmotic fragility caused by high concentrations of fructose.
Figure 4: Osmotic fragility
test show hemoglobin levels in
supernatant of erythrocytes
incubated
with
different
fructose concentrations, in
presence or absence of wine
for 24h, submitted at decreasing NaCl concentration
hypotonic for 30 min at 37 °C.
Erythrocytes incubated with
different fructose concentrations (A). Erythrocytes incubated with 30 mM fructose
and different volumes of wine
(B). Erythrocytes incubated
with 100 mM fructose and
different volumes of wine(C).
* Significant at p < 0.05,
compared with erythrocytes
incubated with 5 mM; **
significant at p < 0.05, compared with erythrocytes
treated with fructose (without
addition of wine). Values are
means ± SD.
Int. J. Med. Sci. 2015, Vol. 12
Martínez et al, [41] demonstrated that grape
epicatechin stabilize the membrane through a decrease in lipid fluidity, blocking the access of the
peroxyl radical to erythrocyte membranes, which may
contribute to their ability to inhibit oxidative hemolysis. However, we believe that the antioxidant activity
of red wine may be assigned to the group of polyphenols present in this drink, and not any specific
compound. The effect of wine in hemolysis was also
confirmed by Tedesco et al, [42] in a study on the antioxidant effect of extract of red wine aged in oak
barrel with a high level of polyphenols on red blood
cells in vitro. They also noted the decrease in osmotic
fragility of erythrocytes incubated with 20 µL of extract of red wine aged in oak barrel.
Conclusions
The Tannat red wine produced in Itaqui (RS Brazil) showed high levels of bioactive compounds
and high total polyphenols content, as well as a good
antioxidant capacity. The wine was also able to attenuate oxidative stress in erythrocytes incubated
with glucose or fructose. We believe that the climatic
conditions of the region may be the key to explain the
results of this study, aiming for the importance of
geographical origin as a factor that indirectly acts on
the beneficial health effects, quality and the need to
encourage the production of wines from this region,
giving them their own identity.
Acknowledgements
485
5.
6.
7.
8.
9.
10.
11.
12.
13.
14.
15.
16.
17.
18.
19.
20.
21.
22.
The authors wish to acknowledge the
UNIPAMPA (Universidade Federal do Pampa),
FAPERGS (Fundação de Amparo a Pesquisa do Estado do Rio Grande do Sul), CAPES (Coordenação de
Aperfeiçoamento de Pessoal de Nível Superior) and
CNPq (Conselho Nacional de Desenvolvimento
Científico e Tecnológico) for their financial support.
We also thank Campos de Cima Winery (Itaqui, RS),
who kindly donated samples of Tannat red wine (2006
vintage).
28.
Competing Interests
29.
The authors have declared that no competing
interest exists.
References
1.
2.
3.
4.
Rodrigo R, Miranda A, Vergara L. Modulation of endogenous antioxidant
system by wine polyphenols in human disease. Clin Chim Acta. 2011;
412:410-24.
Halliwell B, Aeschbach R, Lölinger J, et al. The characterization on antioxidants. Food Chem Toxicol. 1995; 33:601-17.
Brito VB, Folmer V, Soares JCM, et al. Long-term sucrose and glucose consumption decreases the δ-aminolevulinate dehydratase activity in mice. Nutrition. 2007; 23: 818-26.
Brito VB, Rocha JBT, Puntel GO, et al. Inhibition of δ-aminolevulinate dehydratase is not closely related to the development of hyperglycemia in alloxan-induced diabetic mice. Exp Toxicol Pathol. 2011; 63: 443-51.
23.
24.
25.
26.
27.
30.
31.
32.
33.
34.
35.
Habib SA, Othman EM. In vitro upregulation of erythrocytes glucose uptake
by Rhaphanus sativa extract in diabetic patients. Biochimie. 2012; 94:1206-12.
Salgueiro ACF, Leal CQ, Bianchini MC, et al. The influence of Bauhinia forficata
Link subsp. pruinosa tea on lipid peroxidation and non-protein SH groups in
human erythrocytes exposed to high glucose concentrations. J Ethnopharmacol. 2013; 148(1): 81-7.
Montilla P, Barcos M, Muñoz MC, et al. Protective effect of Montilla-Moriles
appellation red wine on oxidative stress induced by streptozotocin in the rat. J
Nutr Biochem. 2004; 15:688-93.
Cimino F, Sulfaro V, Trombetta D, et al. Radical-scavenging capacity of several
Italian red wine. Food Chem. 2007; 103:75-81.
Renaud S, De Longeril M. Wine, alcohol, platelets, and the French paradox for
coronary heart disease. Lancet. 1992; 339:1523–6.
Withehead TP, Robinson D, Allaway S, et al. Effect of Red Wine Ingestion on
the Antioxidant Capacity of Serum. Clin Chem. 1995; 41:32-5.
Napoli R, Cozzolino D, Guardasole V, et al. Red wine consumption improves
insulin resistance but not endothelial function in type 2 diabetic patients. Metabolism. 2005; 54:306-13.
Gabriel D, Pivetta L, Folmer V, et al. Human erythrocyte δ-aminolevulinate
dehydratase inhibition by monosaccharides is not mediated by oxidation of
enzyme sulfhydryl groups. Cell Bioll Int. 2005; 29(8): 669–74.
Soares JCM, Folmer V, Rocha JBT, et al. Ebselen exhibits glycation-inhibiting
properties and protects against osmotic fragility of human erythrocytes in
vitro. Cell Biol Int. 2014; 38(5):625-30.
WHO. Global status report on alcohol and health. World Health Organization.
2011. ISBN 978 92 4 156415.
Ohkawa H, Ohishi H, Yagi K. Assay for lipid peroxide in animal tissues by
thiobarbituric acid reaction. Anal Biochem. 1979; 95:351-58.
Fernandez AA, Fink NE. Red blood cell osmotic fragility confidence intervals:
definition by application of a mathematical model. Clin Chem Lab Med. 2000;
38:433-36.
Singleton VL, Rossi JA Jr. Colorimetry of total phenolics with phosphomolybdic-phosphotungstic acid reagents. Am J Enol Viticult. 1965; 16:144-58.
Lee DH, Francis FJ. Standardization of Pigment Analyses in Cranberries.
HortScience. 1972; 7:83-4.
Quirós AR, López-Hernandéz J, Ferraces-Casais P, et al. Analysis of non
–anthocyanin phenolic compounds in wine samples using high performance
liquid chromatography with ultraviolet and fluorescence detection. J Sep Sci.
2007; 30:1262-6.
Faustini RS, Sobrattee S, Edel AL, et al. Comparative analysis of the phenolic
content of selected Chilean, Canadian and American Merlot red wines. Mol
Cell Biochem. 2003; 249:11-9.
Fanzone M, Peña-Neira A, Jofré V, et al. Phenolic Characterization of Malbec
Wines from Mendoza Province (Argentina). J Agric Food Chem. 2010;
58:2388-97.
Seruga M, Novak I, Jakobek L. Determination of polyphenols content and
antioxidant activity of some red wines by differential pulse voltammetry,
HPLC and spectrophotometric methods. Food Chem. 2011; 124:1208-16.
Brand-Williams W, Cuvelier ME, Berset C. Use of a free radical method to
evaluate antioxidant activity. LWT – Food Sci Technol. 1995; 28:25-30.
Boido E, Alcade-Eon C, Carrau F, et al. Aging Effect on the Pigment Composition and Color of Vitis vinifera L. cv. Tannat Wines. Contribution of the Main
Pigment Families to Wine Color. J Agric Food Chem. 2006; 54:6692-6704.
Zocche RGS. 2009. Potencial enológico de uvas Tannat, Cabernet Sauvignon e
Merlot produzidas no município de Bagé – RS. Ph.D. Thesis, Federal
University of Pelotas, Pelotas, Brazil.
McRae JM, Schulkin A, Kassara S, et al. Sensory Properties of Wine Tannin
Fractions: Implications for In-Mouth Sensory Properties. J Agric Food Chem.
2013; 61:719-27.
McRae JM, Dambergs RG, Kassara S, et al. Phenolic Compositions of 50 and 30
Year Sequences of Australian Red Wines: The Impact of Wine Age. J Agric
Food Chem. 2012; 60:10093-10102.
Freitas DM. Variação dos compostos fenólicos e de cor dos vinhos de uvas
(Vitis vinífera) tintas em diferentes ambientes. PhD Thesis, Federal University
of Santa Maria, Santa Maria, Brazil. 2006.
Kennedy JA, Saucier C, Glories Y. Grape and wine phenolics: history and
perspective. Am J Enol Viticult. 2006; 57:239-48.
Fanzone M, Peña-Neira A, Gil M, et al. Impact phenolic and polysaccharidic
composition commercial value of Argentinean Malbec and Cabernet Sauvignon wines. Food Res Int. 2012; 45:402-14.
Medina I, Undeland I, Larsson K, et al. Activity of caffeic acid in different fish
lipid matrices: A review. Food Chem. 2012; 131:730-40.
Gris EF, Ferreira EA, Falcão LD, et al. Caffeic acid copigmentation of anthocyanins from Cabernet Sauvignon grape extracts in model systems. Food
Chem. 2007; 100:1289-96.
Rocha HA, Guerra NB. Polifenóis em vinhos tintos: fatores envolvidos,
propriedades funcionais e biodisponibilidade. Revista Iberoamericana de
Tecnología Postcosecha. 2008; 9(2):93-105.
Souto AA, Carneiro MC, Sefrin M, et al. Determination of trans-resveratrol
concentrations in Brazilian red wines by HPLC. J Food Compos Anal. 2001;
14:441-5.
Szkudelska K, Szkudelski T. Resveratrol, obesity and diabetes. Eur J Pharmacol. 2010; 635:1-8.
Int. J. Med. Sci. 2015, Vol. 12
486
36. Venturini CD, Merlo S, Souto AA, et al. Resveratrol and red wine function as
antioxidants in the central nervous system without cellular proliferative effects during experimental diabetes. Oxid Med Cell Longev. 2010; 3:434-41.
37. Guerra CC, Mandelli F, Tonietto J, et al. Conhecendo o essencial sobre uvas e
vinhos. Embrapa uva e vinho. 2009; 48:1-69.
38. [Internet] Hackbart E. />cod_subsecao=47&cod_texto=464.
39. Melo EA, Lima VLAG, Maciel MIS, et al. Teores de polifenóis, ácido ascórbico
e carotenóides totais em frutas e hortaliças usualmente consumidas. Braz J
Food Technol. 2006; 9: 89-94.
40. Granato D, Katayama FCV, Castro IA. Phenolic composition of South American red wines classified according to their antioxidant activity, retail price and
sensory quality. Food Chem. 2011; 129:366-73.
41. Martínez V, Ugartondo V, Vinardell MP, et al. Grape epicatechin conjugates
prevent erythrocyte membrane protein oxidation. J Agric Food Chem. 2012;
60:4090-5.
42. Tedesco I, Russo M, Russo P, et al. Antioxidant effect of red wine polyphenols
on red blood cells. J Nutr Biochem. 2000; 11:114-9.
43. Wolff SP, Dean RT. Glucose autoxidation and protein modification— the
potential role of ‘autoxidative glycosylation’ in diabetes. Biochem J. 1987;
245:243–250.
44. Marar T. Amelioration of glucose induced hemolysis of human erythrocytes
by vitamin E. Chem-Biol Interac. 2011; 193:149-53.
45. Vahalkar GS, Haldankar VA. RBC membrane composition in insulin dependent diabetes mellitus in context of oxidative stress. Indian J Clin Biochem.
2008; 23:223-6.
46. Tyulina OV, Huenelman MJ, Prokopieva VD, et al. Does ethanol metabolism
affect erythrocyte hemolysis? Biochim Biophys Acta. 2000; 1535:69-77.