Assessment of drug bidding and the results of using bid winning drugs at 105 military hospital from 2015 to 2017
Bạn đang xem bản rút gọn của tài liệu. Xem và tải ngay bản đầy đủ của tài liệu tại đây (188.72 KB, 7 trang )
Journal of military pharmaco-medicine no9-2019
ASSESSMENT OF DRUG BIDDING AND THE RESULTS OF USING
BID-WINNING DRUGS AT 105 MILITARY HOSPITAL
FROM 2015 TO 2017
Ho Canh Hau1; Nguyen Minh Chính2; Hoang Hai2
Nguyen Thi Lan Huong1; Nguyen Thi Tam1
SUMMARY
Objectives: Assessing the procurement of drugs and the results of using drugs for bidding at
105 Military Hospital from 2015 to 2017. Methods: Using retrospective study plan and bidding
results for drug purchase. Results: Having develop a list of hospital drugs in 2015 of 545 items,
and 675 items in 2016, and 719 in 2017. Develop a list of bidding drugs: In terms of amounts, in
2015 it was 987 items/226 active ingredients, in 2016 it was 503 amounts/292 active
ingredients, in 2017 it was 642 items/386 active ingredients. Result of purchase: in 2015, it was
340 items, in 2016 it was 332 and in 2017 was 441 items. Results used for health insurance
subjects: 2015 was 356 items, 2016 was 354 items and in 2017 was 434 items. Conclusion:
Develop a list of hospital drugs in 2015 - 2017 from 545 to 719. Developing a list of bidding
drugs: not rational for 3 years. The result of buying increased from 340 to 441 items in period of
2015 - 2017.
* Keywords: Drug bidding; Purchase and use of bid-winning drug; 105 Military Hospital.
INTRODUCTION
Article 44 of the Law on Bidding No.
43/2013/QH13 states that “Centralized
procurement is a way of organizing
tenders widely to select contractors
through concentrated procurement units
in order to reduce costs, time and
clues. organize bidding, enhance the
professionalism in bidding, contribute to
increasing economic efficiency”[1]. Guiding
and implementing the Bidding Law No. 43
and Decree 63/2014/ND-CP [2] with Circular
No. 11/2016/TT-BYT providing regulations
on bidding for drugs at health facilities
and the Circular No. 09/2016/TT-BYT
issues 106 active ingredients required for
concentrated local procurement [3], [4].
According to the regulations on concentrated
drug biddings, there were 59 nationallevel bids, 106 local-level concentrated
biddings and 8 negotiated prices. Thus,
compared to 1,091 western medicines
(issued under Circular No. 09/2016),
medical facilities organize their bidding if
required.
1. 105 Military Hospital
2. Vietnam Military Medical University
Corresponding author: Ho Canh Hau (()
Date received: 01/10/2019
Date accepted: 27/11/2019
181
Journal of military pharmaco-medicine no9-2019
From 2015 to 2017, bidding at health
facilities will follow the guidance of
Circular No. 01/2012/TT-BYT [5] and
Circular No. 11/2016/TT-BYT (from July
1, 2016). During this period, evaluation of
the procurement of drugs and the use of
drugs at 105 Military Hospital which
practical and urgent in conducting the
bidding for the following years at the
research unit. Thus, the aims of this study
were: To assess the drug bidding and the
results of using bid-winning drugs at 105
Military Hospital from 2015 to 2017.
SUBJECTS AND METHODS
1. Subjects.
Legal documents, hospital drug list,
drug bidding list and bid-winning drugs list
at 105 Military Hospital from 2015 to 2017.
2. Methods.
Using retrospective method to evaluate
the drug bidding results and the drug
procurement through the bidding from the
list of hospital drugs, the list of bidding
drugs and the list of procurement by bid at
105 Military Hospital from 2015 to 2017.
RESULTS
From 2015 to 2017, 105 Military Hospital conducted extensive bidding to purchase
drugs. Evaluation of bidding and procurement of drugs by bid was shown below.
1. Develop a list of hospital drugs.
The hospital's drug list serves as a basis for developing a list of bidding and use drugs
during the year. From 2015 - 2017, the list of hospital drugs was shown in table 1.
Table 1: VEN analysis of the list of hospital drugs from 2015 - 2017.
Year
Group
2015
2016
2017
Amount
Ratio (%)
Amount
Ratio (%)
Amount
Ratio (%)
V
109
20.00
132
19.56
120
16.69
E
347
63.67
397
58.81
408
56.75
N
89
16.33
146
21.63
191
26.56
545
100.00
675
100.00
719
100.00
Total
The analysis results in table 1 showed:
- List of hospital drugs had been built
up year by year: 545 items in 2015, 675
items in 2016 and 719 items in 2017.
Thus, compared with 2015, the figure
increased by 130 items in 2016 and 174
items in 2017.
- The number of drugs in categories V
and E decreased, while the amount of
drugs in group N increased from 16.33%
in 2015 to 26.56% in 2017.
182
- The list of hospital drugs and the
process of increasing the amounts must
be selective, in accordance with the
following requirements:
+ Ensuring consistent with disease
patterns and costs of drugs used for
treatment in hospitals: Focusing on health
insurance subjects.
+ Appropriate in terms of technical
expertise: Grade 1 hospital.
Journal of military pharmaco-medicine no9-2019
+ Respond to new methods, new
techniques in treatment.
+ Limit the use of some drugs of great
value or drugs with serious adverse
reactions, drugs that are in doubt about
the effectiveness of treatment.
- It is necessary to cut down the drugs
in group N and strengthen the drug group
E (the essential medicine group). According
to the proposal of the project, it is
necessary to reduce the group of N drugs
to below 10% in order to concentrate
funding for group E.
2. Developing a list of bidding drugs.
* Compare the list of bidding drugs and the list of hospital drugs:
Table 2: Comparison of hospital drugs list and bidding list of drugs from 2015 - 2017.
Year
Index
2015
2016
2017
Amount
Active
Amount
Active
Amount
Active
The list of bidding drugs (1)
987
266
503
292
642
386
The list of hospital drugs (2)
545
456
675
474
719
512
181.10
58.33
74.52
61.60
89.29
75.39
% (1)/(2)
- Develop a list of bidding drugs compared to the list of hospital drugs with a number
of items accounting for 181.10% in 2015; 74.52% in 2016 and 2017 was 89.29%.
- The number of active ingredients accounted for 58.33 - 75.39% in 3 years. This result
showed that there was no link between the bidding list and the list of hospital drugs.
* Analysis of the list of bidding drugs according to ABC:
Table 3: List of bidding drugs according to ABC analysis from 2015 - 2017.
Year
2015
2016
2017
Amount (%)
Ratio (%)
Amount (%)
Ratio (%)
Amount (%)
Ratio (%)
A
13.58
75.02
14.91
75.22
18.69
75.14
B
15.40
15.03
16.50
15.04
16.04
15.00
C
71.02
9.95
68.59
9.74
65.26
9.86
100.00
100.00
100.00
100.00
100.00
100.00
Group
Total
- To achieve about 75% of funding (group A), the number of items in 2015
accounted for 13.58%, 14.91%; 18.69% in 2016 and 2017, respectively.
- To achieve about 10% of funding (group C), the number of items in 2015
accounted for 71.02%, 68.59% in 2016 and 65.26% in 2017.
The above results were not reasonable, showing that the percentage of group A in
the list of drugs for bidding next year was higher than the previous year, while group C
gradually decreased.
183
Journal of military pharmaco-medicine no9-2019
* Compare the number of items in the list of budding drugs with the list of hospital
drugs by VEN analysis:
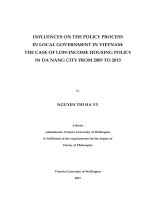
The percentage of groups V, E, N in the list of bidding drugs and the list of hospital
drugs from 2015 to 2017 was shown in figure 1.
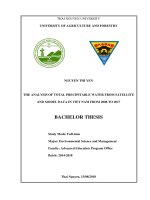
Figure 1: Percentage of groups V, E, N in the list of bidding drugs and the list of
hospital drugs.
- The percentage of groups V, E, N between bidding drugs and hospital drugs in a
year was quite different: Group V in 2015 was about 3% apart, 7% in 2016 and 4% in
2017. Group N in 2015 was about 6% different, about 3% in 2016 and 2% in 2017.
- In 3 years, the proportion of groups V, E, N in bidding drugs was not proportional.
Group V in 2015 was 22.49%, in 2016 it was 17.5% and in 2017 it was 28.35%. Group
N in 2015 was 22.90%, in 2016 it was 27.04% and in 2017 it was 22.27%.
3. List of purchased and used drugs.
* Compare the list of bid-winning drugs with the list of purchased drugs according to
ABC analysis:
Table 4: Comparison of bid-winning list and list of purchased medicines according to
ABC analysis from 2015 - 2017.
Year
Drug list
2015
2016
2017
A
B
C
A
B
C
A
B
C
Amount
134
152
701
75
83
345
120
103
419
Ratio %
13.58
15.40
71.02
14.91
16.50
68.59
18.69
16.04
65.26
Amount
41
48
251
48
52
232
68
67
306
Ratio %
12.06
14.12
73.82
14.46
15.66
69.88
15.42
15.19
69.39
Bidding
Purchased
184
Journal of military pharmaco-medicine no9-2019
- In order to achieve about 75% of the
cost for drugs of group A, the list of drugs
bidding for 3 years accounted for 13.58 18.69% of the total items, while the list of
purchased drugs according to bidding
results accounted for 12.06 - 15.42%.
- In order to achieve about 10% of the
cost for drugs of group C, the bidding list
from 2015 to 2017 accounted for 65.26 71.02% of the items, while the list of
purchased drugs accounted for 69,39 73.82%.
- There was no positive proportion
among drug groups A, B and C between
the bidding list and the procurement list
from 2015 - 2017.
- The use rate of high value drugs
(group A) increased year by year (from
12.06% to 15.42% in 2017).
* Compare the list of bid-winning drugs with the list of purchased drugs according to
VEN analysis:
Table 5: Comparing list of bid-winning drugs and list of purchased drugs according
to VEN analysis.
Year
Drug list
2015
2016
2017
V
E
N
V
E
N
V
E
N
Amount
226
539
222
136
279
88
143
317
182
Ratio %
22.90
54.61
22.49
27.04
55.47
17.50
22.27
49.38
28.35
Amount
81
180
79
106
165
61
120
244
77
Ratio %
23.82
52.94
23.24
31.93
49.70
18.37
27.21
55.33
17.46
Bidding
Purchased
In 2015, the list of bidding drugs and
the list of procured drugs was quite similar
in all 3 groups V, E, N. In 2016 and 2017,
the proportion among groups V, E, N was
different:
- In group V: The list of procured drugs
increased by around 5% compared to the
list of bidding drugs.
- In group E: In 2016, the list of
purchased medicines decreased by 6%
compared to the list of bidding drugs;
by 2017, on the contrary, the list of
purchased medicines increased by about
6% compared to the list of bidding drugs.
This result showed that the construction
of the bidding list of drugs was not close
to the demand for use in 2016 and 2017.
* Compare the list of bid-winning drugs
with the list of purchased drugs according
to ABC/VEN analysis:
Analysis of groups, of which group I
was AV, AE, AN, BV and CV (the most
important drug group), group II was BE,
BN and CE (important drug group) and
group III was CN (less important drug
group) in the ABC/VEN matrix as a
percentage of the number of items shown
in table 6.
185
Journal of military pharmaco-medicine no9-2019
Table 6: Comparing list of bid-winning drugs and list of drugs purchased according
to ABC/VEN analysis
Group
Purchased
2016
2017
I
II
III
I
II
III
I
II
III
Amount
327
505
155
193
254
56
229
299
114
Ratio %
33.13
51.17
15.70
38.37
50.50
11.13
35.67
46.57
17.76
Amount
113
175
54
140
151
41
169
219
53
Ratio (%)
33.24
50.88
15.88
42.17
42.48
12.35
38.32
49.66
12.02
Drug list
Bidding
2015
- The percentage of groups I and II of
bid-winning drugs completed quite similar.
In group III, the ratio fluctuated quite a lot:
in 2015, it accounted for 15.70%, in 2016
it decreased to 11.13%, in 2017 it
increased to 17.76%.
- Compare the percentage of bidwinning drugs with the percentage of
procurement: The proportion in all three
groups fluctuated slightly (the highest was
in group III, when the buying ratio was
lower than bidding at about 6%).
- Percentage of purchased drugs in
groups over 3 years of fluctuating was not
proportional. The results in group III (less
important drug group) decreased from
15.88% in 2015 to 12.02% in 2017. This
result showed that the hospital has paid
attention and cut down on less important
drugs in shopping.
* Results of procurement and use of
drugs for medical insurance subjects:
105 Military Hospital has examination
and treatment for 3 main subjects: Army policy; health insurance and medical
services. Depth analysis of drug use
results for health insurance subjects was
shown in table 7, 8.
Table 7: Medicine results used by origin of health insurance subjects.
Drugs
Indexes
Items
Value
(milion)
2015
2016
2017
DPM
ID
DPM
ID
DPM
ID
Amount
158
198
172
182
203
231
Ratio %
55.62
44.38
48.59
51.41
46.77
53.23
Value
4,207
12,234
5,744
15,500
9,865
22,333
Ratio %
25.59
74.41
27.04
72.96
30.64
69.36
(DPM: Domestically produced medicine; ID: Imported drugs)
The number of items of domestically procured drugs was equivalent to that of
imported drugs for 3 years, but the value of imported drugs always accounted for a
large proportion, about 70% in 3 years.
186
Journal of military pharmaco-medicine no9-2019
Table 8: Results of using brand-name drugs for medical insurance subjects.
(Unit: Million VND)
2015
Used drugs
2016
2017
Amount
Value
Amount
Value
Amount
Value
Brand name
30
2,192
48
5,607
49
9,343
Total drug
356
16.441
354
21.244
434
32.198
% brand name
8.43
13.33
13.56
26.39
11.29
29.02
The value of imported drugs has focused
mainly on the original brand-name drug.
The used items accounted for about 10%
in 3 years, but the used value increased
from 13.33% in 2015 to 29.02% in 2017.
- Results of the list of drugs used:
545 items in 2015, 673 items in 2016 and
719 items in 2017. In particular, the amount
of non-essential drugs (N) increased from
16.33% in 2015 to 26.56% in 2017.
From results of tables 7 and 8, it can
be demonstrated that:
- Implementing the bidding results: In
2015 and 2016, it exceeded 50% of the
bidding results, and in 2017 only achieved
about 50% of the bidding results.
- It is necessary to focus on managing
the amount of used drugs for the brandname drug group, because this is a highcost drug group, increasing the cost of
medical examination and treatment by
health insurance subjects.
- Priority should be given to the
development of domestically manufactured
drugs to reduce the cost of use of drugs,
and at the same time to meet the Ministry
of Health's "Vietnamese people give priority
to using Vietnamese drugs" project [6].
CONCLUSION
- Building a list of hospital drugs: 545
items in 2015, 673 items in 2016 and 719
items in 2017. In particular, the number of
items in non-essential medicine group (N)
increased from 16.33% in 2015 to 26.56%
in 2017.
- Building a list of bidding drugs: 987
items in 2015, 503 items in 2016 and 642
items in 2017. The active ingredient
accounted for 58.33 - 75.39% in 3 years.
REFERENCES
1. National Assembly. Bidding Law No.
43/2013/QH13. Entry into force July 1, 2014.
2013.
2. Government. Decree No. 63/2014/NĐ-CP.
Detailing a number of articles of the Bidding
Law regarding contractor selection. 2014, June 26.
3. Ministry of Health. Circular No.
11/2016/TT-BYT. Regulate the bidding for
drugs at public health facilities. 2016, May 11.
4. Ministry of Health. Circular No.
09/2016/TT-BYT. Promulgate the list of
concentrated bidding drugs and the list of drugs
subject to price negotiation. 2016, May 5.
5. Ministry of Health. Circular No.
01/2012/TTLT-BYT-BTC. Guidance on bidding
for purchasing drugs in health facilities. 2012,
January 19.
6. Ministry of Health. Decision No.
4824/QD-BYT dated December 3, 2012 of the
Minister of Health, approving the project
"Vietnamese people give priority to using
Vietnamese drugs. 2012.
187