Differential microRNA profiles predict diabetic nephropathy progression in Taiwan
Bạn đang xem bản rút gọn của tài liệu. Xem và tải ngay bản đầy đủ của tài liệu tại đây (763.92 KB, 9 trang )
Int. J. Med. Sci. 2016, Vol. 13
Ivyspring
International Publisher
457
International Journal of Medical Sciences
Research Paper
2016; 13(6): 457-465. doi: 10.7150/ijms.15548
Differential microRNA Profiles Predict Diabetic
Nephropathy Progression in Taiwan
Hung-Yu Chien1*, Chang-Yi Chen2*, Yen-Hui Chiu3, Yi-Chun Lin4,5, Wan-Chun Li2,3
1.
2.
3.
4.
5.
Department of Endocrinology & Metabolism, Taipei City Hospital, Ren-Ai Branch, Taipei, Taiwan;
Institute of Oral Biology and Department of Dentistry, School of Dentistry, National Yang-Ming University, Taipei, Taiwan;
Department of Education and Research, Taipei City Hospital, Taipei, Taiwan;
Division of Endocrinology &Metabolism, Taipei Veterans General Hospital, Taipei, Taiwan;
Faculty of Medicine, National Yang-Ming University, Taipei, Taiwan;
*These authors contributed equally.
Corresponding author: Wan-Chun Li, Ph.D. Institute of Oral Biology and Department of Dentistry, School of Dentistry, National Yang-Ming University,
No.155, Sec.2, Li-Nong St, Taipei, 11221, Taiwan. Phone: +886-2-28267255; Fax: +886-2-28264053; E-mail:
© Ivyspring International Publisher. Reproduction is permitted for personal, noncommercial use, provided that the article is in whole, unmodified, and properly cited. See
for terms and conditions.
Received: 2016.03.15; Accepted: 2016.05.09; Published: 2016.06.01
Abstract
Objectives: Diabetic nephropathy (DN) is a major leading cause of kidney failure. Recent studies
showed that serological microRNAs (miRs) could be utilized as biomarkers to identify disease
pathogenesis; the DN-related miRs, however, remained to be explored. Methods: A prospective
case-control study was conducted. The clinical significance of five potential miRs (miR-21, miR-29a,
miR-29b, miR-29c and miR192) in type 2 Diabetes Mellitus (T2DM) patients who have existing
diabetic retinopathy with differential Albumin:Creatinine Ratio (ACR) and estimated Glomerular
Filtration Rate (eGFR) was performed using quantitative RT-PCR analysis. The subjects with
diabetic retinopathy enrolled in Taipei City Hospital, Taiwan, were classified into groups of normal
albuminuria (ACR<30mg/g; N=12); microalbuminuria (30mg/g
(eGFR>60ml/min). The level of serum miRs was statistically correlated with age, Glucose AC,
ACR, eGFR and DN progression. Results: The levels of miR-21, miR-29a and miR-192 were
significantly enriched in the overt proteinuria group compared with microalbuminuria and/or overt
proteinuria groups. It was shown that only miR-21 level was significantly up-regulated in low-eGFR
group compared with high-eGFR patients. Interestingly, Pearson’s correlation coefficient analysis
demonstrated that DN progressors showed significantly greater levels of miR-21, miR-29a,
miR-29b and miR-29c in comparison with non-progressors implying the clinical potential of DN
associated miRs in monitoring and preventing disease advancement. Conclusion: Our findings
showed that miR-21, miR-29a/b/c and miR-192 could reflect DN pathogenesis and serve as
biomarkers during DN progression.
Key words: Albumin:creatinine ratio, Biomarkers, Circulating microRNA, Diabetic nephropathy, Estimated
Glomerular Filtration Rate.
Introduction
Over past decades, the incidence of type 2
diabetes mellitus (T2DM) has increased exponentially,
especially in developed countries [1, 2]. Many studies
have found that DM mediated microvascular and
macrovascular pathological conditions could result in
different complications leading to a great morbidity in
T2DM subjects [3, 4]. It is estimated approximate 40%
of T2DM patients develop diabetic nephropathy (DN)
and the current clinical managements of DN are
imperfect in delaying disease process and around 40%
of DN subjects progress to end-stage renal disease [5].
The pathogenesis of DN involves the deregulation of
various biological functions such as endothelial
dysfunction, oxidative stress and the excess
accumulation and deposition of extracellular matrix
(ECM) in kidney [6].
Int. J. Med. Sci. 2016, Vol. 13
The clinical features of DN include persistent
albuminuria and progressive decline of glomerular
filtration rates (GFR). While microalbuminuria
(30-300 mg/day) could be detected in early, reversible
DN subjects, overt proteinuria (>300 mg/day)
represents an irreversible stage of DN [7, 8]. The
detection of microalbuminuria is the standard method
for the diagnosis of early-staged DN; however, it has
some drawbacks. For example, microalbuminuria can
develop when advanced pathological conditions have
already been established, as assessed by renal biopsy
examinations. In addition, it was found that the
degree of albuminuria does not closely correlate with
the GFR decrement suggesting the unreliability to
utilize urinary albumin content as DN prognostic
indicator [9]. It therefore becomes essential to define
the early molecular changes in DM patients who are
prone to develop progressive renal complications,
defined as progressor, compared with non-progressor
in order to monitor disease status in-time. Indeed,
previous studies using proteomic analysis have
defined candidate diagnostic proteins in urine from
normoalbuminuric T2DM subjects who subsequently
developed DN. However, the procedure is less than
ideal to monitor the DN progression because it is
time-consuming and could only target proteins
abundantly expressed in urine [10, 11]. Thus, more
sensitive biomarkers with relative minimal invasive
sampling and simple experimentation procedure for
detection of early staged DN are particularly
desirable.
In addition to serological or urinary proteins,
recent studies have found that circulating nucleic
acids represented potential indicators for disease
diagnosis [12, 13]. Among them, microRNA (miR) is a
new class of small single-stranded RNAs. Over 3,500
miRs have been discovered in the human genome and
more than 90% of protein encoding mRNAs could be
regulated by miRs in a tissue- and/or cell-specific
manner [14]. miRs are 19–25-nucleotide-long
non-coding RNA molecules that normally bind to the
3’ untranslated region (3’-UTR) of their target mRNAs
leading to mRNA degradation and/or translational
inhibition [15-17]. As a result, miRs could regulate a
wide
range
of
biological
events
and
onset/progression of different diseases [18]. Although
miR in serum or plasma seems promising to be
utilized as a biomarker to identify disease initiation
and progression, compared with cancer and
cardiovascular disease, far less is known about the
relevance of circulating miRs in DM complications.
The significance of circulating miRs to delineate
pathogenesis of DN was still poorly understood even
though the potential DN-related miRs are elucidated
in recent studies. Some controversial data and lack of
458
information on human subjects, however, limited
their usefulness as biomarker for diagnosis of DN
progression.
In the present study, we therefore conducted a
case control study to examine differential levels of a
number of candidate circulating miRs from different
staged DN patients, with coexisting diabetic
retinopathy, aiming to identify the early predictor for
DN progression. Recent studies have defined the
importance of miR-21, miR-29 family and miR-192 in
normal renal development, kidney function and the
association of various renal diseases suggesting that
these miRs might be good targets to monitor DN
pathology. To the best of our knowledge, to date, no
studies were yet reported to define the correlation
between the level of these potential DN-related miRs
and the disease progression further highlighting the
requirement to examine the association of the
serological miRs and DN pathogenesis in human
subjects.
Materials and Methods
Study population
Patient sera were collected under the approval of
Institutional Review Board (IRB) of Taipei City
Hospital, Taiwan (TCHIRB-1010718). All patients
were recruited from the Endocrinology and
Metabolism outpatient clinic and divided into three
groups according to albumin:creatinine ratio (ACR,
mg/g) or estimated glomerular filtration rate (eGFR;
ml/min) and followed up longitudinally at least for 2
years. The patients with ACR<30 mg/g was classified
as normoalbuminuria, the values of 30
ACR over 300 mg/g are overt proteinuria. To set a
more stringent classification, the participants were
divided into two groups: low-eGFR (<60ml/min) and
high-eGFR (>60ml/min) based on values of eGFR.
The MDRD method was used to estimate eGFR levels
using a formula: 186 x (serum creatinine level)–1.154 x
(age)–0.203 x 0.742 (if female). Patients with underlying
malignancies, kidney disease history and other
systemic diseases were excluded from this study.
Renal sonographic analysis have been carried out by
nephrologists to further verify DN. All of the patients
had received fundoscopic examination to access for
diabetic retinopathy and all (21/21) of the patients in
overt
proteinuria
group,
all
(17/17)
of
microalbuminuria
group
and
11/12
of
normoalbuminuria group had coexisting diabetic
retinopathy. All patients with DN received
angiotensin converting enzyme inhibitors or
angiotensin receptor blockers accordingly unless
contraindicated. Other clinical criteria including age,
Int. J. Med. Sci. 2016, Vol. 13
glucose AC, HbAlc and creatinine levels were also
recorded to provide better evaluation for this study.
Serum collection and microRNA isolation
Serum was isolated from patients’ peripheral
blood and stored in RNase/DNase-free tubes at -80℃
until RNA isolation. Total RNA containing small
RNA was isolated from 500 μl of serum using
mirVana isolation kit (Ambion) following the
manufacturer’s instructions with modifications. In
brief, the collected serum was firstly mixed with
Denaturing Solution containing 2-mercaptoethanol
followed by the addition of Acid-Phenol/Chloroform
and ethanol to precipitate total RNA and eluted in
nuclease-free water. For small RNA isolation, total
RNA was then incubated with miRNA Wash
Solutions without pre-amplification and then eluted
in appropriate volume of nuclease-free water. The
samples were stored in -20℃ until use.
Quantitative Real-Time Polymerase Chain
Reaction (qRT-PCR) Analysis
The amount of 10 μg of miR was reverse
transcribed to complementary DNA (cDNA) using
the TaqMan MicroRNA Reverse Transcription Kit
(Thermo Scientific) and miRNA-specific stem-loop
primers following the manufacturer’s instructions.
The qPCR analysis was performed in duplicate with
the ABI 7500 Fast Real-Time PCR system using the
TaqMan Universal Master Mix II, no UNG kit
(Thermo Fisher Scientific). All PCR primers were
obtained from Thermo Scientific (Supplementary
Table S1). Each reaction included cDNA template,
TaqMan Universal Master Mix II, TaqMan Gene
Expression Assay and nuclease-free water in the final
volume of 20μl. The internal control gene, non-coding
small RNA U6 snRNA, was used according to the
Applied Biosystems Application Note. The difference
of Ct between the target miRs and U6 snRNA (ΔCt)
equivalent to the ratio of log2-transformed absolute
copy numbers was employed to show the relative
expression levels of the target miRNAs. The
recommended reaction conditions were set according
to the manufacturer’s protocol (50℃ for 2 mins, 95℃
for 10 mins, 40 cycles of 95℃ for 15 secs and 60℃ for 1
mins).
Statistical Analysis
The unpaired t-test analysis was employed to
compare age, glucose AC, HbA1C, Creatinine levels,
ACR and eGFR among different subject groups. The
statistical P value was generated by the one-way
ANOVA analysis following Fisher's LSD post hoc
multiple comparisons. Pearson correlation coefficient
comparisons were carried out to determine disease
progression rates and miR levels. Statistical
459
evaluation was otherwise by t test, using Microsoft
Excel, with P_0.05 assumed to be significant.
Statistical analysis was performed using statistical
software program package Prism 5 (GraphPad, San
Diego, CA). The statistical significance was defined as
P<0.05.
Results
Candidate miRs were stably detected in serum
from subject groups
Fifty T2DM participants were enrolled in the
study to determine DN-related miRs. Among them, 12
T2DM patients were normoalbuminuria, 17 of them
are microalbuminuria and 21 subjects were diagnosed
with overt proteinuria based on ACR classification
whereas 32 of them exhibited high eGFR and 18 of
them showed low eGFR levels. No significant
difference in sex distribution, HbA1C and/or age was
found among subject groups with differential ACR
(Table 1) and eGFR levels (Table 2). The choice of
anticoagulant tubes was firstly verified to determine
the potential interference of additives during
sampling procedure. The results showed that the miR
level was undetected in blood samples collected in
sodium heparin containing tubes compared with the
tubes without anticoagulant and sodium EDTA
suggesting an inhibitory effect of anticoagulant for
either
RT
or
PCR
experimental
process
(Supplementary Figure 1). Based on these data, we
therefore collected whole blood in tube without
anticoagulant and purified serum for further analysis.
The validation using real-time RT-PCR analysis for
miR level was also performed and none of the assays
failed to reach the set threshold Ct of 40 cycles
suggesting a reliable Ct values during analysis
(Supplementary Figure 2).
Table 1. Clinical information of subjects recruited in this study
categorized by Albumin Creatinine Ratio (ACR). ***p<0.001;
*p<0.05.
Normal
albuminuria
Male
9
Female
3
Age (yrs)
52.83±3.346
Glucose AC 156.6±15.67
(mg/dl)
HbA1C (%) 8.000±0.4950
Creatinine
0.9833±0.1014
(mg/dl)
ACR (mg/g) 13.86±2.690
eGFR
88.36±9.465
(ml/min)
Microalbuminuria Overt
proteinuria
12
13
5
8
54.35±2.602
60.81±1.988
174.3±16.25
128.6±7.825
P-Value
> 0.05
> 0.05
< 0.05*
7.91±0.3858
0.8471±0.0692
7.176±0.2500 > 0.05
1.890±0.2844 < 0.0001***
139.9±21.95
103.3±8.542
1856±352.1
54.24±8.378
< 0.0001***
< 0.0001***
Int. J. Med. Sci. 2016, Vol. 13
460
Table 2. Clinical information of subjects recruited in this study
divided by estimated Glomerular Filtration Rate (eGFR).
***p<0.001; *p<0.05.
Male
Female
Age (yrs)
Glucose AC
(mg/dl)
HbA1C (%)
Creatinine
(mg/dl)
ACR (mg/g)
eGFR (ml/min)
High eGFR
23
9
55.44±1.79
165.3±10.43
Low eGFR
13
5
58.50±2.76
125.2±8.79
P-Value
7.90±0.27
0.83±0.04
7.13±0.28
2.21±0.28
> 0.05
< 0.0001***
510±181.5
103.4±5.41
1404±397.6
35.88±3.38
< 0.05*
< 0.0001***
> 0.05
< 0.05*
Levels of miR-21 and miR-29 are elevated in
DN patients
The level of miR-21, miR-29 family and miR-192
in serum samples from T2DM patients with
differential ACR and eGFR levels were examined. The
results showed that miR-21 level is more significantly
enriched in patients with overt proteinuria (p=0.001)
and microalbuminuria (p=0.0024) than patients
without DN whereas miR-29a level is up-regulated in
subjects with more progressive DN compared with
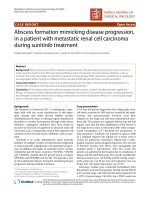
T2DM patients with normal albuminuria (Figure 1).
Interestingly, although miR-192 level showed no
significant difference between T2DM subjects with
and without DN, the serological miR-192 levels differ
between microalbuminuria and overt proteinuria
groups (p=0.0138) suggesting that miR-192 level
might be a potential marker for late DN progression
(Figure 1E). The miR level in patients with different
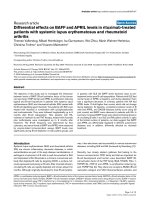
eGFR was also analyzed. To our surprise, only miR-21
level is significantly up-regulated in subjects with
lower eGFR (eGFR<60 ml/min; p=0.0363) in
comparison with patients with higher eGFR
(eGFR>60 ml/min) whereas no difference were
detected for level of miR-29 family and miR-192
between subject groups (Figure 2).
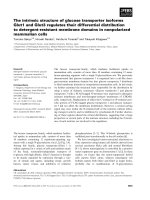
Figure 1. Expression of serum miRNAs in type 2 diabetic patients with differential ACRs. Quantitative real-time RT-PCR analysis of the five miRNAs in the sera from
three groups (normal albuminuria, n = 12; Microalbuminuria, n = 17 and Overt proteinuria, n = 21) showed that the level of miR-21, miR-29a and miR-192 is
up-regulated in overt proteinuria subjects compared with normal or micro albuminuria groups. The Y-axis refers to the gene expression ratio (candidate miRs versus
U6 snRNA), shown as the mean ± SEM in log2 scale. Level was measured in triplicate and P values were generated by one-way ANOVA analysis following Fisher’s LSD
post hoc multiple comparisons. **P < 0.01; *P < 0.05.
Int. J. Med. Sci. 2016, Vol. 13
461
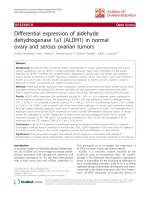
Figure 2. Level of serum miRNAs in type 2 diabetic patients with differential eGFR. Quantitative real-time RT-PCR analysis of the five miRs in the sera from two
groups (high eGFR, n=32 and low eGFR, n=18) showed that only miR-21 level is up-regulated in low-eGFR groups compared with high-eGFR subjects. The Y-axis
refers to the gene expression ratio (miRNAs versus U6 snRNA), shown as the mean ± SEM in log2 scale. Expression was measured in triplicate, and P values were
generated by unpaired t-test analysis. *P < 0.05.
While the age and Glucose AC values differs
among subject groups, the correlation between age
and Glucose AC levels with the level of candidate
miRs was next carried out. Pearson’s correlation
coefficient analysis showed that no significant
associations were found between the level of target
miRs with either age (Supplementary Figure 3) or
Glucose AC values (Supplementary Figure 4) within
all individuals implying that the differential
circulating miR level is independent of patients’ age
and glycemic condition in this study.
Level of miR-21 and miR-29 family reflected
DN progression
Based on our results showing that miR-21,
miR-29 and miR-192 are potential biomarkers to
detect staged DN, it was found that a number of
participants expressed an extremely high level of
these target miRs. We suspected that these patients
showed distinct pathological conditions different
from the rest of subjects. To further evaluate this
effect, the associations of disease progression defined
by the annual change of plasma creatinine levels and
level of miR-21, miR-29 family and miR-192 were
analyzed using Pearson’s correlation coefficient
method. All participants were longitudinally followed
up at least for 2 years and serial measures of serum
creatinine were made every 2-3 months during the
follow up period. Plasma creatinine changes were
determined if two out of three consecutive creatinine
measures were consistent and maintained. To our
surprise, the results showed that the patients with
greater levels of miR-21 and miR-29a/b/c, but not
miR-192, displayed a more rapid elevation of
creatinine levels in plasma suggesting that higher
level of miR-21 and miR-29 family could possibly be
prognostic markers for renal function impairment in
T2DM patients (Figure 3).
Int. J. Med. Sci. 2016, Vol. 13
462
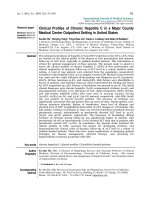
Figure 3. Correlation of serum miR levels with disease progression in patients with diabetic nephropathy. Pearson’s correlation coefficient analysis was performed
and P < 0.05 is considered as significant difference. The result showed that the subjects with greater level of serum miR-21 and miR-29 family exhibited more rapid
creatinine changes in contrast to those with lower miR levels. The X-axis represented changing rates of creatinine over 1-year follow-up and the Y-axis referred to
the relative miR level (versus U6 snRNA). Asterisks represent subjects with greater candidate miR level.
Discussion
DN accounts for a significantly increased
morbidity and mortality in T2DM patients. Although
microalbuminuria is regarded as the gold standard
for diagnosis of an early and reversible DN, the
sensitivity to precisely detect disease progression
remains unsatisfied [19]. Therefore, exploring more
sensitive diagnostic markers for better monitoring of
DN pathogenesis could largely facilitate risk
stratification of the disease and enable the earlier
diagnosis and more efficient intervention. In the
present study, the potential to utilize circulating miRs
as prognostic indicators in T2DM patients with
differential DN stages to define or to predict DN
progression was determined. Using quantitative
RT–PCR analysis for DN related miRs, the results
demonstrated that the level of miR-21 and miR-29a
was significantly elevated in subjects with overt
proteinuria compared with the patients diagnosed
with either normal albuminuria or microalbuminuria.
Interestingly, among all candidate miRs, miR-192
level showed good sensitivity to diagnose established
DN progression, namely between subjects with
microalbuminuria and overt proteinuria. In contrast,
by using the eGFR as a classification indicator, it was
found that only miR-21 level was significantly
up-regulated among the groups indicating that the
miR-21 possibly serves as a more sensitive circulating
miR to reflect early renal dysfunction.
Recent study defined the importance of miRs in
normal renal development and function and various
renal diseases suggesting specific renal miRs might be
good targets to monitor DN pathogenesis [20]. For
example, miR-192 is specifically expressed in kidney
and its level is up-regulated in streptozotocin
(STZ)-induced DM and in db/db mice. Further
analysis found that miR-192 suppressed the
translation of SIP1/ E-box repressors ZEB2, a
transcriptional repressor that binds to the E-box in the
Collagen1a2 (Col1a2) gene, leading to elevated
collagen deposition in vivo indicating a role of
Int. J. Med. Sci. 2016, Vol. 13
miR-192 in the development of the matrix
accumulation observed in DN [21]. In addition, Krupa
et al showed miR-192 was significantly lower in
patients with advanced DN, correlating with
tubulointerstitial fibrosis and low GFR concluding
that a decrease in miR-192 is associated with increased
renal fibrosis in vivo [22]. Other DN associated miRs
such as miR-21 and miR-29 were also described. The
level of miR-21 was down-regulated in early DN
while overexpression of miR-21 inhibits glomerular
mesangial cell proliferation under conditions of
elevated glucose. Ectopic miR-21 expression in vivo
resulted in decreased albuminuria in diabetic db/db
mice suggesting its role in maintaining renal functions
in response to high glucose condition [23]. In
molecular basis, miR-21 prevented mesangial
hypertrophy by targeting the PTEN/PI3K/Akt
pathway in vivo and in vitro and overexpression of
miR-21 enhanced renal fibrosis in vitro in response to
Transforming growth factor-β1 (TGF-β1) treatment
implying the importance of miR-21 in regulating renal
fibrosis and cell apoptosis [24]. Furthermore, recent
reports have also found that miR-29 was
downregulated in the fibrotic kidney of obstructive
nephropathy and was negatively regulated by TGF-β1
via Smad3 signaling pathway as Smad3 physically
bound the miR-29 promoter and repressed miR-29
expression, thereby promoting collagen matrix
expression [25]. Knock-down of miR-29c significantly
reduced albuminuria and kidney mesangial matrix
accumulation in the db/db mice model in vivo, and
prevented high glucose-induced cell apoptosis
whereas forced expression of miR-29c strongly
induced podocyte apoptosis [26]. In a with our
findings, a recent study showed that urinary miR-29a,
but not miR-29b and miR-29c, was elevated in T2DM
subjects with microalbuminuria and overt proteinuria
compared to those with normoalbuminuria [27]. On
the contrary, Lv et al demonstrated that urinary levels
of miR-29 and miR-200 family were decreased in
patients with the chronic kidney diseases (CKD),
including biopsy-defined DN, whereas the miR-29c
expression was positively correlated with eGFR and
negatively associated with degree of tubulointerstitial
fibrosis [28]. The inconsistent findings might result
from the diverse etiology of CKD populations
included in the cohort while the small number of the
DN samples (N=3) also limited further interpretation
of the study. In addition, it has been found that serum
miR levels do not always consistent with the levels of
urinary miRs highlighting the importance of sample
selection to explore useful DN biomarkers.
In cellular basis, miRs are indispensable in
regulating normal development and in maintaining
organ function and homeostasis [29]. While the
463
aberrant miR level is observed in mice with kidney
fibrosis; the ablation of Dicer protein, a key miR
biogenetic mediator, in podocytes led to proteinuria
and glomerulosclerosis [30]. Previous studies
indicated that decreased miR-29 level could result in
DN and IgA nephropathy [31]. Nevertheless, an
inconsistent result showed that the increased miR-29c
level was detected in the kidney glomeruli from
db/db mice and deficient miR-29c level could
ameliorate the DN progression via the reduction of
cell apoptosis and decreased ECM expression under
diabetic condition in vivo [26]. Interestingly, the TGF-β
mediated level of miR-21, miR-29 and miR-192 played
differential roles in modulating renal fibrosis; miR-21
and miR-192 amplified the TGF-β signaling and
promoted fibrosis as miR-29 reduced fibrosis by
inhibition of the deposition of ECM [32]. The potential
regulatory role of miR-192 mediated circuits during
DN pathogenesis was further emphasized, showing
that miR-192 could amplify TGF-β1 signaling thereby
accelerating DN [33]. Under the treatment of
anti-miR-192 in STZ-induced diabetic mice, the
significantly decreased TGF-β expression, collagen
and fibronectin accumulation as well as the
attenuated proteinuria were detected in diabetic
kidneys implying the potential of miR-192 blockage
for DN treatment [34]. Several lines of evidence have
revealed the potential miR-mediated downstream
molecular players for DN pathogenesis. For example,
miR-21 targeted down-regulation of tissue inhibitors
of metalloproteinase 3 (TIMP3) as well as the miR-21
regulated PPARα-mediated lipid metabolic pathway
both play important roles for renal fibrosis [35, 36]. A
recent study also found that in vivo administration of
miR-21 knockdown plasmid into the diabetic kidneys
of db/db mice could rescue the microalbuminuria,
renal fibrosis and inflammation via the restoration of
a TGF-β1 repressor mothers against decapentaplegic
homolog 7 (SMAD7), revealing a miR-21 targeted
therapeutic strategy for DN treatment [37].
There were several clinical indicators to monitor
DN progression. For instance, early studies indicated
that the presence of microalbuminuria in 80% of
T1DM patients could be a predictive of disease
progression [38]; nevertheless, the other analysis
showed that only around 30% of microalbuminuric
patients progressed to overt DN after 10-year
follow-up [39]. Moreover, no definite correlation for
the low-eGFR subjects with a long DM history to
progression
from
normoalbuminuria
to
microalbuminuria was established. In addition, more
recent evidence suggested that advanced histological
alterations in the glomerular basement membrane
may already exist when microalbuminuria is first
detected, suggesting microalbuminuria might not be
Int. J. Med. Sci. 2016, Vol. 13
sensitive enough to determine DN onset/progression
[40]. The utilization of microalbuminuria for detection
of DN becomes even more complicated when a very
recent study demonstrated that more than half of
T2DM patients with overt proteinuria obtained
remission to microalbuminuria after the intensive DM
treatment in a primary care setting [41]. The detection
of tubulointerstitial fibrosis by renal biopsy was also
widely accepted as one of the histopathological
hallmarks of progressive DN and the degree of
tubulointerstitial fibrosis could even be used to
predict renal function [42]. However, renal biopsy is
invasive with potential complications making
repeated monitoring become practically difficult.
Hence, reliable noninvasive biomarkers reflecting
disease severity are urgently needed in the clinical
management of patients with CKD. Our data showed
that DN progressors, defined as patients with a more
rapid change of eGFR or ACR, exhibited significantly
greater serological levels of miR-21 and miR-29
family, but not miR-192, in comparison with
non-progressors, revealing the significance to use
serum miRs to identify DN advancement. Pezzolesi et
al. showed that and miR-21 were significantly
associated with the increased risk of ESRD while
miR-29a were significantly associated with protection
against rapid progression in T1DM patients [43]. In
agreement with our finding, a recent study identified
a number of uninary miRs that have not previously
been associated with renal pathology in T1DM
patients with different stages of albuminuria/DN.
Among those DN-related miRs, miR-29 is
differentially expressed between patients who
developed overt DN after decades relative to patients
who did not [43], although a null differential
significance of miR level between DN progressors and
non-progressors was found in another study [22].
The current study revealed for the first time, to
best of our knowledge, that miR-21, miR-29a/b/c and
miR-192 could possibly reflect DN pathogenesis;
however, there were several limitations in this study.
First, the sample size is relatively small. Second, renal
biopsy had only been performed in a few subjects,
making it difficult to elucidate the correlation between
miR level and renal histopathological condition, such
as degree of renal fibrosis. Lastly, the lack of repeated
measurements for candidate miRs during the
follow-up period restricted the precise interpretations
for the importance of tested miRs during DN
progression. In summary, we reported that serological
miR-21, miR-29a and miR-192 are significantly
elevated in T2DM patients with aggressive DN, based
either on ACR or eGFR classification. The progressors
showed significantly greater levels of miR-21 and
miR-29 family in comparison with non-progressors.
464
Our result implied that these miRs may serve as early
indicators of DM-mediated renal pathology, which
can be of importance in the aspect of preventive
medicine. A larger cohort would be required to
warrant our findings and to clarify the potential
utility of these miRs in early diagnosis, risk
stratification of progression and treatment outcomes.
Supplementary Material
Supplementary tables and figures.
/>
Acknowledgments
This work is supported by a grant from the
Taipei City Hospital/Department of Health, Taipei
City Government (100TPECH06 to W-C Li) as well as
a grant from Ministry of Science and Technology,
Taiwan (Most-103-2314-B-010-024-MY3 to W-C Li).
The authors would also like to thank Mrs Courtney
Anne Curtis for critical review and English
corrections for the manuscript.
Competing interests
The authors declare no competing interest exists.
References
1.
2.
3.
4.
5.
6.
7.
8.
9.
10.
11.
12.
13.
14.
15.
16.
Yang WC, Hwang SJ, Chiang SS, Chen HF, Tsai ST. The impact of diabetes on
economic costs in dialysis patients: experiences in Taiwan. Diabetes research
and clinical practice. 2001;54 (Suppl 1):S47-54..
Boyle JP, Thompson TJ, Gregg EW, Barker LE, Williamson DF. Projection of
the year 2050 burden of diabetes in the US adult population: dynamic
modeling of incidence, mortality, and prediabetes prevalence. Population
health metrics. 2010;8:29.
Bell DS. Diabetic cardiomyopathy. A unique entity or a complication of
coronary artery disease? Diabetes care. 1995;18:708-714.
Ahlqvist E, van Zuydam NR, Groop LC, McCarthy MI. The genetics of
diabetic complications. Nature Reviews Nephrology. 2015; 11:277-287.
Reidy K, Kang HM, Hostetter T, Susztak K. Molecular mechanisms of diabetic
kidney disease. The Journal of clinical investigation. 2014;124:2333-2340.
Oberg BP, McMenamin E, Lucas FL et al. Increased prevalence of oxidant
stress and inflammation in patients with moderate to severe chronic kidney
disease. Kidney international. 2004;65:1009-1016.
Jerums G, Premaratne E, Panagiotopoulos S, Clarke S, Power DA, MacIsaac RJ.
New and old markers of progression of diabetic nephropathy. Diabetes
research and clinical practice. 2008;82 (Suppl 1):S30-37.
Jerums G, Premaratne E, Panagiotopoulos S, MacIsaac RJ. The clinical
significance of hyperfiltration in diabetes. Diabetologia. 2010;53:2093-2104.
Levey AS, Becker C, Inker LA. Glomerular filtration rate and albuminuria for
detection and staging of acute and chronic kidney disease in adults: a
systematic review. JAMA : the journal of the American Medical Association.
2015;313:837-846.
Alvarez ML, Khosroheidari M, Kanchi Ravi R, DiStefano JK. Comparison of
protein, microRNA, and mRNA yields using different methods of urinary
exosome isolation for the discovery of kidney disease biomarkers. Kidney
international. 2012;82:1024-1032.
Conserva F, Pontrelli P, Accetturo M, Gesualdo L. The pathogenesis of
diabetic nephropathy: focus on microRNAs and proteomics. Journal of
nephrology. 2013;26:811-820.
Mendell JT. MicroRNAs: critical regulators of development, cellular
physiology and malignancy. Cell cycle. 2005;4:1179-1184.
Gilad S, Meiri E, Yogev Y, et al. Serum microRNAs are promising novel
biomarkers. PloS one. 2008;3:e3148.
Miranda KC, Huynh T, Tay Y, et al. A pattern-based method for the
identification of MicroRNA binding sites and their corresponding
heteroduplexes. Cell. 2006;126:1203-1217.
Baek D, Villen J, Shin C, Camargo FD, Gygi SP, Bartel DP. The impact of
microRNAs on protein output. Nature. 2008;455:64-71.
Bhattacharyya SN, Habermacher R, Martine U, Closs EI, Filipowicz W. Relief
of microRNA-mediated translational repression in human cells subjected to
stress. Cell. 2006;125:1111-1124.
Int. J. Med. Sci. 2016, Vol. 13
465
17. Guo H, Ingolia NT, Weissman JS, Bartel DP. Mammalian microRNAs
predominantly act to decrease target mRNA levels. Nature. 2010;466:835-840.
18. Xu J, Zhao J, Evan G, Xiao C, Cheng Y, Xiao J. Circulating microRNAs: novel
biomarkers for cardiovascular diseases. Journal of molecular medicine.
2012;90:865-875.
19. Trionfini P, Benigni A, Remuzzi G. MicroRNAs in kidney physiology and
disease. Nature Reviews Nephrology. 2015;11:23-33.
20. Li JY, Yong TY, Michael MZ, Gleadle JM. Review: The role of microRNAs in
kidney disease. Nephrology. 2010;15:599-608.
21. Kato M, Zhang J, Wang M, et al. MicroRNA-192 in diabetic kidney glomeruli
and its function in TGF-beta-induced collagen expression via inhibition of
E-box repressors. Proceedings of the National Academy of Sciences of the
United States of America. 2007;104:3432-3437.
22. Krupa A, Jenkins R, Luo DD, Lewis A, Phillips A, Fraser D. Loss of
MicroRNA-192 promotes fibrogenesis in diabetic nephropathy. Journal of the
American Society of Nephrology : JASN. 2010;21:438-447.
23. Zhang Z, Peng H, Chen J, et al. MicroRNA-21 protects from mesangial cell
proliferation induced by diabetic nephropathy in db/db mice. FEBS letters.
2009;583:2009-2014.
24. Kantharidis P, Wang B, Carew RM, Lan HY. Diabetes complications: the
microRNA perspective. Diabetes. 2011;60:1832-1837.
25. Qin W, Chung AC, Huang XR, et al. TGF-beta/Smad3 signaling promotes
renal fibrosis by inhibiting miR-29. Journal of the American Society of
Nephrology : JASN. 2011;22:1462-1474.
26. Long J, Wang Y, Wang W, Chang BH, Danesh FR. MicroRNA-29c is a
signature microRNA under high glucose conditions that targets Sprouty
homolog 1, and its in vivo knockdown prevents progression of diabetic
nephropathy. The Journal of biological chemistry. 2011;286:11837-11848.
27. Peng H, Zhong M, Zhao W, et al. Urinary miR-29 correlates with albuminuria
and carotid intima-media thickness in type 2 diabetes patients. PloS one.
2013;8:e82607.
28. Lv LL, Cao YH, Ni HF, et al. MicroRNA-29c in urinary exosome/microvesicle
as a biomarker of renal fibrosis. American journal of physiology Renal
physiology. 2013;305:F1220-1227.
29. Wessely O, Agrawal R, Tran U. MicroRNAs in kidney development: lessons
from the frog. RNA biology. 2010;7:296-299.
30. Shi S, Yu L, Chiu C, et al. Podocyte-selective deletion of dicer induces
proteinuria and glomerulosclerosis. Journal of the American Society of
Nephrology : JASN. 2008;19:2159-2169.
31. Wang G, Kwan BC, Lai FM, Chow KM, Li PK, Szeto CC. Urinary miR-21,
miR-29, and miR-93: novel biomarkers of fibrosis. American journal of
nephrology. 2012;36:412-418.
32. Chung AC, Lan HY. MicroRNAs in renal fibrosis. Frontiers in physiology.
2015;6:50.
33. Kato M, Arce L, Wang M, Putta S, Lanting L, Natarajan R. A microRNA circuit
mediates transforming growth factor-beta1 autoregulation in renal glomerular
mesangial cells. Kidney international. 2011;80:358-368.
34. Putta S, Lanting L, Sun G, Lawson G, Kato M, Natarajan R. Inhibiting
microRNA-192 ameliorates renal fibrosis in diabetic nephropathy. Journal of
the American Society of Nephrology : JASN. 2012;23:458-469.
35. Chau BN, Xin C, Hartner J, et al. MicroRNA-21 promotes fibrosis of the kidney
by silencing metabolic pathways. Science translational medicine.
2012;4:121ra18.
36. Fiorentino L, Cavalera M, Mavilio M, et al. Regulation of TIMP3 in diabetic
nephropathy: a role for microRNAs. Acta diabetologica. 2013;50:965-969.
37. Zhong X, Chung AC, Chen HY, et al. miR-21 is a key therapeutic target for
renal injury in a mouse model of type 2 diabetes. Diabetologia.
2013;56:663-674.
38. Rossing P, Hougaard P, Parving HH. Progression of microalbuminuria in type
1 diabetes: ten-year prospective observational study. Kidney international.
2005;68:1446-1450.
39. Allen KV, Walker JD. Microalbuminuria and mortality in long-duration type 1
diabetes. Diabetes care. 2003;26:2389-2391.
40. Dronavalli S, Duka I, Bakris GL. The pathogenesis of diabetic nephropathy.
Nature clinical practice Endocrinology & metabolism. 2008;4:444-452.
41. Yokoyama H, Araki S, Honjo J, et al. Association between remission of
macroalbuminuria and preservation of renal function in patients with type 2
diabetes with overt proteinuria. Diabetes care. 2013;36:3227-3233.
42. Mise K, Hoshino J, Ueno T, et al. Impact of tubulointerstitial lesions on
anaemia in patients with biopsy-proven diabetic nephropathy. Diabetic
medicine : a journal of the British Diabetic Association. 2015;32:546-555.
43. Argyropoulos C, Wang K, McClarty S, et al. Urinary microRNA profiling in
the nephropathy of type 1 diabetes. PloS one. 2013;8:e54662.