Changes in Vietnam - China trade in the context of China’s economic slowdown
Bạn đang xem bản rút gọn của tài liệu. Xem và tải ngay bản đầy đủ của tài liệu tại đây (515.04 KB, 12 trang )
VNU Journal of Science: Economics and Business, Vol. 35, No. 2 (2019) 1-12
Original Article
Changes in Vietnam - China Trade
in the Context of China’s Economic Slowdown
Vu Thanh Huong*, Nguyen Thi Lan Phuong
VNU University of Economics and Business,
144 Xuan Thuy Str., Cau Giay Dist., Hanoi, Vietnam
Received 20 June 2019
Revised 25 June 2019; Accepted 26 June 2019
Abstract: After three decades of maintaining high and stable GDP growth, China’s economy has
shown signs of slowdown since 2012. By comparing China’s growth rates in two periods, namely
2002-2011 and 2012-2018, this paper points out evidence of China’s economic slowdown and four
key reasons underlying this decline including the decrease in China’s export growth, the decrease
in China’s investment efficiency, China’s transition to a new growth model and the US-China
trade war. The paper then examines the changes in Vietnam’s trade with China in the context of
China’s economic slowdown. The results show robust evidence that the growth rates of Vietnam’s
two-way trade with China have witnessed a downward trend. Both Vietnam’s import and export
growth rates reduced over the two periods but imports of Vietnam from China have more seriously
suffered. In the coming time, if the Chinese economy becomes worse, especially if the US-China
trade war continues escalating, the potential impacts of China’s economic decline on Vietnam’s
trade with China might be more significant. In such a case,Vietnam would be more dependent on
imports from China and would need to cope with more difficulties in promoting exports to China,
leading to a more serious trade deficit with China. Based on these results, the paper highlights
some measures to support Vietnam to deal with the possible impacts from China’s economic
slowdown in the future.
Keywords: China, Vietnam, economic slowdown, trade, changes.
1. Introduction *
Trans-Pacific Partnership Agreement and
undertake many protectionist policies, the exit
of the United Kingdom from the European
Union (EU), the proliferation of populism, the
US-China trade war and the strong
development of Industrial Revolution 4.0. All
of these events have made the world economy
step into a difficult period.
In this context, the “economic health” of
countries that have substantial influence on the
Over recent years, the world economy has
witnessed a wide range of fluctuations
including President Donald Trump’s decision to
withdraw the United States (US) from
_______
*
Corresponding author.
E-mail address:
/>
1
2
V.T. Huong, N.T.L. Phuong / VNU Journal of Science: Economics and Business, Vol. 35, No. 2 (2019) 1-12
world economy is always of concern. China the second biggest economy in the world - after
three decades of maintaining high and stable
economic growth rates of more than 10% per
year on average, has shown signs of economic
slowdown since 2012. According to the World
Bank (2018a) [1] and Nguyen Cam Nhung, Vu
Thanh Huong and Tran Viet Dung (2019) [2],
China’s GDP growth rate has gradually
decreased from 9.53% in 2011 to 7.86% in
2012 and 6.6% as at the end of 2018. This
decrease will potentially continue in the near
future if the trade war between China and the
US tends to escalate. Because of the vital role
of China in the global economy, the slowdown
of China’s economy is not only China’s issue
but also has a significant impact on
other countries.
For Vietnam, China is among its biggest
trading partners. According to the ITC (2019)
[3], in 2018, China is Vietnam’s biggest import
market and third-biggest export market after the
US and the EU. Because of the importance of
China to Vietnam’s trade, China’s economic
slowdown will certainly cause two-side impacts
on bilateral trade between Vietnam and China.
Despite the important role of China in the
global economy in general and Vietnam’s trade
in particular, there has been limited research
investigating the economic slowdown of this
country and linking this slowdown with the
changes in Vietnam - China trade.
Some of the typical literature analyzing
China’ decrease in GDP growth includes Lee
(2015) [4], Xu (2015) [5], Lin et al. (2018) [6],
Wu (2018) [7], Fukao and Yan (2018) [8], Zang
and Bai (2018) [9]. These previous papers
analyzed China’s slower growth by using
different approaches such as a growth model
approach [4, 5], a productivity approach [7, 9],
an economic structure approach [8] and a
cyclical approach [6, 8]. Some notable causes
for China’s economic decline were pointed out
such as low productivity, the slowdown in total
factor productivity growth, high-gross savings GDP ratio, low labor income share, middle income trap problem, institutional structures,
structural constraints, the rebalancing problem,
low investment efficiency and transformation to
a post-industrial society. Based on past
literature, this paper has adopted the growth
model approach. However, unlike the previous
studies, this paper only focuses on key factors
of China’s growth model directly affecting
China’s trade with the rest of the world.
Besides, the paper also covers another factor
occurring recently but influencing substantially
China’s growth model and the world economy the trade war between the US and China.
Some other papers have tried to examine
the effects of China’s slower growth on the rest
of the world by using both quantitative and
qualitative methods. Deorukhkar and Xia
(2016) [10], Zhai and Morgan (2016) [11] tried
to measure the impact of China’s changing
growth rate on emerging countries in Asia. By
using computable general equilibrium, Lakatos
et al. (2017) [12] estimated the impact of
China’s economic slowdown on Sub-Saharan
Africa while Ohshige et al (2018) [13] used the
Global Vector Autoregression model to
estimate the impact of China’s GDP slower
growth on the Asia - Pacific region via trade
linkages. Thorbecke (2018) [14] adopted the
gravity model to investigate how slower growth
in China can affect exports of East Asia to
China. Up to now, there are only a few studies
that mention how Vietnam’s economy will
change when China grows more slowly. For
example, Deorukhkar and Xia (2016) [10], Zhai
and Morgian (2016) [11] pointed out Vietnam’s
changes in different macroeconomic indicators
such as GDP growth, external vulnerability,
investment, and trade. Most of the related
analyses are scattered in the form of electronic
articles. Therefore, this paper contributes to the
existing literature by analyzing and linking
systematically changes in Vietnam - China
trade given China’s economic slowdown
situation and causes over two periods:
2002-2011 and 2012-2018.
Given the above analysis, the paper aims at
analyzing the situation of and reasons for
China’s economic slowdown and then pointing
out the changes in Vietnam - China trade by
comparison of two periods - 2002-2011 and
V.T. Huong, N.T.L. Phuong / VNU Journal of Science: Economics and Business, Vol. 35, No. 2 (2019) 1-12
2012-2018. Under this premise, the paper
proposes some implications for Vietnam to
develop trade with China in the context of
China’s GDP decline.
2. China’s economic slowdown and its causes
2.1. China’s economic slowdown
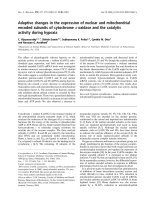
After joining the WTO in 2001, China has
experienced rapid economic development. GDP
growth rate achieved 9.13% one year after
China became a WTO member and reached a
peak of 14.23% in 2007 (Figure 1). Even in the
period of the global financial crisis, the country
maintained a high growth rate of 9.40% in 2009
and of around 10% in the next two years of
2010 and 2011. On average, in the period 20022011, China’s growth rate stood at a very high
level of 10.86% per year, enabling the country
to jump from the sixth to second biggest
country, economically, in the world.
After 2011, China's economy has tended to
slow down noticeably. From the growth rate of
9.54% in 2011, it fell to 7.86% in 2012 - the
lowest level in 12 years. In 2013, the Chinese
government had to adopt measures to stimulate
the economy such as cutting down interest rates
and adopting fiscal policies. However, in 2014,
China's growth was only 7.30%, lower than
Hk
3
7.50% as targeted. In 2016, China set a growth
target of 7% but the government again could
not achieve it. Totally, in the period 2012 2018, the growth rate of China has continuously
decreased from 7.86% to only 6.68% with an
average growth rate of 7.16% per year.
It can be said that the period of magical
double-digit economic growth of China was
over. The second largest economy now is
experiencing the lowest economic growth rate
in 30 years. As China has been a major engine
of global growth for decades, its economic
slowdown has become a major concern for
policymakers, central banks, economists,
investors and corporate executives around the
world. The most concern about the impact of
China’s economic decline is on global trade
(Lakatos et al., 2017) [12]. This is because
China’s economic slowdown leads to lower
import demand and thus commodity prices,
which would affect different regions of the
world in different ways depending on their
exposure. For countries dependent on exports,
especially exports to China such as Australia,
Brazil, Canada, Vietnam and Indonesia, this
slowdown could have a negative impact on their
GDP growth and exports. On the contrary, the fall
in commodity prices could be beneficial for other
countries that are big consumers such as the
United States and countries across Europe.
16
14.23
12.72
14
11.40
12
9.65 10.649.54
10.0410.11
9.40
9.13
10 8.34
7.86 7.76 7.30
6.90 6.70 6.90 6.68
8
6
4
2
0
Figure 1. China’s GDP growth rate, 2001-2018 (%).
Source: World Bank (2018a) [1]; Nguyen Cam Nhung, Vu Thanh Huong and Tran Viet Dung (2019) [2]
4
V.T. Huong, N.T.L. Phuong / VNU Journal of Science: Economics and Business, Vol. 35, No. 2 (2019) 1-12
i
j
2.2. Causes of China’s economic slowdown
The decrease in China’s export growth
The Chinese economy is characterized by
an investment-driven and export-oriented
strategy, leading to the fact that a decrease in
China’s export growth is an important factor
causing a decrease in its GDP growth rate.
Hl
40
20
0
-20
2002
2004
2006
2008
2010
2012
2014
2016
2018
3,000
2,000
1,000
-
Value (million USD)
Growth rate (%)
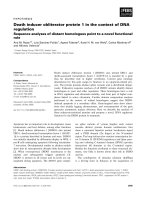
Figure 2. China’s exports in the period 2002-2018.
Source: ITC (2019) [3]
Chinese merchandise exports rose by nearly
6 times from USD 325 billion in 2002 to nearly
USD 1.9 trillion in 2011 (Figure 2), accounting
for more than 25% of China’s GDP on average
in the same period. In 2002-2011, China’s
exports grew at very high rates, which ranged
from 20% to 36%. The exceptions were 2008
and 2009 when China was affected by the
global financial crisis and therefore the growth
rates were only 17% and -16%, respectively.
China’s rapidly growing exports have made it
an increasingly important, and even the largest
trading partner, for many countries and regions.
Since 2009, the country has become the world’s
largest exporter and second largest importer.
However, since 2012, China's economy
experienced a sharp decline in its export growth
rate. From 20.3% in 2011, the export growth
rate fell dramatically to around 7.9% in the next
two years and continued to decrease to only
6.0% in 2014. In 2015-2016, China’s exports
even declined with negative rates at -2.9% and 7.7%, equivalent to the decrease from USD 2.3
trillion in 2015 to USD 2.27 trillion in 2016.
This is the first period in more than 15 years
that China’s export values decreased, except for
during the 2009 global crisis.
The decrease in China’s export growth
comes from the limitation of the Chinese
export-led growth model, which has been
promoted by China to become a manufacturing
hub offering cheap labor. This model, in fact,
has encountered a variety of challenges. The
first challenge is increasing wages in China,
which have eventually translated into higher
labor costs for companies operating assembly
lines in China. For example, the average hourly
wages in China hit USD 3.60 in 2016, which
was 64% higher than that in 2011. That is more
than five times the hourly manufacturing wages
in India and is more on par with countries such
as Portugal and South Africa [15]. A lot of
firms in China are therefore now taking their
business elsewhere, implying that China could
start losing jobs to other developing countries
like Sri Lanka, where hourly factory wages are
only USD 0.50. The second challenge is the
declining labor force of China. This is the result
of the “One child policy” that was introduced in
1979 to slow down the population growth.
Although it helped to prevent around 400
million births, it has resulted in an aging
population in China. Even though China has
now relaxed the “One child policy”, its outcome
is limited, causing the increasing growth of
wages. The third challenge is the decrease in
developed countries’ demand. The low
economic growth rates of the EU, Japan and
South Korea, who are among the largest trading
partners of China, have led to a decline in
global import demand. This challenge is
incorporated with an increase in the US trade
barriers imposed on goods from China from
2018, contributing to a decline in China’s
economic growth.
The decrease in China’s investment
efficiency
Investment, accounting for around half of
China’s GDP in the period 200-2017, was
V.T. Huong, N.T.L. Phuong / VNU Journal of Science: Economics and Business, Vol. 35, No. 2 (2019) 1-12
mainly made up of investment in
manufacturing, real estate and infrastructure
[1]. A steady increase in the rate of investment
as a share of GDP has directly contributed to
the high growth rate of China. However, recent
years have witnessed a weaker investment in
China. Besides, China’s high public investment
has played a role in resource misallocation and
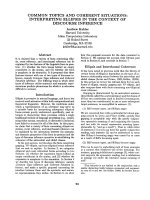
loss in productivity. In the period 2002-2007,
China’s ICOR decreased from 4.2 to 2.9 (Figure
3). However, ICOR increased rapidly from 4.5 in
2008 to around 6.5 in 2017, showing a decline in
China’s investment efficiency.
7
6
5
4
3
2
1
0
20022004200620082010201220142016
Figure 3. China’s ICOR indicator in the period
2002-2017.
Source: World Bank (2018b) [16]
The main reason for lower investment
efficiency can be explained by the adoption of a
4 trillion Yuan economic stimulus package
introduced in 2008 by the Chinese government
to cope with the global financial crisis. The
stimulus package was mainly provided for
state-owned enterprises and government
agencies, especially local governments through
funding and bank loans. The package helped
China to promote the economic growth rates
two years later. However, since 2011, the
stimulus package has revealed some negative
impacts, namely a large number of abandoned
real estate projects, surplus in production, new
5
fiscal burdens, inflation, asset bubble risks, and
huge local government debt. All of these
impacts have held back the development of the
economy. Besides, the high growth in
infrastructure and housing investment over the
same period has also been attributed to the decline
in the investment efficiency of China [16].
China’s transition to a new growth model
Given the problems caused by the stimulus
package introduced during the global financial
crisis, from as early as 2010, the Chinese
government began to reach a consensus view on
the need to tolerate slower growth. Under this
view, the new potential growth rate of China
might be between 6% and 8% for the period
2011-2020 compared to above 10% in the
period 2001-2010, to support full employment
and maintain social stability. For this reason,
China has decided to conduct a transition from
a fast-growing economy driven largely by
investment and exports to a new and more
sustainable growth model with domestic
demand and innovation as the new growth
engines. A wide range of actions has been
undertaken. Particularly, China has tried to
rebalance the economic structure, let the market
play a more important role in economic
development and resource allocation, reform
State-owned enterprises (SOEs), boost domestic
consumption, screen out low-quality SOEs
from investing, constrain banks and other
financial institutions from issuing further debts,
tighten capital outflows, and promote
innovation and tech-related services.
China has also adopted policies to cut
industrial output to move forward to sustainable
development. For example, in 2016, China
reduced its coal output by 290 million tons and
steel by 65 million tons, shut down some coalfired power plants and stopped planning to
build new coal-fired power plants. In 2017, as
part of a reform program to reduce surplus
capacity in order to contribute to environmental
protection, China reduced its coal production by
more than 150 million tons and steel production
V.T. Huong, N.T.L. Phuong / VNU Journal of Science: Economics and Business, Vol. 35, No. 2 (2019) 1-12
3. Changes in Vietnam’s trade with China in
the context of China’s economic slowdown
3.1. Overview of Vietnam’s trade with China
After normalizing the relationship in 1991,
China has become one of the important partners
of Vietnam in a variety of sectors. Especially,
due to the proximity of the two countries and
economic, cultural and social similarities,
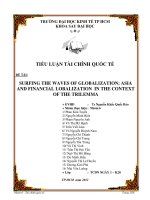
Vietnam - China trade has proliferated. In the
last 18 years, Vietnam’s two-way trade with
China has increased nearly 30 times from USD
3.68 billion in 2002 to USD 106 billion in 2018
(Figure 4) with an average growth of 23.95%
per year. At the same time, the proportion of
Vietnam’s trade with China reached 20% in
2018 compared with more than 10% in 2001,
making China become Vietnam’s largest trade
partner since 2004. Vietnam was also the
biggest trade partner of China among ASEAN
countries in 2018. China is recognized to be an
important consumption market for Vietnam’s
exports and raw materials, supplying a market
for Vietnam as well as an essential element for
Vietnam’s industrialization and modernization.
However, the growth rates of Vietnam’s
two-way trade with China have witnessed a
downward trend starting since 2012 (Figure 4).
Therefore, it is of great importance to
understand changes in Vietnam’s trade with
China when China copes with a decline in
economic growth and then find out solutions for
Vietnam to minimize negative impacts of
this decline.
150
60
100
40
50
20
0
0
%
K;
2002
2004
2006
2008
2010
2012
2014
2016
2018
by 50 million tons, and continued to close more
than 500 coal mines. These measures have
required China to replace the “quantity-reliant
growth” with “the quality-oriented growth”,
and this as a result has put pressures on
economic growth.
The US - China trade war
On 6 July 2018, the two biggest world
economies - the US and China - officially
stepped into a trade war when the two parties
imposed tariffs on bilateral trade. So far, the US
has imposed tariffs of 25% on USD 250 billion
worth of Chinese goods, and vice versa, China
has imposed tariffs ranging from 5% - 25% on
US goods worth USD 110 billion. The exposure
reasons for this trade war are attributed to the
US’s trade deficit with China, job losses in the
US, a fairer playing field, national security, and
intellectual property rights issues. However, the
underlying reasons are related to the “Made in
China 2025” plan and geopolitical reasons
between the two countries to capture the No. 1
dominating position in the world [17].
In the context of the US - China trade war,
global economic growth in 2018 fell to 3.6%,
lower than the forecast of 0.3% and 0.2% lower
than that of 2017. Global FDI flows in 2018
plummeted by 19% compared to that of 2017
and was at the lowest level since the 2008
financial crisis. In the same vein, China’s GDP
growth rate in 2018 fell to 6.6% (the lowest
level since 1990) from 6.9% in the previous
year [2]. The trade war has also brought about
other negative consequences for China. China’s
exports to the US will decline, high-tech
Chinese companies will need to cope with a
variety of difficulties to have access to the US
and other markets, especially the EU as a result
of protective measures from the US. The capital
inflows and outflows of China will be uncertain
shortly, and China’s Purchasing Managers
Index (PMI) might continue to decrease. All of
these effects will tend to deteriorate China’s
economic growth in the coming time.
Bollion USD
6
Figure 4. Vietnam’s total trade
with China, 2002-2018.
Sources: ITC (2018) [3], Vietnam Customs
(2019a, 2019b) [18, 19]
V.T. Huong, N.T.L. Phuong / VNU Journal of Science: Economics and Business, Vol. 35, No. 2 (2019) 1-12
7
k
Table 1. Vietnam’s trade with China, 2002 - 2018
Year
2002
2003
2004
2005
2006
2007
2008
2009
2010
2011
Average
2001-2011
2012
2013
2014
2015
2016
2017
2018
Average
2012-2018
Vietnam’s exports
Vietnam’s imports
Value
(USD billion)
1.52
1.88
2.90
3.25
3.24
3.65
4.85
5.40
7.74
11.61
Value
(USD billion)
Growth
rate (%)
2.16
3.14
4.60
5.90
7.39
12.71
15.97
16.67
20.20
24.87
34.40
45.38
46.41
28.39
25.28
71.96
25.68
4.38
21.17
23.08
9.13
10.04
10.11
11.40
12.72
14.23
9.65
9.40
10.64
9.54
32.61
10.69
29.03
36.89
43.65
49.44
50.04
58.31
16.76
27.04
18.33
13.27
1.21
16.53
7.86
7.76
7.30
6.90
6.70
6.90
65.44
12.23
6.68
15.05
7.16
Growth
rate (%)
7.12
24.03
53.95
11.98
-0.11
12.44
33.02
11.40
43.31
49.99
24.71
12.84
13.18
14.93
16.57
21.95
35.49
41.27
10.53
2.66
13.28
10.98
32.49
61.67
16.29
21.13
China’s GDP
growth (%)
Sources: ITC (2018) [3], Vietnam Custom (2019a, 2019b) [18, 19]
In the period 2002-2011, Vietnam’s export
turnover to China increased quite fast from
USD 1.52 billion in 2002 to USD 11.13 billion
in 2011, equivalent to an increase by nearly 3
times and an average growth rate of 24.71% per
year (Table 1). Especially in the three years
2004, 2010 and 2011, exports grew
dramatically by 53.95%, 43.31%, and 49.99%.
respectively. Correspondingly, the economic
growth rates of China in these three years were
also high, ranging from 10% to 11%.
Since 2012 when China has shown signs of
economic slowdown, Vietnam’s export growth
rate to China has also slowed down. From 2012
to 2015, exports increased from USD 12.84
billion to USD 16.56 billion, equivalent to an
increase by only 9.36% per year on average.
From 2016 to 2018, exports increased at
relatively high growth rates, especially in 2017,
but the whole period 2012-2018 recorded an
average growth rate of 21.13%, which is lower
than that of 2001-2011.
The main export commodities of Vietnam
to China are machinery and equipment
(computers, telephones, electronic products and
components), agricultural products (fishery,
rubber, wood and wooden products, rice,
cashew nuts, vegetables and fruits), iron and
steel, mineral products, and manufacturing
products (textiles and garments, footwear).
Most of these key commodities experienced
lower export growth rates in the period
2012 - 2018 compared to the period 2002-2011.
For example, edible vegetables and certain
roots and tubers (1.07% versus 50.54%), wood
and wooden products (8.48% versus 59.82%),
footwear (29.71% versus 45.87%), mineral
products (-6.20% versus 20.32%), rubber
8
V.T. Huong, N.T.L. Phuong / VNU Journal of Science: Economics and Business, Vol. 35, No. 2 (2019) 1-12
(-0.66% versus 48.76%), iron and steel (-3.37%
versus 362.52%) and electronic machinery and
equipment (62.81% versus 90.08%)1.
China’s slowdown in its economy, along
with its policy focusing on domestic demand
and unstable border trade policies have caused a
decrease in China’s import demands, creating a
difficulty for Vietnam’s exports to China,
especially agricultural exports for which it is
difficult to find substitute markets in a short
time. In fact, in recent years, Vietnam has had
to “rescue” many agricultural products exported
to China, such as bananas, watermelons, and
pork because Chinese merchants stopped
buying these products at the border gates. Rice
is another agricultural product affected strongly
by China’s policy focusing on serving domestic
demand through raising tariffs on sticky rice and
controlling more stringently broken rice imported
from Vietnam. Vegetable, fruits, and rubber are
also commodities that might need to cope with
export decreases in the coming time because
China has promoted the tracing of the origin
of products.
growth rate of 2001-2011 (32.61%) and the
export growth rate in the same period (21.13%).
The main commodities Vietnam has
imported from China are machinery and
equipment (computers, telephones, electronic
products and components), iron and steel,
articles manufactured from iron and steel,
materials for the garment and footwear
industries, plastic and plastic products,
chemicals, fuels and vehicles. In the period
2012-2018, most of these key commodities had
lower import growth rates compared to the
period
2002-2011.
More
specifically,
Vietnam’s imports of electronic machinery and
equipment grew at only 26.8% in 2012-2018
compared to 68.82% in 2001-2011. The
corresponding figures for iron and steel were
9.85% and 35.03%, for plastic and plastic
products 23.90% and 51.61%, for articles made
of iron and steel 12.60% and 35.20%, for manmade staple fibers 10.04% and 43.83% and
organic chemicals 13.70% and 36.18%2.
3.2. Changes in Vietnam’s imports from China
China has been the largest supplying market
for Vietnam since 2004 with the import
turnover far higher than export turnover. In the
period 2002-2011, Vietnam’s imports from
China rocketed from USD 2.16 billion in 2002
to USD 24.87 billion in 2011, equivalent to an
increase by nearly 12 times and an average
growth rate of 32.61% per year, which is much
higher than respective data for exports (Table
1). Especially in the two years 2004 and 2007,
imports grew dramatically by 41.46% and
71.96%, respectively. Correspondingly, the
economic growth rates of China in these two
years were also high (10.11% and 14.23%).
Similar to exports, since 2012, Vietnam’s
imports from China have plummeted. For the
whole period 2012 - 2018, the average growth
rate of Vietnam’s imports from China stayed at
only 15.05%, which is far lower than the import
China’s economic slowdown has influenced
Vietnam’s exports and imports with China. The
clear evidence is the decrease in Vietnam’s
export and import growth rates in 2012-2018
compared to 2002-2011, especially with that of
key commodities.
However, the effects of China’s economic
decline on Vietnam’s exports seem to have
relaxed in the last two years - 2017 and 2018
when Vietnam’s exports to China have
gradually recovered their growth. Therefore, it
can be said that even though China’s economic
slowdown has affected Vietnam’s exports to
China, it has not been a big problem for
Vietnam so far.
Besides, China’s economic slowdown has
contributed to the substantially lower growth
rate of Vietnam’s imports from China. The
figures also point out that Vietnam’s imports
from China are more affected than Vietnam’s
_______
_______
1
2
Calculations by authors from ITC (2019) and Vietnam
Customs (2019a, 2019b).
3.3. Overall assessment and discussion of
changes in Vietnam’s trade with China
Calculations by authors from ITC (2019) and Vietnam
Customs (2019a, 2019b).
V.T. Huong, N.T.L. Phuong / VNU Journal of Science: Economics and Business, Vol. 35, No. 2 (2019) 1-12
exports to China as Vietnam’s imports from
China have suffered from a bigger decline in
the growth rate. Besides China’s economic
slowdown, this can also be partially explained
by the fact that in recent years, Vietnam has
well taken advantage of Free Trade Agreements
(FTAs), such as Vietnam-Japan Comprehensive
Economic Partnership Agreement (VJEPA) or
the Vietnam - Korean Free Trade Agreements
(VKFTA), to diversify markets towards
reducing gradually the dependence on the
Chinese market.
As analyzed above, the US - China trade
war might be among the key reasons for not
only China’s but also a world economic
slowdown in the near future. Therefore, it is of
great importance to examine the potential
effects of the US - China trade war on Vietnam
- China trade, especially when this trade war is
now seriously escalating. Vietnam’s trade with
China could be affected both positively and
negatively in the context of the trade war.
Firstly, Vietnam could have a greater
chance to import inputs from China at lower
prices. Under imposition of the US trade
restrictions, Chinese enterprises are under
pressure to replace the US with other markets to
promote exports. As a result, China’s
commodities from consumption goods to
materials might be sold at lower prices to
reduce the tension of a large inventory. With
the advantages of proximity and being a
traditional partner, Vietnam is likely to be a
highly substituting market for the US. At
present, Vietnam is largely reliant on Chinese
raw materials and equipment to produce key
exported products such as electronic products,
computers, telephones, garments and textiles,
and footwear. Therefore, the US-China trade
war could create the opportunity for Vietnam to
import more from China at lower prices to
eventually promote exports.
Secondly, Vietnam may need to cope with
more difficulties to increase exports to China. If
China in the short term cannot find a market to
replace the US, a part of Chinese commodities
would be kept for domestic consumption and
therefore it would be more difficult for not only
9
Vietnam but also other countries to promote
exports to China.
Thirdly, Vietnam can become an
intermediate gate for China to export to the US.
As the Chinese commodities are imposed with a
high tariff, Chinese enterprises could try to find
a third destination through which to export to
the US, which is still a promising and profitable
market for China. Low priced Chinese goods
would be easy to enter the Vietnamese market
and then be exported to the US under
Vietnam’s origin. This would create difficulties
for Vietnam to control the quality of goods
exports to the US and as a consequence
Vietnam might be punished by the US when the
US strengthens supervision of tracing the origin
of goods imported from Vietnam [17].
Fourthly, Vietnam’s trade balance with
China would be in more serious deficit as
Vietnam is more dependent on China’s goods.
As mentioned above, to compensate for a
reduction in exports to the US, Chinese
enterprises could divert their exports to other
markets and Vietnam would be a good choice.
On the one hand, it would be good for Vietnam
having a greater chance to import raw materials
and inputs for producing exported products. On
the other hand, the influx of Chinese
commodities into Vietnam would worsen
Vietnam’s trade balance and also might alter
the import structure of the trade between
Vietnam and China, by which Vietnam would
tend to import more consumption goods and
eventually create more competition for
domestic enterprises. Incorporated with the
possibility of being a third destination through
which China exports to the US, the trade
balance of Vietnam with China is likely to be in
a deficit at a higher level and Vietnam’s
domestic production would be under higher
pressure of competition from China.
Finally, the increase in China’s FDI flows
into Vietnam as a result of the US - China war
might indirectly affect Vietnam - China trade.
This flow of FDI can turn Vietnam into a
“backyard” for Chinese companies to undertake
production and then export to the US. To serve
for FDI inflows from China, Vietnam could
10
V.T. Huong, N.T.L. Phuong / VNU Journal of Science: Economics and Business, Vol. 35, No. 2 (2019) 1-12
also import more labor, commodities,
technology, machinery and equipment from
China. This situation might also result in other
unexpected
impacts
for
example
environmental pollution and national security.
4. Conclusions and implications
By comparing China’s growth rate in two
periods: 2002-2011 and 2012-2018, this paper
points out that China has experienced an
economic slowdown since 2012. On average, in
the period 2002-2011, China’s growth rate
stood at a very high level of 10.86% per year,
enabling the country to jump from the sixth to
the second-biggest economy in the world.
However, in 2012, China’s growth rate fell to
only 7.8% - the lowest level in 12 years and
then continuously decreased until the end of
2018. The average growth rate of 2002-2018
was only 7.16%, which is much lower than in
the previous period. There are several key
reasons underlying the economic slowdown of
China namely: (i) the decrease in China’s
export growth, (ii) the decrease in China’s
investment efficiency, (iii) China’s transition to
a new growth model and (iv) the US-China
trade war.
In the context of China’s economic
slowdown, Vietnam’s trade with China has
undergone some notable changes. The growth
rates of Vietnam’s two-way trade with China
have witnessed a downward trend. Both
Vietnam’s import and export growth rates with
China reduced over the two periods. More
specifically, Vietnam’s average export growth
rate for the period 2002-2011 was 24.71% and
reduced to 21.13% for the period 2012-2018.
The corresponding figures for Vietnam’s
average import growth rate were 32.61% and
15.05%. A deeper look at these figures suggests
that even though China’s economic slowdown
did affect Vietnam’s exports to China, it has not
really been a big problem for Vietnam so far.
On the contrary, it seems that Vietnam’s
imports from China have more seriously
suffered. In the coming time, if the Chinese
economy worsens, especially if the US-China
trade war continues escalating, the impacts of
China’s economic decline on Vietnam’s trade
with China might be more significant.
The ongoing US-China trade war will slow
down both China’s and the world’s economic
growth and therefore could affect Vietnam’s
trade with China both positively and negatively.
If this were the case, Vietnam would have more
chance to import raw materials and equipment
from China at lower prices. However, Vietnam
could meet difficulties promoting exports to
China as the part of Chinese commodities that it
finds difficult to export to the US are likely to
be kept for domestic consumption. Vietnam can
also become an intermediate gate for China to
export to the US, creating difficulties for
Vietnam to manage the quality of goods
exported to the US and therefore could become
a future target for US trade punishment. The
US-China trade war could also result in
Vietnam’s greater reliance on Chinese goods
and a higher trade deficit of Vietnam with
China. These findings imply that the slower
growth in Vietnam’s imports from China as a
consequence of China’s economic slowdown
might be partially compensated for by the
impact of the trade war between the US
and China.
Through analysis and evaluation of China’s
economic slowdown and the changes in
Vietnam’s trade with China in this context, the
following implications are highlighted by this
paper to support Vietnam to deal with the
impacts from China’s economic slowdown in
the future.
Firstly, in order to continue reducing the
reliance on imports from China’s market,
Vietnamese enterprises should diversify and
find out new sourcing markets for inputs such
as India, Bangladesh, Thailand, and Malaysia
and focus more on markets with high
technology and innovation such as Japan,
Korea, the EU and the US. It is also essential to
increase the local content of imported inputs
V.T. Huong, N.T.L. Phuong / VNU Journal of Science: Economics and Business, Vol. 35, No. 2 (2019) 1-12
and at the same time develop supporting
industries for key exported products that have
been dependent largely on China’s input supply
such as machinery and equipment, garments
and textiles, and footwear.
Secondly, to boost exports to China,
Vietnamese enterprises should diversify the
types of goods exported, improve productivity
and quality, and pay more attention to
copyright
and
trademark
development.
Agricultural exporters should change their
approach to food safety issues to meet the higher
demand of Chinese consumers by investing more
in preservation technology, controlling better the
origin of agricultural inputs as well as final
commodities, managing packaging more
carefully, and understanding better China’s
technical barriers and inspection requirements. In
addition, it is of great importance for enterprises
to know more about the harvest time in China to
select the appropriate time to export agricultural
products to China.
Finally, in order to cope with the US China trade war, the Vietnamese government
should keep a close watch on the responses of
these two nations, produce predictions of
possible scenarios of the trade war and prepare
strategies for each scenario. The government
needs to update regularly and promptly the list
of goods on which the two countries impose
tariffs as well as the USD/RMB exchange rate,
and have a quick information channel to
businesses on these changes. At the same time,
Vietnam should also consider a number of
measures to control the influx of Chinese goods
being diverted to the Vietnamese market, such
as applying non-tariff measures appropriately,
strengthening the inspection of Chinese goods
at border gates, and improving the quality
requirements for imported Chinese goods. For
Vietnamese enterprises, it is necessary to
closely observe the global market changes,
movements of the Chinese and US markets, and
decisions of current and potential trading
partners. In addition, businesses need to make
full use of FTAs that are or will be in effect,
especially the CPTPP (Comprehensive and
Progressive Agreement for Trans-Pacific
11
Partnership) and the EVFTA (the EuropeanVietnam Free Trade Agreement), to proactively
adopt appropriate measures to take advantage of
FTAs opportunities or avoid losses from
China’s economic slowdown.
This paper has pointed out the situation and
the main causes of China’s slower economic
growth and has shown evidence of changes in
Vietnam-China trade under the current
slowdown by linking the causes and the
changes. The limitation of the paper is to ignore
quantifying the impact of China’s GDP
slowdown on imports and exports of Vietnam
with China. Therefore, future research can use
quantitative methods such as the gravity model
or the Computable General Equilibrium model
to separate the impact of different factors on
changes in Vietnam-China trade in which the
GDP growth rate is used as a variable.
References
[1] World Bank, World Bank Open Data. In: World
Bank (ed.), World Bank Group: Washington D.C.,
2018a.
[2] Nguyen Cam Nhung, Vu Thanh Huong, Tran Viet
Dung, The World and the Vietnamese Economy in
2018: Prospects for 2019 and Some Policy
Implications for Vietnam, VNU Journal of Science:
Economics and Bussiness 35 (2019) 23-35.
/>[3] ITC, Trade Map, In: International Trade Center
(ed.), International Trade Center: Geneva, 2019.
[4] Lee, John, China’s economic slowdown: What are
the strategic implications? The Washington
Quarterly 35 (2015) 123-142.
[5] Xu, Tanlei, An analysis of the China’s economic
slowdown, School of Business and Social
Sciences, Aarhus University, 2015.
[6] Lin, Justin Yi-fu; Morgan, J. Peter, Wan,
Guanghua Wan, Slowdown in the People’s
Republic of China: Structural factors and the
Implications
for
Asia,
ADB
Institute
Report, 2018.
[7] Wu, X. Harry, On the sustainability of the
People’s Republic of China’s Growth model - A
productivity perspective, In: Lin, Justin Yi-fu;
Morgan, J. Peter, Wan, Guanghua Wan (editors),
12
[8]
[9]
[10]
[11]
[12]
[13]
V.T. Huong, N.T.L. Phuong / VNU Journal of Science: Economics and Business, Vol. 35, No. 2 (2019) 1-12
Slowdown in the People’s Republic of China:
Structural factors and the Implications for Asia,
ADB Institute Report, 2018.
Fukao, Kyoji, Yan, Tangjun, The People’s
Republic of China’s slowdown: Lessons from
Japan’s experience and the expected impact on
Japan’s economy, In: Lin, Justin Yi-fu; Morgan,
J. Peter, Wan, Guanghua Wan (editors),
Slowdown in the People’s Republic of China:
Structural factors and the Implications for Asia,
ADB Institute Report, 2018.
Zang, Qiong, Bai, Chong-En, Is the People’s
Republic of China’s Current slowdown a cyclical
downturn or long-term trend, In: Lin, Justin Yi-fu;
Morgan, J. Peter, Wan, Guanghua Wan (editors),
Slowdown in the People’s Republic of China:
Structural factors and the Implications for Asia,
ADB Institute Report, 2018.
Deorukhkar, Sumedh, Xia, Le, Gauging the
impact of China’s growth slowdown on emerging
Asia,
Asia
Economic
Watch,
BBVA
research, 2016.
Zhai, Fan, Morgan, Peter, Impact of the People’s
Republic of China’s growth slowdown on
emerging Asia: A general equilibrium analysis,
ADBI Working Paper Series, No. 50,
March 2016.
Lakatos, Csilla; Maliszewska, Maryla; OsorioRodarte, Israel & Go, Delfin, China’s Slowdown
and Rebalancing: Impacts on Sub-Saharan Africa,
Journal of Economic Integration 32 (4) (2017)
759-803.
Ohshige, Hitoshi; Kaya, Demet, Inoue, Tomoo,
Estimating the impact of slower People’s
Republic of China growth on the Asia and Pacific
[14]
[15]
[16]
[17]
[18]
[19]
Region: A global vector autoregression model
approach, In: Lin, Justin Yi-fu; Morgan, Peter. J.
& Wan, Guanghua Wan (editors), Slowdown in
the People’s Republic of China: Structural factors
and the Implications for Asia, ADB Institute
Report, 2018.
Thorbecke, Willem, Investigating how a
slowdown in the People’s Republic of China
affects its trading partners and how Asia can
mitigate the impact, In: Lin, Justin Yi-fu; Morgan,
J. Peter, Wan, Guanghua Wan (editors),
Slowdown in the People’s Republic of China:
Structural factors and the Implications for Asia,
ADB Institute Report, 2018.
Yan, Sophia, “Made in China” isn’t so cheap
anymore, and that could spell headache for
Beijing,
Asia-Pacific
News.
2017 (accessed 16/12/2018).
World Bank, China’s economic update December
2018: Fiscal policies for rebalancing, 2018b.
Nguyen Anh Thu, Vu Thanh Huong, The United
States - China trade war and some potential
impacts, Proceedings of Vietnam International
Economic Integration Forum “International
Economic Integration in the new context:
Dynamic, Renovative, Practical and Efficiency”,
Hanoi 4/12/2018, 2018, pp. 59-71.
Vietnam Customs, Exports by key partners and
commodities: December 2018, Report No
5N/TCHQ, 2019b.
Vietnam Customs, Imports by key partners and
commodities: December 2018, Report No
5N/TCHQ, 2019b.