DEA model for measuring operational efficiency of Vietnam’s commercial banks by using genetic algorithms
Bạn đang xem bản rút gọn của tài liệu. Xem và tải ngay bản đầy đủ của tài liệu tại đây (326.47 KB, 16 trang )
Nguyen Quang Khai
DEA Model for Measuring Operational
Efficiency of Vietnam’s Commercial
Banks by Using Genetic Algorithms
Nguyen Quang Khai(1)
Received: 18 July 2017 | Revised: 12 December 2017 | Accepted: 20 December 2017
Abstract: Data envelopment analysis (DEA) is a nonparametric
method used to evaluate the performance of organizations. In recent
years, the application of the DEA method in measuring the operational
efficiency of commercial banks has become more popular. This
research was conducted by using genetic algorithms, whose aim
was to find out appropriate variables to evaluate the performance
of Vietnam’s commercial banks. The result pointed out three input
variables including the total amount deposit, the number of employees
and leverage; and two output variables including the total revenue
and net income. The model was built from the data of Vietnam’s
commercial banks and provides a framework to assist further
researches that apply DEA in evaluating the bank’s performance.
Keywords: genetic algorithms GA, operational efficiency of banks.
jel Classification: C14 . C58 . G21 . G30.
Citation: Nguyen Quang Khai (2017). DEA Model for Measuring Operational
Efficiency of Vietnam’s Commercial Banks by Using Genetic Algorithms.
Banking Technology Review, Vol 1, No.2, pp. 257-272.
Nguyen Quang Khai - Email:
(1)
Ho Chi Minh City Industry and Trade College
20 Tang nhon Phu, Phuoc Long B Ward, District 9, Ho Chi Minh City.
Volume 1: 149-292 | No.2, December 2017 | banking technology review
257
DEA MODEL FOR MEASURING OPERATIONAL EFFICIENCY OF VIETNAM’S COMMERCIAL BANKS ...
1. Introduction
DEA is used in many areas such as education, agriculture, sport, health,…
One of the reasons that the use of DEA is widespread, is that many of its inputs
and outputs are used to measure the operational performance. However, it is very
difficult to select the appropriate variables. Thus, researchers are trying to find a
set of common variables for one problem. There are not many studies in Vietnam’s
banking sector that can be used to build an appropriate DEA model. Previous
studies using the DEA model were based on subjective arguments or similar
studies in the world which consequently leads to inaccurate and unconvincing
results. From that reality, this research was conducted to achieve two purposes:
(i) to find a new approach, which is more precise for building DEA model; (ii)
to select inputs and outputs variables more logically and scientifically fit for the
performance evaluation of Vietnam’s commercial banks. The outcome of this
research study could also be used for future reference when building DEA model
in different area.
2. Literature Review
2.1. An Overview of DEA Method
Data envelopment analysis or DEA is a linear programming technique developed
in the work of Charnes, Cooper & Rhodes (1978). However, unlike the Stochastic
Frontier which uses the econometric methods, DEA relies on mathematical linear
programming to estimate the marginal production.
Charnes et al. (1978) introduced the DEA approach developed from Farrell's
(1957) technical efficiency measure - from a process of single input and output
relations to a multi-input, multi-output process. Since then, DEA has been used
to evaluate efficiency in many areas. Färe & Grosskopf (1994) have proposed
the solution for each decision-making unit (DMU) which is to use inputs at
the minimum necessary level to produce a set of outputs. The input-oriented
technical efficiency is a measure of the DMU's potential output from a given
set of inputs. According to Lovell, Färe & Grosskopf (1993), in the case that
input variables are used in a model easily controlled by an enterprise, the input
orientation model shall be more appropriate and vice versa. In the banking
sector, the application of the input-oriented technical efficiency shall be more
appropriate.
The linear programming (LP) model measuring the input-oriented TE of any
DMU is:
258 banking technology review | No.2, December 2017 | Volume 1: 149-292
Nguyen Quang Khai
Min(Z), on the condition:
J
ujm ≤ ∑Ljujm
j=1
J
∑Ljunj ≤ Zxnj
j=1
(m=1,2,…, M)
(n=1,2,…, N)
t
KrA)
tr(Acalculated
Where: Lj ≥ 0 (j = 1,2,…,RM
J); =Zcorr(A,
– efficiency
for each DMUj;
Kr, A)measure
=
t
tr(Xn
X)produced by DMU ; L
ujm - output mass m produced by DMUj; xnj - input mass
j
j
- intensity variable for DMUj.
-1
k
2
2
Σi=1Υi(Cm) i
tr[S ]RSR
The effect of the returns to scale
be explained
by Banker,
Charnes & Cooper
= can
=
k
Υ
Σ
tr(S)
j=1
i
(1984). With CRS-constant returns to scale, the condition ΣLj ≤ 1 is added, and
with the variable-to-scale effect (VRS), where ΣLj = 1 is added. Choosing between
two assumptions depends on the characteristics of the DMU being considered. In
= n1 isAtnot
A effective, so the article shall be conducted
general, constant returns to Sscale
under the assumption of VRS.
Since the variables Z are calculated for each DMU, they are estimated from a
set of observed data. The value of Z = 1 implies that the firm is efficient, while Z <1
is not efficient.
2.2. Selection of Input and Output Variables for DEA Model
In order to select the relevant variables, some methods were proposed. Jenkins
& Anderson (2003) proposed a multivariate statistics method to cut down variables
with low correlation. Ruggiero (2005) suggested regression analysis be an efficient
method to eliminate low correlation variables, using high correlation ones if they
are statistically significant. These researches build the DEA model mainly based
on the correlation between variables and usage of statistical technique. The biggest
disadvantage of this method is the requirement of a number of DMUs; therefore, it
is very difficult to implement the method in economic sectors with small amount
of DMUs, such as Vietnam’s banking sector. Furthermore, how correlative the
variables need to be to be accepted and put into the model is still a question left
open by the scientists.
Morita & Haba (2005) proposed a method based on an experimental design
and orthogonal layout in order to detect optimal variables statistically for the
DEA model. Edirisinghe & Zhang (2007) built a general DEA model based on the
principle of maximizing the correlation between external performance indexes.
These studies tried to propose consistent method and model which are applicable
Volume 1: 149-292 | No.2, December 2017 | banking technology review
259
DEA MODEL FOR MEASURING OPERATIONAL EFFICIENCY OF VIETNAM’S COMMERCIAL BANKS ...
in various sectors. Morita & Avkiran (2009) suggested using three-level factor
design method and proved that, implementation of this method allows receiving a
more suitable DEA model compared to the random selection of variables.
Overall, these researches have suggested different methods and solved out
the variables for each individual sector. A similar research in Vietnam banking
sector (Nguyen Quang Khai, 2016) using three-level factor design method and
Mahalanobis distance suggested two input variables including the total of deposits
and the number of employees, and three output variables including the revenue, net
profit and leverage. However, this method depends massively on the delimitation
of two groups - high efficiency and low efficiency. Nowadays, Vietnam has yet to
have an official data source from this delimitation. Generally, the disadvantages of
the factor design method of the above researches are randomly combined variables
and unconsidered correlation between them.
Some recent researches have used the genetic algorithms GA to find out
a suitable DEA model for each sector. This method is considered to be rather
new and highly evaluated. Whittaker et al. (2009) used data collected from US
agriculture production units in two years 1996 and 1997. The result showed
that GA was a suitable DEA model building method to evaluate the operational
performance in agricultural and environmental sectors. Panahi, Fard & Yarbod
(2014) built a DEA model from 19 input and output variables and genetic
algorithms for listed companies on the Tehran stock market. The result proved
that building DEA model accordingly could help building portfolio efficiently,
in other words, DEA and genetic algorithms allow effective evaluation of stock
companies’ performances. Another research (Aparicio, Espin, Moreno & Panser,
2014) evaluated DEA model through genetic algorithms GA and parallel python
PP, which led to a conclusion that, using genetic algorithms in order to find out
a suitable DEA model is a need in the future. Razavyan & Tohidi (2011) pointed
out that using DEA model and genetic algorithms could evaluate and rank DMUs
efficiently. Especially, Trevino & Falciani (2006), as well as Cadima, Cerderira,
Silva & Minhoto, 2012), said that using genetic algorithms to find subset R for
any multivariable statistic model. These authors shown specific steps in finding a
suitable subset and thought that genetic algorithms are a good method in terms
of selecting variable sets. According to this propose, Madhanagopal et al. (2014)
used genetic algorithms GA to find a model to be considered suitable for Indian
commercial banks. Therein, one input variable was amount of loan, while five
output variables are total debt, other incomes, net lending incomes, investment
and net profit.
260 banking technology review | No.2, December 2017 | Volume 1: 149-292
Nguyen Quang Khai
Overall, researchers thought that genetic algorithms method is a good method.
However, the basic disadvantage of this method is the subjective selection of
output and input variables. For DEA model, this drawback may lead to a selection
of low correlation variables. Due to this reason, this research was conducted with
the purpose of providing a new and complete method by considering correlation
from the formation of variable sets. In other words, the author shall examine
the correlation between input and output variables before implementing genetic
algorithms GA. With this method, the author looks forward to finding relevant
input and output variables for DEA model in order to evaluate the performance
of Vietnam’s commercial banks. Furthermore, the author uses results from this
research to verify the results of previous researches, especially those which were
conducted in Vietnam, and contribute to the building of a standard DEA model for
this country banking sector.
3. Methodology and Data
3.1. Genetic Algorithms and Building DEA Model
The concept of GA was first introduced by professors John Holland and De Jong
in 1975. It was a thorough process of finding variables based on the basic principle
of natural selection and genetic mechanisms, which means crossing over, mutation
and survival of the fittest for optimization and analysis of machine learning. The
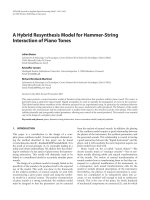
steps for performing genetic algorithms are shown in Figure 1.
Based on the principle of the selection of R-set by Cadima et al. (2012), the best
combination of variables for the study and the nature of the searching procedures
for GA are summarized as follows:
For any subgroup of variables (called r), a subset of variables r is randomly
chosen from the set of variables k as an initial population (N), where (r≤k). In
each iteration, the number of breeding pairs established accounts for half of the
population (ie N/2) and each pair produces one (a new subgroup of r) and the child
must receive all attributes from parent. Each father selected from the population
in direct proportional to his or her value based on the original criteria. For each
father F, an M mother is chosen with equal probability among the members of the
population, of which at least two variables are independent of F. A child born by
a pair (F, M) includes all variables from its parents. The remaining variables were
selected with equal probability from the difference in parental symmetry with the
limitation that at least one variable from M / F and one from F/M would be selected.
Parent and child pairs are ranked in order of standard value and the best group of
Volume 1: 149-292 | No.2, December 2017 | banking technology review
261
DEA MODEL FOR MEASURING OPERATIONAL EFFICIENCY OF VIETNAM’S COMMERCIAL BANKS ...
Step 1
Generate initial
random population
Human artificial
chromosome
Calculate the fitness
of individuals
by fitness function
Population and
adaptive values
Step 2
Step 3
Meet the termination
conditions
Step 4
No
Yes
End
Create initial random
population copy the chromosome
and assign the fitness to each one
New population
Crossing over
in chromosome
Crossover Operator
Random mutation
on new population
Mutation Operator
Step 5
Step 6
Source: Trevino et al. (2006).
Figure 1. Genetic algorithms flow chart
subsets of r will create the next generation which will be used as the population for
next time. Standards stop at generations satisfying subgroup’s terms of quality g (g>
gmax).
In order to measure the quality of each subgroup, this study uses the RM
coefficients of Cadima, Cerdeira & Minhoto (2004) and McCabe (1984). This
coefficient is the weighted average of the principal components of the data set and r
- the subset variables. Furthermore, RM principal were also introduced by Cadima
262 banking technology review | No.2, December 2017 | Volume 1: 149-292
Nguyen Quang Khai
J
J
≤ ∑LjujmM) (m=1,2,…, M)
ujm ≤ ∑Ljujm ujm
(m=1,2,…,
& Jollife (2001), Cadima et j=1al. (2012). Thej=1 value of the RM coefficient ranges
J
J
between 0 and 1.
Ljunj ≤ ZxnjN) (n=1,2,…, N)
(n=1,2,…,
∑Ljunj ≤ Zxnj ∑
j=1
The RM coefficient:j=1
tr(AtK A)
RM = corr(A, KRM
,r A)==corr(A, Ktr,r A) =
tr(X X)
=
With:
2 )2-1
Υi(C
Σki=1Υi(Cm)2i Σki=1tr[S
]mRSRi
=
=
=
k
k
Υi
Σj=1tr(S)
Σj=1Υi
S = n1 AtA
tr(AtKrA)
tr(XtX)
tr[S2]RS-1
R
tr(S)
S = n1 AtA
Where: A - full matrix; Kr - the orthogonal projection matrix on the open
subspace created by a subset of variables r; S - correlation matrix K*K of the whole
data; R - the set of variables r in the set of variables; SR - the sub-matrix r x rof
S, derived from keeping rows and columns with index R; [S2] R - the sub-matrix
Rx of S2 obtained by retaining the rows and columns associated with R; γi - the
ith eigenvalue of the covariance matrix (or correlation) is defined by A; Corr Correlation matrix; tr - matrices.
3.2. Data
According to Sealey & Lindley (1977), in the big picture of all studies in the
banking sector, there are two approaches to the selection process of input and
output for the DEA model. It is a "production" and "intermediation" approach.
Under the "production" approach, the banking sector is a service sector which
uses inputs such as labor and capital to provide deposits and loan accounts. An
intermediation approach regards banks as financial intermediary funds between
savings and investment spending. Banks collect deposits, use labor and capital, then
transfer these sources of fund to lender to create assets and other income. However,
all previous studies used only correlative analysis. Taking into consideration these
two approaches, Morita et al. (2005), Morita et al. (2009) argued that using random
methods for selecting variables requires a combination of both approaches. Results
from previous authors have proved that such combinations will help to build a
better model. For the above reasons, with the GA method, the writer believes that
combining the two way of approach is necessary and appropriate, in which all the
input and output variables are considered as a whole. The initial variables were only
Volume 1: 149-292 | No.2, December 2017 | banking technology review
263
DEA MODEL FOR MEASURING OPERATIONAL EFFICIENCY OF VIETNAM’S COMMERCIAL BANKS ...
selected after previous studies in the world, as well as in Vietnam, were carefully
examined.
Table 1. Initial selected variable
Input
Variable name
Output
Label
Variable name
Label
Total capital
VON
Total of loans
TCV
Total deposit
TTG
Other income
TNK
Number of branches
TCN
Financial income
DTC
Labor
TLD
Total revenue
TDT
Interest rate
TLV
Investment
DTF
Other expenses
CPK
Net profit
LNR
Total expenses
TCP
Gross profit
LNG
Cash
TTM
Revenue/profit ratio
DLN
Fixed assets
TCD
Leverage ratio
RDB
The data is taken from financial reports, annual reports and other information
published in the media of 34 commercial banks in Vietnam in 2015. The commercial
banks appeared in the research are those with information widely published and
meet the criteria of the research.
4. Results and Discussion
The table 2 below shows the descriptive statistics for the research data.
First of all, sets of optimal input and output variables were selected by using
GA. As mentioned, the research applied the principle of the subset R by Cadima
et al. (2012) with random selection of the best subsets. The number of inputs and
outputs selected were 10 and 8 accordingly. In DEA model, Cooper, Seiford &
Tone (2007) provided two thumb rules for sample selection. First of all, n > max
(S * P), meaning sample size has to be greater than or equal to multiplication of
numbers of input and output factors. Secondly, n ≥ 3 (S + P), meaning numbers of
observations in data should have at least 3 times the total of inputs and outputs, in
which n is the sample size (number of DMU), S is the number of inputs and P is the
number of outputs. According to these conditions, research proceeded on selecting
5 or 6 outputs and inputs of any kinds, since the number of commercial banks
(DMU) are 34, less than (10*8) = 80 and 3 (S + P) = 3 (10 + 8) = 54. The selection
is based on identification of correlation between variables principle. Variables
264 banking technology review | No.2, December 2017 | Volume 1: 149-292
Nguyen Quang Khai
Table 2. Research data statistics
Indicator
Mean
Min
Number of banks
Max
Std
34
Total of capital (millions
VND)
343,267,215
Total of deposits (millions
VND)
224,123,564 18,325,682 461,366,024 221,864,226
Number of branches
Labor (people)
3,368,727
720,362,607 264,125,142
63
14
152
53
8,436
1,902
20,406
6,584
Interest expense (millions
VND)
14,235,765
1,294,133
23,563,821
10,654,780
Other expenses (millions
VND)
345,439
548,620
10,261,977
1,547,286
Total of expenses (millions
VND)
8,767,747
921,377
16,912,899
9,126,579
Cash (millions VND)
4,326,491
1,737,412
8,421,360
3,276,548
Assets (millions VND)
3,246,065
1,003,764
8,780,285
2,546,435
31%
24%
46%
15%
Leverage ratio
Total of loans (millions
VND)
Other incomes (millions
VND)
218,285,763 14,735,077 484,516,322 187,475,226
192,065
20,820
392,6120
87,248
28,095,184
2,102,271
41,914,371
23,365,478
Total revenue (millions VND 29,043,564
2,132,890
48,224,665
29,265,431
Financial income (millions
VND)
Investment (millions VND)
1,083,986
465,011
2,570,122
987,832
Net profit (millions VND)
2,182,657
170,574
5,705,402
1,835,964
Gross profit (millions VND)
2,018,765
808,139
8,350,551
3,347,287
2.1
1.8
3.5
0.9
Revenue/ Profit ratio
with correlation level as 0.6 are kept, while variables with lower correlation are
eliminated from the process of implementing genetic algorithms GA. After the
correlation examination process, 6 inputs and 5 outputs with highest correlation
were found. Six inputs were total of deposits (TTG), number of employees (TLD),
numbers of branches (TCN), total expenses (TCP), leverage ratio (RDB) and cash
(TTM). Five outputs are revenue (TDT), net profit (LNR), revenue/ profit ratio
(DLN) , total of loans (TCV) and investments (DTF).
Volume 1: 149-292 | No.2, December 2017 | banking technology review
265
DEA MODEL FOR MEASURING OPERATIONAL EFFICIENCY OF VIETNAM’S COMMERCIAL BANKS ...
Table 3. Result of subsets and their highest values accordingly
Inputs
r
Outputs
Subset
Highest value
Subset
Highest value
1
TTG
0.8675
LNR
0.9014
2
TTG, TCN
0.9116
TDT, LNR
0.9216
3
TCN, TTM, TLD
0.9540
TDT, TCV, DTF
0.9864
4
TLD, TCP, TCN, TTM
0.9753
TDT, LNR, TCV, DTF
0.9906
5
TLV, TCN, TCP, RDB,
TTM
0.9857
TDT, LNR, DLN, TCV,
DTF
0.9937
6
TTG, TLD, TCN, TCP,
RDB, TTM
0.9942
Table 3 shows that subsets of inputs, outputs and highest values generated from
the genetic algorithms GA give different values of r. With the 6th r for inputs and
5th r for outputs, the highest values are relatively 0.9942 and 0.9937. Therefore, the
numbers of maximum output and input variables would be 5 and 6.
By applying DEA (input orientation - VRS), the operational efficiency of
banks was calculated for different combination of inputs and outputs subsets.
Analysis started with r = 1 for input and output, meaning one input variable and
one output variable (input variables of number of employees and output variables
of total revenue were randomly chosen). This Model was named M11. Next,
the calculation was executed by keeping the same input variable and alternately
increasing value of r (2, 3, 4 and 5) for output variables, and those models were
named M12, M13, M14 and M15. Similar methods were followed in the other
subsets of both inputs and outputs. There were a total of 30 models built during
the process of this research.
Table 4 illustrated variables used in different models, effectiveness quantity,
mean efficiency score and percentage of mean efficiency score change. In detail, the
effectiveness quantity is DMU with TE value as 1,while the mean efficiency score is
the mean TE value from DEA model. The selection process was as follows: Firstly,
the author calculated the percentage difference between mean efficiency score for
model M11 and M12. Results show the difference is only at the rate of 4,6% less
than 10%. Therefore, model M11 was kept in order to calculate the mean value
score of model M13. However, the difference in mean efficiency score between
model M11 and M13 was at a degree of 8,6%, so model M11 was kept as the base
model. This process was continued until one model holding a difference rate above
266 banking technology review | No.2, December 2017 | Volume 1: 149-292
Inputs
*
*
M14
*
*
M15
*
*
M21
*
*
M22
*
M23
M24
4
% change
Mean efficiency
0.547
score
4.570
0.572
6
0.635
9
8.570 11.010
0.621
10
4.570
0.664
11
*
*
DTF
*
*
*
*
TCV
*
*
*
*
LNR
DLN
*
5,670
0,671
11
0.722
12
*
*
9.290 13.700
0.694
9
*
*
TDT
*
*
RDB
TTM
7.340
0.775
13
*
*
*
*
*
*
*
M13
TCP
*
*
M12
*
*
*
M11
TCN
TLD
TTG
Number of
efficient banks
Outputs
Table 4. Individual DEA models results
0.140
0.723
8
*
*
*
*
*
*
*
M25
0.852
16
*
*
*
*
*
M32
0.876
13
*
*
*
*
*
*
M33
3.290
0.824
11
*
*
*
*
*
*
*
M34
2.820
0.876
13
*
*
*
*
*
*
*
*
M35
Source: Author’s calculation.
8.860 18.010 2.820
0.786
11
*
*
*
*
M31
Nguyen Quang Khai
Volume 1: 149-292 | No.2, December 2017 | banking technology review
267
Inputs
9
268 banking technology review | No.2, December 2017 | Volume 1: 149-292
% change
8.670
Mean efficiency
0.784
score
5.710
0.806
10
1.190
0.862
8
7.170
0.795
12
*
DTF
*
*
*
*
*
*
*
*
M44
TCV
*
*
DLN
*
*
*
TDT
*
*
*
*
M43
LNR
*
RDB
*
TTM
*
*
*
*
M42
TCP
*
TLD
*
M41
TCN
TTG
Number of
efficient banks
Outputs
3.020
0.827
13
*
*
*
*
*
*
*
*
*
*
M45
2.160
0.834
11
*
*
*
*
*
*
M51
2.040
0.835
12
*
*
*
*
*
*
*
M52
6.770
0.798
10
*
*
*
*
*
*
*
*
M53
6.370
0.801
10
*
*
*
*
*
*
*
*
*
M54
3.520
0.823
12
*
*
*
*
*
*
*
*
*
*
M55
Table 4. Individual DEA models results (continue)
5.580
0.807
11
*
*
*
*
*
*
*
M61
1.390
0.864
11
*
*
*
*
*
*
*
*
*
M63
1.070
0.843
12
*
*
*
*
*
*
*
*
*
*
M64
6.770
0.798
9
*
*
*
*
*
*
*
*
*
*
*
M65
Source: Author’s calculation.
8.540
0.785
9
*
*
*
*
*
*
*
*
M62
DEA MODEL FOR MEASURING OPERATIONAL EFFICIENCY OF VIETNAM’S COMMERCIAL BANKS ...
Nguyen Quang Khai
10%, and a model based on a new basis was found. Thus, the result in table 4, model
M14 would be chosen to be the next base model due to the difference rate was
11%. This process was continued until the end of model M65 and discovered that
one model, which was M32, reached the final difference rate greater than 10%, the
latter models’ rates were less than 10%. Thus, model M32 was selected to be the base
model in order to measure performance of commercial banks.
The result specified 5 variables for DEA model with three input variables and two
output variables. Three input variables are: total of deposit, number of employees
and leverage ratio, in which, total of deposit, number of employees are already used
by other researches (Sathye, 2001; Morita et al., 2009; Soteriou & Zenios, 1999);
while leverage ratio was used by Morita et al. (2009), Lauterback & Vanisky (1999).
Two output variables are total revenue and net profit. These variables were selected
as output variables by Yildirim, 1999; Lauterbach et al., 1999.
Generally, the result is rather consistent with previous researches. Thanks to the
DEA model with five specified variables, the number of variables for DEA model has
significantly decreased. The model becomes more precise and assures the validity of
data from Vietnam’s commercial banks. In addition, that high correlation between
model variables helps increase the value of the model.
5. Conclusion
In order to evaluate the bank’s operational performance, the DEA technique
is used as a nonparametric method and does not require any hypothesis as in
parametric method. The main advantage of DEA compared to other performance
measuring methods, is that it uses a lot of inputs, outputs, and this allows the
researchers to find out appropriate input and output variables for each sector.
Researchers suggested that different input and output variables and the lack of any
variables can affect notably on the efficiency measurement. Thus, selecting the best
establishment of input and output variables in order to measure the performance of
commercial banks becomes essential.
In Vietnam as well as in the whole world, many researches about building DEA
model have been published. In this research, the author offered a new approach. It
was to use the GA search engine, at the same time consider the correlation between
variables. The result showed that, the model consisting of three input variables
and two output variables is suitable for evaluating the performance of Vietnam’s
commercial banks. Three input variables are the total of deposits, number of
employees and leverage ratio while two output variables include the total revenue
and net profit. The research result is consistent to the usage of DEA model in
Volume 1: 149-292 | No.2, December 2017 | banking technology review
269
DEA MODEL FOR MEASURING OPERATIONAL EFFICIENCY OF VIETNAM’S COMMERCIAL BANKS ...
previous researches. It can be said that, variables which are selected in the model
are relevant and have high correlation. Researches in the future can utilize the result
as well as method of this research in order to build up a suitable DEA model for
other sectors.
References
Aparicio, J., Espin, J., Moreno, R. M. & Panser, J. (2014). Benchmarking In
Data Envelopment Analysis: An Approach Based on Genetic Algorithms AND
Parallel Programming. Advances in Operations Research, pp. 1-9. .
org/10.1155/2014/431749.
Banker R. D., Charnes, A. & Cooper, W. W. (1984). Some Models for Estimating
Technical and Scale Inefficiencies in Data Envelopment Analysis. Management Science,
vol. 30, no. 9, pp. 1078-1092.
Cadima, J. & Jollife, I. (2001). Variable Selection and the Interpretation of Principal
Subspaces. Journal of Agricultural, Biological, Environment Statistics, vol. 6, no. 1, pp.
62-79.
Cadima, J., Cerdeira J. O. & Minhoto, M. (2004). Computational Aspects of Algorithms
for Variable Selection in the Context of Principal Components. Computational Statistics
and Data Analysis, vol. 47, pp. 225-236. />Cadima, J., Cerderira, J. O., Silva, P. D. & Minhoto, M. (2012). The Subselect R Package.
08/9/2016.
Charnes, A., Cooper, W. W. & Rhodes, E. (1978). Measuring the Efficiency of Decision
Making Units. European Journal of Operational Research, vol. 2, no. 6, pp. 429-444.
DOI:10.1016/0377-2217(78)90138-8.
Cooper, W. W., Seiford, L. M. & Tone, K. (2007). Choosing Weights from Alternative
Optimal Solutions of Dual Multiplier Models in Dea. European Journal of Operational
Research, vol. 180, no. 1, pp. 443-458.
Edirisinghe, N. C. P. & Zhang, X. (2007). Generalized Dea Model of Fundamental
Analysis and Its Application to Portfolio Optimization. Journal of Banking and Finance,
vol. 31, pp. 311-335. DOI: 10.1016/j.jbankfin.2007.04.008.
270 banking technology review | No.2, December 2017 | Volume 1: 149-292
Nguyen Quang Khai
Färe, R. & Grosskopf, S. (1994). New Directions: Efficiency and Productivity. Kluwer
Academic Publishers. London.
Farrell, M. J. (1957). The Measurement of Productive Efficiency. Journal of the Royal
Statistical Society, vol. 120, no. 3, pp. 253-281.
Jenkins, J. & Anderson, M. (2003). Multivariate Statistical Approach to Reducing the
Number of Variables in Data Envelopment Analysis. European Journal of Operational
Research, vol. 147, no. 1, pp. 51-61.
Lauterbach, B. & Vaninsky, A. (1999). Ownership Structure and Firm Performance:
Evidence from Israel, Journal of Management and Governance, vol. 3, no. 2, pp. 189-201.
Lovell, C. A. K., Färe, R. & Grosskopf, S. (1993). Derivation of Shadow Prices for
Undesirable Outputs: A Distance Function Approach. The Review of Economics and
Statistics, vol. 75, no. 2, pp. 374-380.
Madhanagopal, R. & Chandrasekaran, R. (2014). Selecting Appropriate Variables
for Dea Using Genetic Algorithm (Ga) Search Procedure, International Journal of Data
Envelopment Analysis and Operations Research, vol. 1, no. 2, pp. 28-33.
Mccabe, G. P. (1984). Principal Variables. Technometrics, vol. 26, no. 2, pp. 137-144.
DOI: 10.12691/ijdeaor-1-2-3.
Morita, H. & Avkiran, N. K. (2009). Selecting Inputs and Outputs in Data Envelopment
Analysis by Designing Statistical Experiments. Journal of Operation Research Society of
Japan, vol. 52, no. 2, pp. 163-173.
Morita, H. & Haba, Y. (2005). Variable Selection in Data Envelopment Analysis Based
on External Information. Proceedings of the Eighth Czech-Japan Seminar on Data Analysis
and Decision Making under Uncertainty, pp. 181-187.
Nguyen Quang Khai (2016). Xay dung mo hinh DEA – Danh gia hieu qua hoat dong
cua cac ngan hang thuong mai Viet Nam. Tap chi Tai chinh, so 2, trang 51-53. (Building
DEA Model for Measuring the Operational Efficiency of Vietnam’s Commercial Banks.
Journal of Finance, no. 2, pp. 51-53).
Panahi, M. S., Fard, M. T. T. & Yarbod, M. (2014). Portfolio Selection using Dea and
Genetic Algorithm. International Journal of Modern Management and Foresight, vol. 1, no.
10, pp. 275-286.
Volume 1: 149-292 | No.2, December 2017 | banking technology review
271
DEA MODEL FOR MEASURING OPERATIONAL EFFICIENCY OF VIETNAM’S COMMERCIAL BANKS ...
Razavyan, S. & Tohidi, G. (2011). A Full Ranking Method using Integrated Dea
Models and Its Application to Modify Ga for Finding Pareto Optimal Solution of Mop
Problem. Journal of Industrial Engineering International, vol. 7, no. 15, pp. 8-14.
Ruggiero, J. (2005). Impact Assessment of Input Omission on Dea. International
Journal of Information Technology and Decision Making, vol. 4, no. 3, pp. 359-368. https://
doi.org/10.1142/s021962200500160x.
Sathye, M. (2001). X-Effciency in Australian Banking: An Empirical Investigation.
Journal of Banking & Finance, vol. 25, no. 3, pp. 613-630.
Sealey, C. W. & Lindley, J. T. (1977). Inputs, Outputs and A Theory of Production and
Cost at Depository Financial Institution. Journal of Finance, vol. 32, no. 4, pp. 1251-1266.
Soteriou, A. & Zenios, S. A. (1999). Operations, Quality, and Profitability in the
Provision of Banking Services. Management Science, vol. 45, no. 9, pp. 1221-1238. https://
doi.org/10.1287/mnsc.45.9.1221.
Trevino, V. & Falciani, F. (2006). Galgo: An R Package for Multivariate Variable
Selection using Genetic Algorithms. Bioinformatics, vol. 2, no. 9, pp. 1154-1156. DOI:
10.1093/bioinformatics/btl074.
Whittaker, G., Confesor, A., Griffith, M., Fare, R., Grosskopf, F., Steiner, J., Mueller, W.
& Banowetz, M. (2009). A Hybrid Genetic Algorithm for Multiobjective Problems with
Activity Analysis-Based Local Search. European Journal of Operational Research, vol. 193,
pp. 195-203. DOI: 10.1016/j.ejor.2007.10.050.
Yildirim, C. (1999). Evaluation of the performance of Turkish commercial banks:
a non-parametric approach in conjunction with financial ratio analysis. International
conference in economics III.
272 banking technology review | No.2, December 2017 | Volume 1: 149-292