Bank risk, capitalisation and technical efficiency in the Vietnamese banking system
Bạn đang xem bản rút gọn của tài liệu. Xem và tải ngay bản đầy đủ của tài liệu tại đây (299.21 KB, 23 trang )
Australasian Accounting, Business and Finance
Journal
Volume 12 | Issue 3
Article 4
Bank Risk, Capitalisation and Technical Efficiency
in the Vietnamese Banking System
Tu DQ Le
Center for Economic and Financial Research, University of Economics and Law, VNU – HCM, Vietnam,
Follow this and additional works at: />Copyright ©2018 Australasian Accounting Business and Finance Journal and Authors.
Recommended Citation
Le, Tu DQ, Bank Risk, Capitalisation and Technical Efficiency in the Vietnamese Banking System,
Australasian Accounting, Business and Finance Journal, 12(3), 2018, 41-61. doi:10.14453/aabfj.v12i3.4
Research Online is the open access institutional repository for the University of Wollongong. For further information contact the UOW Library:
Bank Risk, Capitalisation and Technical Efficiency in the Vietnamese
Banking System
Abstract
This study investigates the interrelationships among bank efficiency, capital, and risk in Vietnamese banking
between 2007 and 2011 by using the three-stage least squares in a simultaneous equations framework. The
efficiency scores of individual banks are obtained from the Data Envelopment Analysis with the use of
financial ratios. The average efficiency level of Vietnamese banks is relatively low, suggesting that there is a
room for Vietnamese banks to further improve their efficiency so as to achieve world best practice. The
findings also show a negative relationship between bank risk and capital, suggesting that credit risk and
financial leverage are reinforcing each other. Furthermore, our findings also indicate that an improvement in
bank efficiency precedes an increase in risk. In addition, the results suggest that more efficient and lower risk
banks are associated with higher capital levels. Finally, the findings show that more-diversified banks tend to
be higher risk-taking and have greater performance. Therefore, our findings have important implications for
bank prudential supervision and underline the importance of increasing the minimum charter capital
requirement in the future to support financial stability objectives.
Keywords
Bank efficiency, capital ratios, bank risk, DEA-financial ratios, diversification, 3SLS
This article is available in Australasian Accounting, Business and Finance Journal: />
Bank Risk, Capitalisation
and Technical Efficiency in the
Vietnamese Banking System
Tu DQ Le1
This study investigates the interrelationships among bank efficiency, capital, and risk in
Vietnamese banking between 2007 and 2011 by using the three-stage least squares in a
simultaneous equations framework. The efficiency scores of individual banks are obtained
from the Data Envelopment Analysis with the use of financial ratios. The average efficiency
level of Vietnamese banks is relatively low, suggesting that there is a room for Vietnamese
banks to further improve their efficiency so as to achieve world best practice. The findings
also show a negative relationship between bank risk and capital, suggesting that credit risk
and financial leverage are reinforcing each other. Furthermore, our findings also indicate that
an improvement in bank efficiency precedes an increase in risk. In addition, the results
suggest that more efficient and lower risk banks are associated with higher capital levels.
Finally, the findings show that more-diversified banks tend to be higher risk-taking and have
greater performance. Therefore, our findings have important implications for bank prudential
supervision and underline the importance of increasing the minimum charter capital
requirement in the future to support financial stability objectives.
JEL classification: C23, D24, E44, G21
Keywords: Bank efficiency, capital ratios, bank risk, DEA-financial ratios, diversification,
3SLS
1
Center for Economic and Financial Research, University of Economics and Law, VNU – HCM, Vietnam.
Email address:
1. INTRODUCTION
Vietnam is a rising economic star and considered as a future dragon in the Asia-Pacific
region with the average Gross Domestic Product (GDP) growth rate of 6.2% over the period
2006-2012 (WB 2016). Due to the relatively underdeveloped capital market2, the Vietnamese
banking system plays an essential role in the economy since it contributes 16% to 18%
toward annual GDP (Stewart, Matousek & Nguyen 2016). Yet, it has long remained
undercapitalised and higher level of non-performing loans (NPL).3
Along with other reforms, the State Bank of Vietnam (SBV) officially released the minimum
charter capital requirements for commercial banks with the main objective of reducing risk
and improving bank efficiency. Accordingly, all commercial banks must achieve at least
VND 3,000 billion by the end of 2010 (The Vietnamese Government 2011). This requirement
affects bank behaviour in different ways. For small banks, they seem to face greater difficulty
in terms of raising their capital to meet the minimum charter capital requirement in the short
time due to unfavourable conditions of the Vietnamese stock market. This, therefore, may
induce them to seek high profits via over-branching or excessive risk-taking. For large banks,
it is not hard for them to meet the minimum charter capital requirement because their higher
capital was injected by the government. Under a moral hazard hypothesis, this free injection,
however, may also affect adversely their management behaviour such as having less
incentive to monitor costs or over-financing to state-owned enterprises that are poor
management and have higher risk projects. In fact, the NPL ratio of the Vietnamese banking
system significantly increased in the period 2007-2011 and reached the peak in 2008
(Vietcombank Securities Company 2011). This further raises a concern on whether this
capital requirement should be really adequate for Vietnamese banks to reduce risk and
improve efficiency.
Furthermore, the literature shows that capital and risk are related to the level of bank
efficiency. Hughes and Mester (1998) demonstrate that more efficiency banks with the high
quality of management may have greater flexibility of their financial leverage or overall risk
profile, ceteris paribus. However, a less efficient bank with low capital tends to take higher
risk under moral hazard considerations. As such, Vietnam offers a particularly interesting
environment in which to investigate this critical issue.
It is surprising that only a few studies examining the links among risk, capitalisation and bank
efficiency. The literature is dominated by studies from the US and Europe where larger
markets and number of banks have facilitated economic modelling. The earlier studies
suggest that efficiency and capital are relevant determinants of bank risk. Berger and
DeYoung (1997) suggest that problem loans reduce cost efficiency and a reduction in cost
efficiency precedes increases in problem loans, especially at highly leveraged banks in the
US. Similarly, another study by Kwan and Eisenbeis (1997) using the US data conclude that
poor-performing banks are prone to risk-taking than better-performing ones. Their findings
also indicate that well-capitalized banks operate more efficiently than less-capitalized peers.
These two studies demonstrate the potential existence of intertemporal relationships among
risk, capital, and efficiency in banks.
2
The stock market has been only serving a limited number of companies which are favoured by the government.
3
According to the report of World Bank (2014), the level capitalisation of Vietnamese banking system is the
lowest among ASEAN countries. In addition, the actual figure of NPL should be at least two digits, which was
much higher than what was reported by the State Bank of Vietnam.
42
Several studies adopted the framework of Berger and DeYoung (1997) and Kwan and
Eisenbeis (1997) for a European banking system. Williams (2004) shows that inefficient
banks are associated with an increase in problem loans in a sample of European saving banks.
This is in line with those of Berger and DeYoung (1997). Using the similar methodology in a
panel data framework, Fiordelisi, Marques-Ibanez, and Molyneux (2011) indicate that lower
bank efficiency leads to higher risk and increases in bank capital precede cost efficiency
improvements. This finding is in line with those by Kwan and Eisenbeis (1997), suggesting
that more efficient banks appear to be better capitalised and capital levels are also positively
associated with efficiency levels. In contrast, Altunbas et al. (2007) demonstrate that
inefficient banks appear to have more capital and take on less risky activities.
Regarding empirical studies in developing countries, especially in Asia-Pacific, mixed
findings are also found. Tan and Floros (2013) indicate a negative relationship between bank
risk and capitalisation and a positive relationship between risk and bank efficiency in China.
Nguyen and Nghiem (2015) using the Indian data, however, show that a reduction in cost
efficiency is followed by an increase in bank risk and a decrease in the capital ratio is
followed by an increase in risk. In the context of the Vietnamese banking system, Nguyen,
Nghiem and Roca (2016) suggest that earning asset diversification impacts risk, cost
efficiency and bank capital negatively.
Our paper has several contributions to the literature as follows. First, prior studies show a
lack of consistency in the relationships among bank risk, capitalisation and efficiency. This
study revisits whether the four hypotheses with the mnemonics ‘bad luck’, ‘bad
management’, ‘skimping’, and ‘moral hazard’ exists in the Vietnamese banking system.
Along with different management behaviours of banks, this could be due to differences in the
choice of variables, sample size, analysis periods and estimation methods in the first-stage
analysis4. In order to mitigate this issue of input-output variables employed for frontier
economic approaches, we use Data Envelopment Analysis with the use of standard financial
ratios as outputs to estimate technical efficiency of banks. Second, while a number of studies
are conducted in many countries, regions using different methods, the experience in emerging
markets, especially Vietnam remains limited [Nguyen, Nghiem, and Roca (2016) may be one
of the exceptions]. The experiences of other economies cannot be automatically applied to the
banking system in underdeveloped economies because of the substantial differences in
regulatory and economic environments and the level and quality of services associated with
deposits and loans that exist in institutional reality. By providing the evidence in Vietnam,
this will increase the external validity of the interrelationship between bank risk,
capitalisation and efficiency in the Asia-Pacific region. This study focuses on the Vietnamese
banking between 2007 and 2011 when there were significant changes in banks’ capital ratios.
Therefore, our study provides useful policy and managerial applications.
Our findings indicate that the technical efficiency level of Vietnamese banks is relatively low,
suggesting that there is a room for Vietnamese banks to further improve efficiency so as to
achieve world best practice. In addition, the findings show a positive impact of capital on
bank efficiency, suggesting that banks with more capital operate more efficiently than those
with less capital. Capital also impacts bank risk negatively. Together, the higher capital ratio
could both improve bank performance and reduce bank credit risk. In addition, our results
demonstrate that an improvement in banking efficiency precedes an increase in bank risk,
supporting the skimping behaviour hypothesis. Furthermore, our findings indicate that in
4
The choice of inputs and outputs is comprehensively discussed by several studies such as Berger and
Humphrey (1997).
43
general bank risk impacts capitalisation negatively, thus supporting the moral hazard
hypothesis. In other words, high risk-taking is combined with higher leverage. Lastly, the
findings suggest that more-diversified banks tend to be higher risk-taking and also have
greater performance. The results in subsamples also reinforce the main findings.
The remainder of the paper is organised as follows. Section 2 provides an overview of the
Vietnamese banking system. Section 3 presents the methodology. Section 4 describes data
used in this study. Section 5 discusses empirical findings while section 6 concludes.
2. OVERVIEW OF THE VIETNAMESE BANKING SYSTEM
During the past two decades, the banking system has transformed from one-tier to a two-tier
system where the SBV acts as a true central bank, and commercial banking functions are
transferred to state-owned commercial banks (SOCBs) and privately owned commercial
banks (POCBs). Several reforms were also implemented with the objective of transforming
banks into market-functioning and efficient institutions. The main focus of reforms has so far
on the restructuring of SOCBs, which has long served as the lending arm of state-owned
enterprises (SOEs). The rest of the banking system, approximately 50% of total bank assets
(KPMG 2013) has a much-diversified structure. First, two policy banks have proven to be
effective tools of the state in mobilising various resources, both domestically and
internationally, to perform designated socio-political lending programs. Second, POCBs are
generally the most market-oriented and primarily focus on serving consumers in particular
regions. Their equity ownership is mainly distributed among private, foreign investors and
state. Third, since Vietnam’s entry into the World Trade Organization (WTO) in 2007, a
number of foreign banks that have been operating in the market have led to fierce
competition for deposits and loans. Two forms of foreign participation are greenfield
investment and acquisitions of a minority share. In response, domestic banks should increase
their competitiveness by utilising inputs and producing outputs efficiently or may have
diversified away from their traditional business activities into new fee-based sources of
revenue (Le 2017). Last, non-banking financial institutions (other credit institutions and
investment banks and financial auxiliaries) also contribute to the amount of credit available in
the financial system.
Recently, the SBV announced capitalisation and prudential ratios according to the Basel
framework. Commercial banks are now required to meet the minimum charter capital
requirement. This may have considerable implications for bank management in terms of
enhancing bank efficiency and stability to survive in an increasingly competitive market. As
being a critical role in the Vietnamese economy, the efficiency and behaviours of commercial
banks are of interest to various stakeholders including policy-makers, industry participants,
and academics.
3. METHODOLOGY
3.1 Efficiency Estimation
The literature suggests no consensus on the preferred method for determining the best
practice frontier against which relative efficiency are measured. Two common approaches
used to estimate bank efficiency include data envelopment analysis (DEA) and stochastic
44
frontier approach (SFA)5. DEA is selected in this study because it works well with small
sample size (Evanoff & Israilevich 1991) and is less prone than SFA to specification error,
thus is more flexible (Reinhard, Lovell & Thijssen 2000).
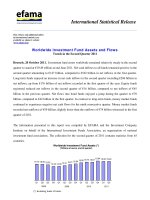
Let us now consider the problem diagrammatically. Assume that we have eight banks (T1,
T2… T8). In order to simplify the problem, we consider two efficiency ratios: R1 and R2 as
shown in Figure 1.
Figure 1 Diagrammatic presentation of the model
Source: Adapted from Halkos and Salamouris (2004)
The efficient frontier is created by four efficient banks: T1, T2, T3, and T4. Bank T5 is
considered as inefficient as it does not lie on the frontier. Point Tμ determines the optimal
level of efficiency and is considered as the reference point, which is used for the
measurement of the relative efficiency of bank T5. The portion by which Tμ exceeds T5 shows
the size of inefficiency. The degree of efficiency for bank T5 is found the ratio of the
distances OT5/OTμ. This follows the model specification proposed by Halkos and Salamouris
(2004). They suggest that inputs can be considered similar and equal for all banks as they
operate in the same markets for money and services.
The banks produce a vector of output
in the form of the financial ratios6. The matrix of
outputs
(
1,2,3, … . , ) is known for each bank or a Decision Making Unit (DMU)
(
1,2,3, … . , ). The
variables to be estimated are a set of weights
placed on each of the banks in creating the efficiency frontier for the
, , ,….,
firm ( ) and an efficiency measure . It is important to note that if a bank wishes to increase
its score it would be best to focus on those outputs, with the highest weight as the efficiency
score is most sensitive to those outputs.
Then the linear program for each bank can be formulated under the output-oriented model as
follows:
Subject to
5
Berger and Humphrey (1997) provide a comprehensive discussion on economic frontier techniques.
6
In our study, the values of ratios are non-negative. Thus the model is justified.
45
∑
1,2,3, … . ,
1
(1)
0
0
1,2,3, … . ,
The efficiency score for each DMU is given by
∗
considered as technically efficient if
∗
∗
and0
1. DMUs are
7
1 and all slacks zero .
3.2 A simultaneous equations model
A two-stage framework is used in our study. In the first stage, the technical efficiency scores
of banks are obtained using the DEA with the use of financial ratios as described above. In
the second stage, a simultaneous equations model is used to examine the interrelationships
between risk, capital, and efficiency. Several approaches are often used in the literature such
as 2SLS (Kwan & Eisenbeis 1997), SUR (Altunbas et al. 2007) and Granger causality test
(Berger & DeYoung 1997; Fiordelisi, Marques-Ibanez & Molyneux 2011; Williams 2004).
Nguyen and Nghiem (2015) argue that results obtained from Granger causality are sensitive
to model specification and the number of lags. In addition, Belsley (1988) suggested that
3SLS can be more efficient than 2SLS, a relative advantage that increases with the strength of
the interrelations among the error terms. Therefore, the 3SLS estimator which combines
2SLS and SUR is adopted.
Following Altunbas et al. (2007), the ratio of loan loss reserves total assets (RISK) is used to
measure bank risk derived from accounting information since data on non-performing loans
are unavailable for most banks. Higher levels of reserves are suggestive of greater banking
risk8. Bank capitalisation (CAP) is measured by the ratio of total equity to total assets while
technical efficiency (TEFF) is obtained from the DEA with the use of financial ratios.
Therefore, RISK, CAP, and TEFF represent the three endogenous variables in the
simultaneous equation system, with two right-hand-side endogenous variables in each of the
three equations. The model is completed by adding exogenous variables that have
explanatory power for each of the above endogenous variables. The model is specified as
follows:
,
,
,
,
,
,
,
,
,
,
,
,
,
,
,
(2)
,
,
(3)
,
,
(4)
7
Note that if an efficiency score of 1 but a slack value is positive then the model has identified a point on the
efficient frontier but still has excess on an output, which corresponds to the positive slack. This suggests that
this DMU is not Pareto-efficient because its outputs cannot be expanded jointly; see Halkos and Salamouris
(2004).
8
Borio (2003) suggested that banks build more provision in good times and run them down in the case of
unfavourable economic conditions and an increase in loans defaults. As such banks with higher levels of
reserves could be considered as a lower risk. However, Altunbas et al. (2007) argued that banks with higher
levels of reserves have an expectation of higher future risk, thus, are riskier.
46
Berger and DeYoung (1997) indicated four types of managerial hypothesis underlying the
interrelationships among bank risk, capital and operating efficiency that include: bad
management, bad luck, moral hazard and skimping.
As per the bad management hypothesis, banks with poor management may fail to control
operating costs or monitor borrowers, thus resulting in higher risk. Also, less efficient banks
tend to be more prone to risk-taking due to a lower value of their charter capitals. According
to the skimping costs hypothesis, banks tend to skimp on operating costs by reducing credit
monitoring, collateral valuing and marketing activities to achieve short-run economic
efficiency. These activities, however, would deteriorate loan quality which ultimately leads to
higher risk. In addition, inefficient banks are subject to more regulatory scrutiny. Thus they
are required to hold higher capital ratios (Kwan & Eisenbeis 1997).
The bad luck hypothesis argues that banks are required to expend additional managerial
efforts, additional resources/inputs to address credit risk caused by external events such as
financial shocks. As a result, this reduces banks’ efficiency. On the other hand, the costs of
managing credit risk may be reduced with the level of risk exposure due to credit screening.
The conventional view suggests that managerial quality banks with more capital and less
leverage are likely to be more efficient than those with less capital (Kwan & Eisenbeis 1997).
CAP, therefore, is positively associated with TEFF. Furthermore, the moral hazard
hypothesis postulates poorly capitalised banks that face risks due to a reduced capital ratio
have incentives to take risky portfolios. Consequently, a negative impact of the CAP on RISK
is expected.
Following prior studies such as Fu, Lin, and Molyneux (2015) and Nguyen and Nghiem
(2015), we use bank profitability (ROAA) and bank intermediation (LD) as control variables
for CAP (equation 2). ROAA, the ratio of profit before tax to average total assets, is included
to control for bank’s profitability. The charter value hypothesis suggests that a profitable
bank may improve capital ratios, all else being equal, to protect its charter value (Keeley
1990). As per the pecking order theory of finance, increasing extra capital may be costly. It
thus may be easier to accumulate capital via higher retained earnings. LD, the ratio of gross
loans to total deposits, is included to control for the effects of bank intermediation.
Accordingly, banks with the higher level of intermediation of deposit to loans could obtain
greater earning – thus, resulting in higher level of capital.
We also use lending specialization (LA), bank size (SIZE) and bank diversification (DIV), as
control variables for TEFF (equation 3). LA, the ratio of gross loans to total assets, is
included to control for lending specialization. Accordingly, a greater loan-to-asset ratio may
suggest higher market power in loan markets. The efficient structure hypothesis demonstrates
that market power in loan markets may be a consequence of efficient operations. Because of
the ability to control their operations more productively, relatively efficient banks may have
lower production costs, which allow them to offer more reasonable loan terms and thus
gaining larger market shares over their inefficient competitors. LA thus is expected to have a
positive effect on TEFF (Isik & Hassan 2003; Nguyen & Nghiem 2015). SIZE, the natural
logarithm of total assets, is included to control for bank size. Due to economies of scale,
SIZE is expected to have a positive impact on TEFF (Andries 2011; Drake 2001). DIV, the
ratio of off-balance sheet items to total assets, is included to control for bank diversification
towards off-balance sheet activities. According to the conglomeration hypothesis, diversified
banks can leverage managerial skills and abilities across products and services (IskandarDatta & McLaughlin 2005) and gain economies of scope through spreading fixed costs over
47
multiple products (Drucker & Puri 2009). Diversification thus has a positive impact on bank
efficiency. The increased income generated from diversification, however, would be offset by
the costs for non-lending products (Nguyen & Nghiem 2015). Diversification, therefore,
impacts bank efficiency negatively.
Furthermore, we use excessive lending (LA), bank diversification (DIV), economic growth
(GDP) and inflation (INF) as control variables for RISK (equation 4). LA, the ratio of gross
loans to total assets, is used to control for excessive lending. Banks may intend to seize new
lending opportunities, expand to new geographic markets or increase market share with
existing products and markets (Rossi, Schwaiger & Winkler 2009). Under this presumption
that new loans are advanced to borrowers who were previously rejected, perhaps too little
collateral relative to their credit quality, excessive lending may increase bank risk. DIV, the
ratio of off-balance sheet activities to total assets, is used to control for the effects of bank
diversification. Conventional wisdom in banking suggests that diversification could reduce
bank risk. In contrast, Berger, Hasan and Zhou (2010) emphasise that aggressive
diversification strategies may lead to increased risk-taking. Similarly, Acharya, Hasan and
Saunders (2006) demonstrate that diseconomies of scope arise through weakened monitoring
incentives and a poorer quality loan portfolio when a risky bank expands into additional
industries and sectors. This is also due to the issue of agency costs (Deng & Elyasiani 2008).
For that reason, diversification impacts on bank risk positively. GDP, the economic growth
rate, is used to control for the economic condition that influence banks’ investment
opportunity and therefore bank risk-taking behavior. INF, the inflation rate, is used to control
for the effects of inflation.
4. DATA
In our analysis, only Vietnamese commercial banks between 2007 and 2011are considered.
Foreign banks and joint-venture banks are excluded from our analysis as they were much
more restricted in bank entry and banking activities. Due to the data sample must be
homogeneous when using DEA for assessing efficiency, this exclusion ensures maximum
feasible comparability among banks. After accounting for missing data, we obtain an
unbalanced panel data in which these banks accounted for more than 80% of total assets in
the banking industry. The data were collected from the balance sheets and profit and loss
accounts of the banks under consideration.
A variety of financial ratios are used for this evaluation with each ratio to provide indications
for technical efficiency of a bank. Following Halkos and Salamouris (2004), we initially
considered five common financial ratios as outputs that include: return difference of interestbearing assets (RDIBA)9; the ratio of profits before tax to average total equity (ROAE);
efficiency ratio10 (EFF); net interest margin11 (NIM); the ratio of profits before tax to average
total assets (ROAA). For reasons of convenience with the other indices as described in Figure
1, EFF is used in our analysis as 1/EFF. ROAE, NIM, and ROAA are three main measures of
9
This is measured by the difference between the interest receivable and similar income-to-the average interestbearing assets ratio and the interest payable and similar charges-to-the average interest-bearing liabilities ratio.
The larger RDIBA is, the more efficient the management of the bank’s capital is.
10
This is measured by the ratio of the operational expenses to total net income. The smaller EFF is the more
efficient the bank is because the percentage of the bank’s income generated is sufficient to cover its operating
expenses.
11
The ratio of the net income to average total assets
48
bank profitability in the literature. Following the suggestion of Halkos and Salamouris
(2004), ROAA should be excluded from our analysis because ROAA is highly correlated
with EFF and NIM with using a correlation of about 0.7 as a cut off as presented in Table
1.12Therefore, four financial ratios used as outputs in DEA include RDIBA, ROAE, EFF, and
NIM. Given our unbalanced panel data, a set of 1x4 inputs and outputs is used in our study
which is consistent with DEA literature. Dyson et al. (2001) suggest that sample size should
be at least three times larger than the sum of inputs and outputs to discriminate between the
units.
Table 1 Correlation matrix between financial ratios used in DEA
RDIBA
ROAE
RDIBA
1
ROAE
0.134
1
EFFa
0.198
0.287
NIM
0.399
0.194
ROAA
0.287
0.297
a
Note: the data of EFF was transformed.
EFFa
NIM
ROAA
1
0.380
0.784
1
0.704
1
Descriptive statistics of variables used in this study are presented in Table 2.
Table 2 Descriptive statistics of variables used in this study
Variables
2011
2010
Number of banks
33
37
Financial ratios used for efficiency estimation
RDIBA
4.573b
3.622
(2.610)c
(2.336)
ROAE
15.745
16.772
(8.662)
(8.003)
a
EFF
0.022
0.025
(0.005)
(0.007)
NIM
3.539
2.813
(1.410)
(0.936)
12
This rule may vary depending on the study of the discipline.
49
2009
2008
2007
33
27
37
3.404
(1.789)
16.749
(8.148)
0.025
(0.007)
3.204
(1.342)
2.895
(1.491)
13.846
(9.871)
0.022
(0.009)
2.940
(1.615)
3.085
(1.138)
22.695
(12.421)
0.031
(0.011)
3.169
(1.613)
Variables used for assessing the interrelationships between bank risk, capital, and
efficiency
RISK
0.715
0.657
0.621
0.617
0.488
(0.578)
(0.525) (0.539)
(0.632)
(0.630)
CAP
11.490
11.954
13.764
15.038
12.878
(6.837)
(6.927) (11.920)
(9.770)
(8.613)
LA
46.242
47.853
55.177
54.196
52.246
(15.479)
(13.811) (17.291) (13.981)
(13.683)
LD
102.878
95.772 108.667 100.553
125.261
(38.697)
(22.523) (52.854) (30.751)
(71.969)
DIV
7.963
7.218
6.915
7.530
10.651
(10.847)
(10.022) (8.895) (10.546)
(15.403)
SIZE
17.962
17.683
17.176
16.880
16.888
(1.108)
(1.132) (1.305)
(1.364)
(1.359)
ROAA
1.679
1.776
2.070
1.637
2.587
(0.965)
(0.971) (1.111)
(1.381)
(1.519)
GDP
6.240
6.423
5.398
5.662
7.130
(0.000)
(0.000) (0.000)
(0.000)
(0.000)
INF
21.261
12.074
6.216
22.673
9.630
(0.000)
(0.000) (0.000)
(0.000)
(0.000)
a
b,c
Notes: the data of EFF was transformed;
mean and standard deviation value of the
variable, respectively
5. RESULTS
5.1 Technical efficiency of the Vietnamese banking system, 2007 - 2011
As mentioned above, the financial ratios are treated as output variables, while a dummy-input
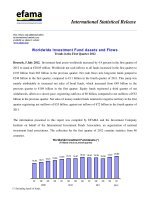
(equals to 1) is set for all banks in the sample. Figure 2 shows the technical efficiency level of
the Vietnamese banking system between 2007 and 201113.
13
The results of technical efficiency score of each bank over the examined period cannot be presented due to
length restrictions but are available upon request.
50
Figure 2: Technical efficiency of Vietnamese banks, 2007-2011
0.9
0.8
0.761
0.758
0.772
0.7
0.661
0.6
0.5
2007
0.625
2008
2009
2010
2011
The average technical efficiency score of banks over the five-year period is 0.72. This value
fits within the range of the scores found in other overseas studies but is lower than the world
mean efficiency. As indicated by Berger and Humphrey (1997), the mean efficiency score is
in the range of 0.55 (UK) to 0.95 (France). This suggests that there is a room for Vietnamese
banks to further improve efficiency so as to achieve world best practice (i.e., banks can
increase outputs produced by 28%).
Furthermore, this appears as a significant reduction in bank efficiency in 2008. However,
there is a slight improvement in technical efficiency in 2009 and remains levelled off between
2010 and 2011,14 suggesting that the Vietnamese banking system is less affected by the GFC.
This recovery could be explained by the fact that banks gained benefits from the
government’s stimulus packages. A large amount of money was injected into the economy by
the government through commercial banks channel. This enables banks to increase lending
from this cheap fund, thus may improve bank efficiency.
5.2 Management behaviours
Table 3 presents the correlation matrix of the various variables that are used in this study. For
the convenience, we focus on the interpretation of the correlation between CAP, TEFF, and
RISK. At first glance, there is a positive relationship between TEFF and CAP and a negative
relationship between RISK and CAP. The correlations of other control variables in three
equations as above are also reported. As can be seen in Table 3, there are no high correlations
between explanatory variables in a single equation. However, the intertemporal relationships
among CAP, TEFF and RISK can be only addressed by using a simultaneous equations
model as presented in the following section.
The simultaneous equations system is fitted by pooled time-series cross-section observations
using the 3SLS estimation.
14
Since our data is unbalanced, and particularly because the purpose of this study is to investigate the
interrelationship between bank efficiency, capitalisation, and risk, we have not focused on the productivity
change over time for the Vietnamese banking system. Nonetheless, this is well beyond the scope of our study,
thus leaving this for future research.
51
Table 3 Correlation matrix of key variables
CAP
TEFF
RISK
ROAA
LD
LA
SIZE
DIV
GDP
INF
CAP
1.000
0.187**
(2.440)
-0.258***
(-3.431)
0.603***
(9.710)
0.529***
(8.018)
0.122
(1.573)
-0.733
(-13.833)
-0.262
(-3.480)
-0.082
(-1.053)
0.009
(0.117)
TEFF
RISK
ROAA
LD
LA
SIZE
DIV
GDP
INF
1.000
0.103
(1.326)
0.629
(10.399)
0.086
(1.112)
-0.044
(-0.567)
0.104
(1.338)
0.138*
(1.789)
-0.035
(-0.443)
-0.111
(-1.431)
1.000
-0.180
(-2.345)
0.006
(0.081)
0.494***
(7.291)
0.522
(7.868)
0.402***
(5.646)
-0.049
(-0.636)
0.055
(0.707)
1.000
0.429
(6.106)
0.103
(1.334)
-0.437
(-6.243)
-0.028
(-0.360)
0.133
(1.724)
-0.189
(-2.476)
1.000
0.447
(6.427)
-0.431
(-6.136)
-0.255
(-3.381)
0.091
(1.180)
-0.093
(-1.197)
1.000
-0.02
(-0.255)
0.024
(0.310)
-0.121
(-1.565)
-0.082
(-1.057)
1.000
0.436
(6.218)
0.042
(0.537)
0.066
(0.845)
1.000
0.092
(1.189)
-0.007
(-0.090)
1.000
-0.055 1.000
(0.709)
Notes: CAP, the ratio of total equity to total assets; TEFF, technical efficiency scores of banks; RISK, the ratio of loan loss reserves to total
assets; ROAA, the ratio of profit before tax to the average total asset; LD, the ratio of gross loans to total deposits, LA, the ratio of gross loans to
total assets, SIZE, the natural logarithm of total assets; DIV, the ratio of off-balance sheet items to total assets; GDP, the economic growth rate;
INF, the inflation rate. t-statistics are shown in parentheses, **, *** Significant at 5, 1 percent levels, respectively.
52
Table 4 Determinants of bank capitalisation
CAP
-35.644***(-4.718)
-3.585**(-2.337)
7.310***(7.244)
0.022*(1.602)
24.561***(5.808)
0.275
167
TEFF
RISK
ROAA
LD
Constant
Adjusted R2
Number of observations
Notes: CAP, the ratio of total equity to total assets; TEFF, technical efficiency scores of banks as
obtained from DEA; RISK, the ratio of loan loss reserves to total assets, ROAA, the ratio of
profit before tax to the average total assets; LD, the ratio of gross loans to total deposits. The
table contains the results estimated using a simultaneous equations model with the 3SLS
estimator. CAP, TEFF, and RISK represent the three endogenous variables in the simultaneous
equations system. t-statistics are shown in parentheses, *, **, *** Significant at 10, 5, 1 per cent
levels, respectively.
The results of the determinants of bank capitalisation are indicated in Table 4. The coefficient of
TEFF is significant and negative, suggesting that banks often respond to a decline in operating
efficiency by raising capital as a precautionary step. RISK15 is significantly and negatively
related to CAP – thus, the moral hazard hypothesis may exist. This result is in line with findings
of Fiordelisi, Marques-Ibanez and Molyneux (2011) in European banking. Brewer, Jackson and
Moser (1996) argue that when deposit insurance premiums are not risk-sensitive, managers
invest in high-risk assets at discounted rates while simultaneously extending financial leverage to
improve returns. In other words, moral hazard bank behaviour is indicative of high risk-taking
which is combined with higher leverage. ROAA is positively and significantly associated with
CAP, confirming that profitability leads to higher capital. This finding is in line with those of
Kwan and Eisenbeis (1997) in the US banking system. Lastly, the coefficient of LD is significant
and positive, implying that banks with the higher level of intermediation of deposit to loans
could generate higher earnings, which ultimately leads to greater bank capital.
The results of determinants of bank efficiency are presented in the following table. As can be
seen in Table 5, the coefficient of CAP is positive and significant, suggesting that banks with
more capital operate more efficiently than those with less capital. This supports the view that
moral hazard incentives are reduced as bank capital increases because more-capitalised banks are
more likely to cut costs than less-capitalised counterparts.
15
We also use Z-score as a proxy for bank risk. The coefficient of Z-score is statistically not significant in all
models although the table of results cannot be presented due to the space restrictions. Nonetheless, the results are
available upon request.
AABFJ | Volume 12, no. 3, 2018
Table 5 The determinants of bank efficiency
TEFF
0.031**(2.343)
-2.774***(-3.380)
0.049***(3.171)
0.710***(3.564)
0.029***(3.167)
-13.010***(-3.380)
-33.186
167
CAP
RISK
LA
SIZE
DIV
Constant
Adjusted R2
No. of Obs
Notes: CAP, the ratio of total equity to total assets; TEFF, technical efficiency scores of banks;
RISK, the ratio of loan loss reserves to total assets; LA, the ratio of gross loans to total assets;
SIZE, the natural logarithm of total assets; DIV, the ratio of off-balance sheet items to total
assets. The table contains the results estimated using a simultaneous equations model with the
3SLS estimator. CAP, TEFF, and RISK represent the three endogenous variables in the
simultaneous equations system. t-statistics are shown in parentheses, **, *** Significant at 5, 1
percent levels, respectively.
RISK is negatively and significantly related to TEFF, thus supporting the bad luck hypothesis.
According to this hypothesis, external events (the global financial crisis) precipitate an increase
in risk for the banks (perhaps, loan defaults). Banks have to purchase the additional inputs
necessary to administer these problem credits. This finding somewhat conflicts with those of
Stewart, Matousek and Nguyen (2016) who found no relationship between bank risk and
efficiency in Vietnam. In their paper, an ordinary least square estimation is not a robust method
since it ignores the correlation of error term across equations. In addition, LA is positively and
significantly associated with TEFF, suggesting that banks with higher loans-to-assets ratio tend
to have greater technical efficiency levels. This also emphasizes that bank loans seem to be more
highly valued than alternative bank outputs (investment and securities) in Vietnam. The finding
is in line with those of Kwan and Eisenbeis (1997) in the US and Nguyen and Nghiem (2015) in
India. Furthermore, SIZE is found to have a positive impact on TEFF, suggesting that larger
banks are more efficient than smaller counterparts. This finding is comparable to those of Minh,
Long and Hung (2013) and Stewart, Matousek and Nguyen (2016) in Vietnam. This can be
explained by two main following reasons. Large banks should pay less for their inputs if it
relates to market power. Also, there may be by increasing returns to scale through the allocation
of fixed costs over a higher volume of services or from efficiency gains from a specialised
workforce (Hauner 2005). In addition, DIV is significantly and positively related to TEFF,
suggesting that diversification towards OBS activities is able to improve bank efficiency. This
supports earlier findings of Sufian (2009) in Malaysia, Jeon and Miller (2005) in Korea. This can
be explained by the following reasons. First, diversified banks can leverage managerial skills and
abilities across products and services (Iskandar-Datta & McLaughlin 2005) and gain economies
of scope by spreading fixed costs over multiple products (Drucker & Puri 2009). Second, they
can provide more services to customers who demand multiple products and are willing to pay for
extra convenience, thus increasing their income (Berger, Hasan & Zhou 2010).
54
Le | Bank risk, Capitalisation and Technical Efficiency in the Vietnamese Banking System
The results of determinants of bank risk are shown in Table 6. CAP is found to have a negative
impact on bank risk, suggesting that banks with relatively more capital (less leverage) tend to
have less credit risk. The coefficient of TEFF is significant and positive, suggesting that
supervisory authorities may allow efficient banks (with high-quality management) a greater
flexibility in terms of their capital leverage – thus, more investing in risky assets. This is in line
with the findings of Hughes and Mester (1998) who found that
higher risk is positively associated with more efficient banks.
Table 6 The determinants of bank risk
RISK
-0.037***(-7.483)
0.605**(2.474)
0.021***(9.494)
0.011***(3.754)
0.095**(2.453)
0.002(0.637)
-1.104***(-3.194)
0.347
167
CAP
TEFF
LA
DIV
GDP
INF
Constant
Adjusted R2
No. of Obs
Notes: CAP, the ratio of total equity to total assets; TEFF, technical efficiency score of banks;
RISK, the ratio of loan loss reserves to total assets; LA, the ratio of gross loans to total assets;
DIV, the ratio of off-balance sheet items to total assets; GDP, the economic growth rate; INF, the
inflation rate. The table contains the results estimated using a simultaneous equations model with
the 3SLS estimator. CAP, TEFF, and RISK represent the three endogenous variables in the
simultaneous equations system. t-statistics are shown in parentheses, **, *** Significant at 5, 1
percent levels, respectively.
Furthermore, LA is significantly and positively associated with RISK, suggesting that
excessively lending may increase risk faced by banks. In fact, the accelerating pace of lending
between 2007 and 2011, especially advancing to non-deposit sources, potentially exposed the
Vietnamese banking sector to higher liquidity risk. This result is comparable to those of Amador,
Gómez-González and Pabón (2013), demonstrating that significant credit expansions do not
generate corresponding increases in bank safety margins. The coefficient of DIV is significant
and positive, implying that aggressive diversification strategies may have resulted in increased
risk-taking. This is in line with those of Deng and Elyasiani (2008) and Le (2017), indicating that
diversification benefits are offset by increased bank risk. In addition, GDP is significantly and
positively related to RISK, suggesting that Vietnamese banks tend to pursue a massive lending
and investment opportunities during the expansion of the economy – thus, they may face greater
risk. INF is found to have no impact on bank risk.
5.3 Robustness Check
We further examine whether the interrelationship between risk, capitalisation and technical
efficiency differ between small and large banks as presented in the following tables. Following
55
AABFJ | Volume 12, no. 3, 2018
Berger and Bouwman (2009) and Le (forthcoming), large and small banks are defined as those
with total assets greater and less than the median value, respectively.
Table 7 The relationships between risk, capital and efficiency for large banks
TEFF
RISK
CAP
Constant
Adjusted
R2
No. of
Obs
CAP
-14.840***(2.633)
-0.748(-1.101)
TEFF
RISK
0.285(0.570)
-0.397(-1.535)
0.039(1.532)
12.366***(3.852
)
0.298
-4.114***(-3.564)
-0.123***(4.405)
-0.680(-0.968)
-1.363
0.341
83
83
83
Notes: CAP, the ratio of total equity to total assets; TEFF, technical efficiency scores of banks;
RISK is the ratio of loan loss reserves to total assets. The table contains the results estimated
using a simultaneous equations model with the 3SLS estimator. CAP, TEFF, and RISK represent
the three endogenous variables in the simultaneous equation system. The same set of control
variables is used as above, but the coefficients of these variables are not presented due to space
constraints. Large banks are classified as those with total assets greater than the median value. tstatistics are shown in parentheses, *** Significant at 1 percent levels, respectively.
Table 8 The relationships between risk, capital and efficiency for small banks
TEFF
RISK
CAP
Constant
Adjusted
R2
No. of
Obs
CAP
-17.079(-1.485)
-8.954*(-1.916)
TEFF
RISK
0.963***(5.748)
18.334***(2.970)
0.221
0.744(1.156)
0.029**(2.103)
-0.892(-0.214)
-0.868
-0.024***(-6.658)
-0.513**(-2.151)
-0.005
84
84
84
Notes: CAP, the ratio of total equity to total assets; TEFF, technical efficiency scores of banks;
RISK is the ratio of loan loss reserves to total assets. The table contains the results estimated
using a simultaneous equations model with the 3SLS estimator. CAP, TEFF, and RISK represent
the three endogenous variables in the simultaneous equation system. The same set of control
variables is used as above, but the coefficients of these variables are not presented due to space
constraints. Small banks are classified as those with total assets less than the median value. tstatistics are shown in parentheses, *,**, *** Significant at 10, 5, 1 percent levels, respectively.
56
Le | Bank risk, Capitalisation and Technical Efficiency in the Vietnamese Banking System
Tables 7-8 show that CAP is found to have a positive impact on TEFF. Also, CAP is negatively
associated with RISK regardless of bank sizes. Consequently, firms with more capital operate
more efficiently and have the lower risk. In addition, TEFF is negatively related to CAP and has
a positive impact on RISK. This confirms that Vietnamese banks tend to skimp on operating
costs by reducing credit monitoring and collateral valuing in order to achieve efficiency in the
short run. Vietnamese banks, however, would be exposed to greater credit risk in the long run.
Last, RISK is significantly and negatively related to CAP for the case of small banks, supporting
the moral hazard hypothesis. Nonetheless, these findings confirm our main findings as discussed
above.
6. CONCLUSIONS
This study investigates the links among bank risk, capitalisation and technical efficiency in
Vietnamese banking between 2007 and 2011 using the 3SLS estimation in a simultaneous
equations model. The efficiency level of Vietnamese banking system as derived from DEA with
the use of financial ratios appears to be relatively low, suggesting that there is a room for banks
to further improve efficiency so as to achieve world best practice.
Our main findings indicate that banks with more capital operate more efficiently than those with
less capital, indicating the level of capitalisation is a good proxy for performance. Capital also
appears to have a negative impact on bank risk, implying that a higher capital ratio could not
only improve bank efficiency but also reduce bank credit risk. Therefore, our findings strongly
support the view of SBV that an increase in the minimum charter capital requirement would be
beneficial for Vietnamese banks. In fact, the current minimum requirement on bank capital
adequacy in Vietnam is much lower than what is suggested in BASEL III.
At the same time, technical efficiency is related to bank risk-taking. Our findings indicated that
an improvement in banking efficiency precedes an increase in bank risk, supporting the skimping
behaviour. This suggests that supervisors must pay special attention to the bank’s internal credit
control procedures (i.e. loan monitoring and review, collateral valuing). More importantly, our
findings demonstrate the negative impact of bank risk on capitalisation. This implies that moral
hazard bank behaviour is indicative of high risk-taking is combined with higher leverage. In
addition, our findings also show that more-diversified banks tend to be higher risk-taking and
have better performance. Our main findings still hold in subsamples.
It is worth to mention that each of these results has a relatively small impact on banks on average
but may have a substantial effect on individual banks that are most subject to bad luck, bad
management, skimping and/or moral hazard.
While this study examines only one emerging market and a limited period of study, it suggests
the need for future research in other emerging nations that have similar banking structure for the
robustness of our main findings. Perhaps, alternative techniques (bootstrap DEA as suggested by
Simar and Wilson (1998, 2000) or SFA) could be used to estimate the technical efficiency of
banks.
57
AABFJ | Volume 12, no. 3, 2018
References
Acharya, VV, Hasan, I & Saunders, A 2006, 'Should banks be diversified? Evidence from
individual bank loan portfolios', The Journal of Business, vol. 79, no. 3, pp. 1355-1412.
/>
Altunbas, Y, Carbo, S, Gardener, EPM & Molyneux, P 2007, 'Examining the relationships
between capital, risk and efficiency in European banking', European Financial
Management, vol. 13, no. 1, pp. 49-70. />Amador, JS, Gómez-González, JE & Pabón, AM 2013, 'Loan growth and bank risk: new
evidence', Financial Markets and Portfolio Management, vol. 27, no. 4, pp. 365-379.
/>
Andries, AM 2011, 'The determinants of bank efficiency and productivity growth in the Central
and Eastern European banking systems', Eastern European Economics, vol. 49, no. 6, pp.
38-59. />Belsley, DA 1988, 'Two-or three-stage least squares?', Computer Science in Economics and
Management, vol. 1, no. 1, pp. 21-30. />Berger, AN & DeYoung, R 1997, 'Problem loans and cost efficiency in commercial banks',
Journal of Banking and Finance, vol. 21, no. 6, pp. 849-870.
/>
Berger, AN & Humphrey, DB 1997, 'Efficiency of financial institutions: International survey and
directions for future research', European Journal of Operational Research, vol. 98, no. 2,
pp. 175-212. />Berger, AN & Bouwman, CH 2009, 'Bank liquidity creation', Review of Financial Studies, vol.
22, no. 9, pp. 3779-3837. />Berger, AN, Hasan, I & Zhou, M 2010, 'The effects of focus versus diversification on bank
performance: Evidence from Chinese banks', Journal of Banking & Finance, vol. 34, no.
7, pp. 1417-1435. />Borio, C 2003, 'Towards a macroprudential framework for financial supervision and regulation?',
CESifo Economic Studies, vol. 49, no. 2, pp. 181-215.
/>
Brewer, E, Jackson, WE & Moser, JT 1996, 'Alligators in the swamp: the impact of derivatives
on the financial performance of depository institutions', Journal of Money, Credit and
Banking, vol. 28, no. 3, pp. 482-497. />Deng, SE & Elyasiani, E 2008, 'Geographic diversification, bank holding company value, and
risk', Journal of Money, Credit and Banking, vol. 40, no. 6, pp. 1217-1238.
/>
58
Le | Bank risk, Capitalisation and Technical Efficiency in the Vietnamese Banking System
Drake, L 2001, 'Efficiency and productivity change in UK banking', Applied Financial
Economics, vol. 11, no. 5, pp. 557-571. />Drucker, S & Puri, M 2009, 'On loan sales, loan contracting, and lending relationships', Review
of Financial Studies, vol. 22, no. 7, pp. 2835-2872. />Dyson, RG, Allen, R, Camanho, AS, Podinovski, VV, Sarrico, CS & Shale, EA 2001, 'Pitfalls
and protocols in DEA', European Journal of Operational Research, vol. 132, no. 2, pp.
245-259. />Evanoff, DD & Israilevich, PR 1991, 'Productive efficiency in banking', Economic Perspectives,
vol. 15, no. 4, pp. 11-32.
Fiordelisi, F, Marques-Ibanez, D & Molyneux, P 2011, 'Efficiency and risk in European
banking', Journal of Banking & Finance, vol. 35, no. 5, pp. 1315-1326.
/>
Fu, XM, Lin, YR & Molyneux, P 2015, 'Bank capital and liquidity creation in Asia Pacific',
Economic Inquiry, vol. 54, no. 2, pp. 966-993. />Halkos, GE & Salamouris, DS 2004, 'Efficiency measurement of the Greek commercial banks
with the use of financial ratios: A data envelopment analysis approach', Management
Accounting Research, vol. 15, no. 2, pp. 201-224.
/>
Hauner, D 2005, 'Explaining efficiency differences among large German and Austrian banks',
Applied Economics, vol. 37, no. 9, pp. 969-980.
/>
Hughes, JP & Mester, LJ 1998, 'Bank capitalization and cost: Evidence of scale economies in
risk management and signaling', Review of Economics and Statistics, vol. 80, no. 2, pp.
314-325. />Isik, I & Hassan, MK 2003, 'Efficiency, ownership and market structure, corporate control and
governance in the Turkish banking industry', Journal of Business Finance & Accounting,
vol. 30, no. 9‐10, pp. 1363-1421. />Iskandar-Datta, M & McLaughlin, R 2005, 'Global diversification: Evidence from corporate
operating performance', Corporate Ownership & Control, vol. 4, no. 4, pp. 228-242.
Jeon, Y & Miller, SM 2005, 'Performance of domestic and foreign banks: The case of Korea and
the Asian financial crisis', Global Economic Review, vol. 34, no. 2, pp. 145-165.
/>
Keeley, MC 1990, 'Deposit insurance, risk, and market power in banking', The American
Economic Review, vol. 80, no. 5, pp. 1183-1200.
KPMG 2013, Vietnam banking survey 2013, KPMG, Ho Chi Minh city.
59
AABFJ | Volume 12, no. 3, 2018
Kwan, S & Eisenbeis, RA 1997, 'Bank risk, capitalization, and operating Efficiency', Journal of
Financial Services Research, vol. 12, no. 2, pp. 117-131.
/>
Le, TD , 'The interrelationship between liquidity creation and capital in Vietnamese banking',
Managerial Finance (forthcoming).
---- 2017, 'The interrelationship between net interest margin and non-interest income: evidence
from Vietnam', International Journal of Managerial Finance, vol. 13, no. 5, pp. 521-540.
/>
Minh, NK, Long, GT & Hung, NV 2013, 'Efficiency and super-efficiency of commercial banks
in Vietnam: Performances and determinants', Asia-Pacific Journal of Operational
Research, vol. 30, no. 01, pp. 1-20. />Nguyen, TPT & Nghiem, SH 2015, 'The interrelationships among default risk, capital ratio and
efficiency: Evidence from Indian banks', Managerial Finance, vol. 41, no. 5, pp. 507525. />Nguyen, TPT, Nghiem, SH & Roca, E 2016, 'Management behaviour in Vietnamese commercial
banks', Australian Economic Papers, vol. 55, no. 4, pp. 345-367.
/>
Reinhard, S, Lovell, CK & Thijssen, GJ 2000, 'Environmental efficiency with multiple
environmentally detrimental variables; estimated with SFA and DEA', European Journal
of Operational Research, vol. 121, no. 2, pp. 287-303.
/>
Rossi, SP, Schwaiger, MS & Winkler, G 2009, 'How loan portfolio diversification affects risk,
efficiency and capitalization: A managerial behavior model for Austrian banks', Journal
of Banking & Finance, vol. 33, no. 12, pp. 2218-2226.
/>
Simar, L & Wilson, PW 1998, 'Sensitivity analysis of efficiency scores: How to bootstrap in
nonparametric frontier models', Management Science, vol. 44, no. 1, pp. 49-61.
/>
---- 2000, 'A general methodology for bootstrapping in non-parametric frontier models', Journal
of Applied Statistics, vol. 27, no. 6, pp. 779-802.
/>
Stewart, C, Matousek, R & Nguyen, TN 2016, 'Efficiency in the Vietnamese banking system: A
DEA double bootstrap approach', Research in International Business and Finance, vol.
36, pp. 96-111. />Sufian, F 2009, 'Determinants of bank efficiency during unstable macroeconomic environment:
Empirical evidence from Malaysia', Research in International Business and Finance, vol.
23, no. 1, pp. 54-77. />
60
Le | Bank risk, Capitalisation and Technical Efficiency in the Vietnamese Banking System
Tan, Y & Floros, C 2013, 'Risk, capital and efficiency in Chinese banking', Journal of
International Financial Markets, Institutions and Money, vol. 26, pp. 378-393.
/>
The Vietnamese Government 2011, Decree No. 10/2011/ND-CP: Amending and Supplementing
Decree No. 141/2006/ND-CP on Regulating Legal Capital of Credit Institutions, The
State Bank of Vietnam, Hanoi.
Vietcombank Securities Company 2011, Banking sector report, Vietcombank Securities
Company, Hanoi.
WB 2014, Financial sector assessment: Vietnam, The World Bank, Hanoi.
---- 2016, World Development Indicators: GDP Growth (annual %), World Bank.
Williams, J 2004, 'Determining management behaviour in European banking', Journal of
Banking & Finance, vol. 28, no. 10, pp. 2427-2460.
/>
61