Worldwide Investment Fund Assets and Flows Trends in the First Quarter 2012 pdf
Bạn đang xem bản rút gọn của tài liệu. Xem và tải ngay bản đầy đủ của tài liệu tại đây (485.96 KB, 16 trang )
International Statistical Release
(*) Including funds of funds.
This release and additional tables
of international statistics are
available on efama’s website
(www.efama.org)
Worldwide Investment Fund Assets and Flows
Trends in the First Quarter 2012
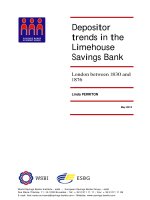
Brussels, 5 July 2012. Investment fund assets worldwide increased by 4.4 percent in the first quarter of
2012 to stand at €20.85 trillion. Worldwide net cash inflows to all funds increased in the first quarter to
€193 billion from €83 billion in the previous quarter. Net cash flows into long-term funds jumped to
€248 billion in the first quarter, compared to €11 billion in the fourth quarter of 2011. This jump was
mainly attributable to increased net sales of bond funds, which increased from €49 billion in the
previous quarter to €169 billion in the first quarter. Equity funds registered a third quarter of net
withdrawals, albeit at a slower pace, registering outflows of €6 billion, compared to net outflows of €52
billion in the previous quarter. Net sales of money market funds returned to negative territory in the first
quarter registering net outflows of €55 billion, against net inflows of €72 billion in the fourth quarter of
2011.
The information presented in this report was compiled by EFAMA and the Investment Company
Institute on behalf of the International Investment Funds Association, an organization of national
investment fund associations. The collection for the first quarter of 2012 contains statistics from 46
countries.
14.39
15.21
16.21
16.94
18.09
18.74
18.67
19.94
19.50 19.49
18.58
19.97
20.85
Q1 Q2 Q3 Q4 Q1 Q2 Q3 Q4 Q1 Q2 Q3 Q4 Q1
Worldwide Investment Fund Assets (*)
(Trillions of euros, end of quarter)
2011
2009
2010
2012
EFAMA International Statistical Release (2012:Q1)
2
On a U.S. dollar-denominated basis and taking into account funds of funds, investment fund assets
worldwide increased 7.8 percent in the first quarter of 2012 to US$27.85 trillion. On a U.S. dollar–
denominated basis investment fund assets in the United States increased 7.6 percent in the first quarter,
compared with a 4.2 percent increase on a Euro-denominated basis. This difference reflects the
depreciation of the US dollar vis-à-vis the euro during the quarter. The following graphs show the net
asset growth of the six largest countries/regions.
9,792
5,634
1,145
1,113
776
709
10,206
5,961
1,224
1,143
762
746
USA Europe Brazil Australia Japan Canada
Geographical Trends in Investment Fund Assets at 2012:Q1
(1)
(Billions of euro, end of quarter)
2011:Q4 2012:Q1
7.6%
4.6%
5.8%
% change in local currency
8.0%
9.3%
6.3%
(1) Including funds of funds.
Equity 4,408 2,010 82 459 463 208
% chg in EUR (1) 10% 8% 19% 4% -2% 4%
% chg in loc. cur. (2) 13% 8% 20% 6% 10% 5%
1046%
Bond 2,299 1,596 463 59 81 89
% chg in EUR (1) 3% 6% 6% 2% -5% 5%
% chg in loc. cur. (2) 6% 6% 7% 4% 5% 6%
46.5%
Money Market 1,933 1,071 34 226 18 25
% chg in EUR (1) -7% 2% 10% 3% -12% -3%
% chg in loc. cur. (2) -4% 2% 11% 5% -3% -3%
Balanced / Mixed 687 947 179 268
% chg in EUR (1) 6% 5% 7% 5%
% chg in loc. cur. (2) 9% 5% 8% 6%
Other (3)
879 337 466 400 200 156
% chg in EUR (1) 9% 8% 6% 2% 0% 9%
% chg in loc. cur. (2) 12% 8% 7% 4% 11% 10%
(1) 2012:Q1 compared to 2011:Q4.
(2) 2012:Q1 compared to 2011:Q4, using the euro as the local currency for Europe.
(3) Including funds of funds.
Australia
Japan
Canada
Brazil
Geographical Trends by Type of Fund, 2012:Q1
(Billions of euros, end of quarter)
USA
Europe
EFAMA International Statistical Release (2012:Q1)
3
On a Euro–denominated basis, equity fund assets worldwide increased 7.8 percent to €7.9 trillion in the
first quarter of 2012. Over the same period balanced funds registered growth of 5.2 percent to €2.2
trillion, whilst bond fund assets grew 4.0 percent to stand at €4.7 trillion. On the other hand, money
market fund assets witnessed an decrease in net assets of 3.3 percent to stand at €3.5 trillion at end
March 2012.
2012 2012 2012
Q1 Q2 Q3 Q4 Q1 Q1 Q2 Q3 Q4 Q1 Q1 Q2 Q3 Q4 Q1
Equity 30 -7 -48 -21 -2 5 8 -43 -29 9 45 16 -79 -52 -6
0 0 0 0 0 0 0 0
Bond 26 47 25 51 86 7 10 -22 -11 49 42 70 7 49 169
0 0 0 0 0 0 0 0 0 0 0 0
Money Market -57 -32 -42 45 -83 -9 -30 -5 11 22 -74 -59 -46 72 -55
0 0 0 0 0 0 0 0 0 0 0 0
Balanced / Mixed 15 9 2 8 21 20 23 -15 -9 8 33 40 -14 -1 44
0 0 0 0 0 0 0 0 0 0 0 0
Other
(3)
24 49 7 21 23 4 6 2 -12 4 56 80 28 15 41
0 0 0
Long-Term
(4)
95 98 -13 60 128 36 47 -78 -61 69 176 206 -58 11 248
Total 38 66 -55 105 44 27 18 -83 -50 91 102 147 -104 83 193
(1) For Austria, Bulgaria, Czech Republic, Denmark, Finland, France, Germany, Greece, Hungary, Ireland, Italy, Liechtenstein,
Luxembourg, Malta, the Netherlands, Norway, Poland, Portugal, Romania, S lovakia, Slovenia, S pain, S weden, S witzerland, Turkey and UK.
(2) 39 countries reported in 2011:Q3; 40 in 2012:Q1; 41 in 2011:Q1, 2011:Q2, 2011:Q4.
Assets of reporting countries represented 93 percent of all countries at the end of 2012:Q1.
(3) Including net sales of funds of funds.
(4) Total excluding Money Market Funds
USA
Europe
(1)
World
(2)
Net Sales of Investment Funds
(Billions of euros)
2011
2011
2011
7,321
7,894
4,515
4,697
3,629
3,508
2,115
2,224
2011:Q4 2012:Q1 2011:Q4 2012:Q1 2011:Q4 2012:Q1 2011:Q4 2012:Q1
Worldwide Assets of Equity, Bond, Money Market,
and Balanced / Mixed Funds
(Billions of euros, end of quarter)
Equity
Bond
Money Market
Balanced / Mixed
EFAMA International Statistical Release (2012:Q1)
4
Investment funds worldwide experienced an increase in net flows in the first quarter of 2012 to register
net inflows of €193 billion, up from €83 billion in the previous quarter. Long-term funds recorded net
inflows of €248 billion, a considerable increase compared to the net inflows of €11 billion recorded in
the previous quarter.
Flows out of equity funds worldwide were €6 billion in the first quarter, after experiencing €52 billion
of net outflows in the fourth quarter of 2011. European equity funds posted net inflows of €9 billion in
the first quarter compared to €29 billion of net outflows in the previous quarter. In the United States,
outflows from equity funds slowed in the first quarter to €2 billion versus net outflows of €21 billion
in the fourth quarter.
Flows into bond funds worldwide increased significantly to €169 billion in the first quarter of 2012,
the largest quarterly bond inflow ever recorded, after registering €49 billion of net inflows in the
fourth quarter. Bond funds reported €86 billion of net inflows in the United States, up from €51 billion
in the previous quarter. In Europe net inflows totaled €49 billion during the first quarter, marking a
sharp turnaround compared to the net outflows of €11 billion recorded in the previous quarter.
Flows into balanced/mixed funds worldwide totaled €44 billion in the first quarter of 2012, compared
with €1 billion of net outflows in the fourth quarter of 2011. These inflows into balanced/mixed funds
were €21 billion in the United States and €8 billion in Europe in the first quarter.
Money market funds worldwide experienced €55 billion of net outflows in the first quarter of 2012,
which contrasts with the €72 billion of net inflows witnessed in the fourth quarter of 2011. While
money market funds in the United States posted outflows of €83 billion in the first quarter, positive
inflows were recorded in Europe. Money market funds in Europe posted net inflows of €22 billion in
the first quarter, up from €11 billion in the previous quarter.
EFAMA International Statistical Release (2012:Q1)
5
At the end of the first quarter of 2012, 38 percent of worldwide investment fund assets were held in
equity funds. The asset share of bond funds was 22 percent and the asset share of balanced/mixed funds
was 11 percent. Money market fund assets represented 17 percent of the worldwide total.
The number of investment funds worldwide stood at 83,005 at the end of the first quarter. By type of
fund, 34 percent were equity funds, 21 percent were balanced/mixed funds, 16 percent were bond funds,
and 4 percent were money market funds.
Other / Unclassified
26%
Equity
34%
Money Market
4%
Bond
16%
Balanced-Mixed
21%
Composition of Worldwide Investment Funds, 2012:Q1
(*)
(Percent of funds, end of quarter)
Other / Unclassified
12%
Equity
38%
Money Market
17%
Bond
22%
Balanced-Mixed
11%
Composition of Worldwide Investment Fund Assets, 2012:Q1
(*)
(Percent of total assets, end of quarter)
(*) Including funds of funds.
(*) Including funds of funds.
EFAMA International Statistical Release (2012:Q1)
6
Looking at the worldwide distribution of investment fund assets at end March 2012, the United States
and Europe held the largest share in the world market, with 48.9 percent and 28.6 percent, respectively.
Brazil, Australia, Japan, Canada, China, Rep. of Korea, South Africa and India follow in this ranking.
Taking into account non-UCITS assets, the market share of Europe reached 36.0 percent at end March
2012.
USA
48.9%
Others
0.9%
Japan
3.7%
Canada
3.6%
Rep. of Korea
0.9%
Europe
28.6%
China
1.2%
Brazil
5.9%
India
0.3%
Australia
5.5%
South Africa
0.6%
Top 10 Countries/Regions of Worldwide Investment Fund Assets (*)
(Market share at end Q1 2012)
Luxembourg
8.9%
France
5.4%
Ireland
4.2%
United Kingdom
3.3%
USA
48.9%
Japan
3.7%
Canada
3.6%
Australia
5.5%
Brazil
5.9%
Germany
1.1%
Others
9.4%
Top 10 Domiciles of Worldwide Investment Fund Assets (*)
(Market share at end Q1 2012)
(*) Including funds of funds.
The chart below highlights the top ten domiciles worldwide of investment fund assets at end March
2012.
EFAMA International Statistical Release (2012:Q1)
7
Table 1
TOTAL NET ASSETS, 2007-2012:Q1
Billions of U.S. dollars, end of period
2012
Q1 Q2 Q3 Q4 Q1
All Reporting Countries
1
26,131 18,920 22,953 24,699 25,620 25,930 23,129 23,791 25,588
Equity 12,341 6,434 8,871 10,467 10,999 11,001 9,039 9,484 10,544
Bond 4,289 3,400 4,567 5,433 5,637 5,867 5,638 5,842 6,273
Money Market 4,940 5,786 5,317 4,995 4,970 4,933 4,746 4,695 4,685
Balanced/Mixed 2,726 1,826 2,402 2,775 2,942 3,025 2,699 2,737 2,970
Other 884 676 840 1,029 1,070 1,104 1,007 1,034 1,116
Countries Reporting in Every Period
2
25,288 18,899 22,916 24,658 25,573 25,883 23,086 23,750 25,548
Equity 11,718 6,428 8,863 10,462 10,994 10,995 9,035 9,479 10,539
Bond 4,154 3,394 4,554 5,423 5,626 5,855 5,626 5,830 6,263
Money Market 4,907 5,780 5,305 4,993 4,968 4,932 4,744 4,693 4,683
Balanced/Mixed 2,683 1,823 2,398 2,770 2,936 3,018 2,693 2,730 2,966
Other 876 676 840 1,010 1,050 1,083 988 1,018 1,096
1
Components may not sum to total because of rounding or unclassified funds.
2
Number of countries is 42. Components may not sum to total because of rounding.
Table 2
NET SALES,
1
2008-2012:Q1
Billions of U.S. dollars
2012
Q1 Q2 Q3 Q4 Q1
All Reporting Countries
2
276 273 191 101 79 109 -171 85 209
Equity -373 187 133 -97 58 24 -108 -70 -8
Bond -196 628 468 238 62 100 10 66 222
Money Market 888 -640 -710 -152 -101 -85 -63 97 -72
Balanced/Mixed -79 117 174 85 47 59 -20 -2 58
Other 35 -19 34 27 13 10 10 -7 10
Countries Reporting in Every Period
3
243 257 104 0 83 39 -158 35 172
Equity -371 174 141 -105 53 14 -103 -69 -11
Bond -204 597 495 216 67 77 15 57 209
Money Market 861 -624 -738 -200 -93 -103 -54 50 -89
Balanced/Mixed -76 128 177 76 48 50 -20 -2 57
Other 33 -19 29 12 7 0 4 0 5
1
Net sales are new sales plus reinvested dividends less redemptions plus net exchanges.
2
Components may not sum to total because of rounding or unclassified funds.
3
Number of countries is 31. Components may not sum to total because of rounding.
Table 3
NUMBER OF FUNDS, 2007-2012:Q1
End of period
2012
Q1 Q2 Q3 Q4 Q1
All Reporting Countries
1
66,347 68,574 67,551 69,518 70,205 70,875 72,280 72,657 73,343
Equity 27,294 27,854 27,489 27,716 27,868 27,832 28,065 28,091 28,358
Bond 13,342 12,252 12,453 12,808 12,903 12,884 12,947 12,971 13,113
Money Market 3,450 3,700 3,521 3,344 3,302 3,210 3,189 3,159 3,072
Balanced/Mixed 13,744 14,501 14,656 15,893 16,146 16,520 16,791 16,842 17,036
Other 5,619 7,170 6,711 6,858 7,024 7,412 7,738 8,014 8,208
Countries Reporting in Every Period
2
62,689 66,330 65,237 67,187 67,828 68,496 69,454 69,815 70,538
Equity 24,694 26,018 25,668 25,987 26,142 26,098 26,383 26,417 26,696
Bond 12,884 12,070 12,215 12,598 12,685 12,665 12,728 12,725 12,855
Money Market 3,358 3,659 3,479 3,308 3,264 3,179 3,153 3,125 3,041
Balanced/Mixed 13,449 14,318 14,444 15,714 15,949 16,328 16,597 16,667 16,862
Other 5,406 7,168 6,710 6,681 6,826 7,209 7,536 7,796 7,983
1
Components may not sum to total because of unclassified funds.
2
Number of countries is 42.
Source: National mutual fund associations; EFAMA provides data for all European countries except Russia.
Source: National mutual fund associations; EFAMA provides data for all European countries except Russia.
ITEM
ITEM
2008
2007
2011
2011
2010
2010
2009
ITEM
Source: National mutual fund associations; EFAMA provides data for all European countries except Russia.
2007
2008
2009
2008
2009
2010
2011
2011
EFAMA International Statistical Release (2012:Q1)
8
Table 4
TOTAL NET ASSETS, 2007-2012:Q1
Billions of euros, end of period
2012
Q1 Q2 Q3 Q4 Q1
All Reporting Countries
1
17,751 13,595 15,933 18,485 18,033 17,941 17,129 18,387 19,159
Equity 8,383 4,623 6,158 7,833 7,742 7,612 6,694 7,329 7,894
Bond 2,914 2,443 3,170 4,066 3,968 4,060 4,175 4,515 4,697
Money Market 3,356 4,158 3,691 3,738 3,498 3,413 3,515 3,629 3,508
Balanced/Mixed 1,852 1,312 1,667 2,077 2,071 2,093 1,999 2,115 2,224
Other 600 486 583 770 753 764 746 799 836
Countries Reporting in Every Period
2
17,178 13,580 15,908 18,454 18,000 17,909 17,097 18,355 19,128
Equity 7,960 4,619 6,152 7,829 7,738 7,608 6,691 7,326 7,891
Bond 2,822 2,439 3,161 4,058 3,960 4,051 4,167 4,506 4,689
Money Market 3,333 4,153 3,682 3,737 3,497 3,412 3,513 3,627 3,507
Balanced/Mixed 1,823 1,310 1,665 2,073 2,066 2,088 1,994 2,110 2,220
Other 595 486 583 756 739 749 732 787 821
1
Components may not sum to total because of rounding or unclassified funds.
2
Number of countries is 42. Components may not sum to total because of rounding.
Table 5
NET SALES,
1
2008-2012:Q1
Billions of euros
2012
Q1 Q2 Q3 Q4 Q1
All Reporting Countries
2
193 195 145 72 58 75 -124 63 159
Equity -260 130 96 -72 42 16 -79 -52 -6
Bond -145 445 354 171 45 70 7 49 169
Money Market 635 -446 -531 -106 -74 -59 -46 72 -55
Balanced/Mixed -58 80 131 60 35 41 -14 -1 44
Other 22 -14 26 19 10 7 7 -5 8
Countries Reporting in Every Period
3
168 185 78 -1 61 27 -115 26 131
Equity -259 121 102 -77 39 10 -75 -51 -8
Bond -151 423 373 156 49 54 11 42 159
Money Market 614 -432 -552 -142 -68 -72 -39 37 -68
Balanced/Mixed -57 88 133 54 35 35 -15 -2 44
Other 20 -14 22 9 5 0 3 0 4
1
Net sales are new sales plus reinvested dividends less redemptions plus net exchanges.
2
Components may not sum to total because of rounding or unclassified funds.
3
Number of countries is 31. Components may not sum to total because of rounding.
Source: National mutual fund associations; EFAMA provides data for all European countries except Russia.
2008
ITEM
2007
2009
2010
2011
2011
Source: National mutual fund associations; EFAMA provides data for all European countries except Russia.
ITEM
2008
2009
2010
2011
Pour mémoire: Tables 1-5 exclude funds of funds.
EFAMA International Statistical Release (2012:Q1)
9
Table 6
TOTAL NET ASSETS OF THE EUROPEAN INVESTMENT FUND INDUSTRY, End March 2012
Number Number Number
of funds in mio euro in mio US $ of funds in mio euro in mio US $ of funds in mio euro in mio US $
Austria 2,166 140,934 188,232 1,360 76,350 101,973 806 64,585 86,259
Belgium 1,898 86,959 116,143 1,866 80,609 107,661 32 6,350 8,481
Bulgaria 94 220 293 93 217 290 1 2 3
Czech Republic 114 4,429 5,916 111 4,342 5,799 3 88 117
Denmark 852 146,115 195,151 515 70,427 94,062 337 75,687 101,088
Finland 500 59,917 80,026 367 51,680 69,024 133 8,237 11,001
France 11,790 1,447,385 1,933,128 7,701 1,132,372 1,512,396 4,089 315,013 420,731
Germany 5,826 1,185,320 1,583,113 2,051 238,736 318,856 3,775 946,584 1,264,258
Greece 232 6,171 8,243 226 4,333 5,787 6 1,839 2,456
Hungary 355 9,270 12,381 236 6,576 8,783 119 2,694 3,598
Ireland 5,077 1,116,422 1,491,093 3,101 870,723 1,162,938 1,976 245,699 328,156
Italy 994 194,008 259,118 645 140,219 187,277 349 53,789 71,841
Liechtenstein 627 28,018 37,421 473 24,281 32,430 154 3,736 4,990
Luxembourg 13,343 2,217,206 2,961,300 9,452 1,863,709 2,489,170 3,891 353,497 472,131
Malta 541 8,171 10,914 61 1,748 2,334 480 6,424 8,580
Netherlands 455 67,201 89,754 455 55,079 73,564 104 12,122 16,190
Norway 576 67,499 90,151 576 67,499 90,151 0 0 0
Poland 592 30,131 40,243 250 16,731 22,346 342 13,400 17,898
Portugal 562 22,719 30,344 189 6,004 8,019 373 16,715 22,325
Romania 138 3,616 4,829 113 1,981 2,645 25 1,635 2,184
Slovakia 81 3,217 4,296 70 2,483 3,316 11 734 980
Slovenia 140 1,882 2,514 140 1,882 2,514 0 0 0
Spain 2,487 158,807 212,102 2,424 153,305 204,754 63 5,502 7,348
Sweden 555 161,446 215,627 532 157,726 210,659 23 3,719 4,968
Switzerland 877 290,017 391,553 681 225,558 305,462 196 64,459 86,091
Turkey 406 19,552 26,114 353 11,105 14,832 53 8,447 11,282
United Kingdom 2,844 884,938 1,181,923 2,065 694,992 928,232 779 189,946 253,692
Europe
3
54,122 8,361,571 11,171,921 36,106 5,960,668 7,965,274 18,120 2,400,904 3,206,647
Source: EFAMA
1
In the sense of publicly offered open-end investment funds (transferable securities and money market instruments), including funds-of-funds assets.
2
In the sense of nationally regulated investment funds for which a classification in terms of market exposure (equity, bond, balanced and money market) is not possible.
3
Data for Russia are not included in this table.
Overall Fund Industry
Net assets
UCITS Market
1
Net assets
Non-UCITS Market
2
Net assets
SUPPLEMENTARY TABLES
Table S1
TOTAL NET ASSETS IN U.S. DOLLARS
1
Millions, end of period
2012
Q1 Q2 Q3 Q4 Q1
World 18,920,057 22,952,806 24,699,170 25,619,816 25,930,060 23,129,301 23,790,910 25,588,350
Americas 10,581,988 12,585,776 13,586,843 14,074,362 14,178,189 12,854,168 13,524,360 14,537,350
Argentina 3,867 4,470 5,179 6,362 5,756 6,112 6,808 8,316
Brazil 479,321 783,970 980,448 1,055,418 1,104,956 952,039 1,008,928 1,110,912
Canada 416,031 565,156 636,947 681,845 681,374 712,720 753,606 814,088
Chile 17,587 34,227 38,243 34,226 34,152 33,117 33,425 36,337
Costa Rica 1,098 1,309 1,470 1,649 1,571 1,435 1,266 1,511
Mexico 60,435 70,659 98,094 100,349 106,261 90,662 92,743 103,123
Trinidad & Tobago 5,832 5,812 5,793 5,913 5,918 5,989 6,079
United States 9,603,649 11,120,153 11,820,650 12,188,720 12,238,206 11,052,165 11,621,595 12,456,983
Europe 6,231,116 7,545,535 7,903,389 8,324,648 8,427,566 7,315,432 7,220,298 7,885,304
Austria 93,269 99,628 94,670 98,358 97,494 86,446 81,038 85,713
Belgium 105,057 106,721 96,288 100,387 100,827 86,310 81,505 86,236
Bulgaria 226 256 302 341 333 304 291 289
Czech Republic 5,260 5,436 5,508 5,886 5,871 4,931 4,445 4,791
Denmark 65,182 83,024 89,800 95,677 96,392 83,893 84,891 93,702
Finland 48,750 66,131 71,210 75,934 75,793 63,422 62,193 69,024
France 1,591,082 1,805,641 1,617,176 1,700,497 1,695,270 1,458,840 1,382,068 1,512,396
Germany 237,986 317,543 333,713 351,633 357,476 299,650 293,011 318,856
Greece 12,189 12,434 8,627 9,301 8,222 6,399 5,213 5,246
Hungary 9,188 11,052 11,532 12,444 12,541 9,532 7,193 7,674
Ireland 720,486 860,515 1,014,104 1,068,445 1,112,830 1,019,346 1,061,051 1,162,938
Italy 263,588 279,474 234,313 238,206 234,042 201,696 180,754 187,277
Liechtenstein 20,489 30,329 35,387 38,027 38,092 34,353 32,606 32,117
Luxembourg 1,860,763 2,293,973 2,512,874 2,656,412 2,684,903 2,302,232 2,277,465 2,489,170
Malta 2,488 2,432 2,254 2,132 2,335
Netherlands 77,379 95,512 85,924 89,510 91,986 79,115 69,156 73,564
Norway 41,157 71,170 84,505 95,991 98,276 80,497 79,999 90,151
Poland 17,782 23,025 25,595 27,221 27,325 20,318 18,463 22,138
Portugal 13,572 15,808 11,004 11,165 10,668 8,354 7,321 7,547
Romania 326 1,134 1,713 2,110 2,296 2,502 2,388 2,637
Russia 2,026 3,182 3,917 4,448 4,258 3,159 3,072 3,508
Slovakia 3,841 4,222 4,349 4,563 4,553 3,794 3,191 3,076
Slovenia 2,067 2,610 2,663 2,813 2,820 2,329 2,279 2,474
Spain 270,983 269,611 216,915 235,409 234,168 206,315 195,220 204,754
Sweden 113,331 170,277 205,449 216,984 215,036 171,403 179,707 198,752
Switzerland 135,052 168,260 261,893 275,619 299,713 277,111 273,061 301,256
Turkey 15,404 19,426 19,545 19,529 18,190 15,609 14,048 14,820
United Kingdom 504,681 729,141 854,413 885,250 895,759 785,318 816,537 902,865
Asia and Pacific 2,037,536 2,715,234 3,067,323 3,078,863 3,181,155 2,839,234 2,921,276 3,030,868
Australia 841,133 1,198,838 1,455,850 1,500,345 1,553,656 1,362,998 1,440,128 1,526,808
China 276,303 381,207 364,985 353,064 348,751 319,975 339,037 336,108
India 62,805 130,284 111,421 98,186 118,992 102,183 87,519 84,044
Japan 575,327 660,666 785,504 785,658 816,325 751,209 745,383 750,512
Korea, Rep. of 221,992 264,573 266,495 259,985 254,410 223,805 226,716 243,157
New Zealand 10,612 17,657 19,562 20,039 23,455 22,431 23,709 26,846
Pakistan 1,985 2,224 2,290 2,377 2,597 2,560 2,984 3,419
Philippines 1,263 1,488 2,184 2,296 2,365 2,244 2,363 2,737
Taiwan 46,116 58,297 59,032 56,913 60,604 51,829 53,437 57,236
Africa 69,417 106,261 141,615 141,943 143,150 120,467 124,976 134,829
South Africa 69,417 106,261 141,615 141,943 143,150 120,467 124,976 134,829
Note: Components may not sum to total because of rounding.
Source: National mutual fund associations; European Fund and Asset Management Association
(EFAMA) provides data for all European countries except Russia.
1
Funds of funds are not included, except for France, Germany, Italy, and Luxembourg. Home-
domiciled funds, except for Hong Kong, New Zealand and Trinidad & Tobago, which include home-
and foreign-domiciled funds.
COUNTRY
2008
2009
2010
2011
7/13/2012
SUPPLEMENTARY TABLES
Table S2
TOTAL NET ASSETS IN EUROS
1
Millions, end of period
2012
Q1 Q2 Q3 Q4 Q1
World 13,594,925 15,932,806 18,484,635 18,033,234 17,940,954 17,129,010 18,386,977 19,158,692
Americas 7,603,643 8,736,481 10,168,270 9,906,639 9,809,859 9,519,490 10,452,399 10,884,509
Argentina 2,779 3,103 3,876 4,478 3,983 4,526 5,262 6,227
Brazil 344,414 544,197 733,758 742,886 764,516 705,057 779,757 831,770
Canada 298,938 392,306 476,685 479,936 471,441 527,824 582,430 609,530
Chile 12,637 23,759 28,621 24,091 23,630 24,525 25,833 27,206
Costa Rica 789 908 1,100 1,161 1,087 1,063 978 1,132
Mexico 43,426 49,048 73,413 70,634 73,522 67,142 71,677 77,211
Trinidad & Tobago 4,048 4,349 4,077 4,091 4,383 4,628 4,551
United States 6,900,660 7,719,112 8,846,468 8,579,376 8,467,589 8,184,970 8,981,834 9,326,882
Europe 4,477,340 5,237,770 5,914,826 5,859,539 5,831,015 5,417,635 5,580,259 5,903,941
Austria 67,018 69,157 70,850 69,232 67,456 64,020 62,631 64,176
Belgium 75,488 74,081 72,061 70,660 69,762 63,919 62,992 64,567
Bulgaria 162 177 226 240 230 225 225 216
Czech Republic 3,779 3,774 4,122 4,143 4,062 3,652 3,435 3,587
Denmark 46,836 57,632 67,206 67,345 66,693 62,129 65,609 70,157
Finland 35,029 45,905 53,293 53,448 52,441 46,969 48,066 51,680
France 1,143,265 1,253,395 1,210,280 1,196,943 1,172,954 1,080,382 1,068,141 1,132,372
Germany 171,004 220,424 249,748 247,507 247,337 221,914 226,456 238,736
Greece 8,758 8,631 6,456 6,547 5,689 4,739 4,029 3,928
Hungary 6,602 7,672 8,631 8,759 8,677 7,060 5,559 5,746
Ireland 517,702 597,331 758,946 752,055 769,965 754,903 820,041 870,723
Italy 189,400 193,998 175,358 167,668 161,933 149,371 139,697 140,219
Liechtenstein 14,723 21,053 26,484 26,767 26,356 25,441 25,200 24,047
Luxembourg 1,337,043 1,592,373 1,880,612 1,869,791 1,857,679 1,704,978 1,760,155 1,863,709
Malta 1,751 1,683 1,669 1,648 1,748
Netherlands 55,600 66,300 64,305 63,004 63,645 58,591 53,448 55,079
Norway 29,573 49,403 63,243 67,566 67,997 59,614 61,828 67,498
Poland 12,777 15,983 19,155 19,160 18,906 15,047 14,269 16,575
Portugal 9,752 10,973 8,235 7,859 7,381 6,187 5,658 5,651
Romania 234 787 1,282 1,485 1,589 1,853 1,845 1,975
Russia 1,456 2,209 2,932 3,131 2,946 2,339 2,374 2,627
Slovakia 2,760 2,931 3,255 3,212 3,150 2,810 2,466 2,303
Slovenia 1,485 1,812 1,993 1,980 1,951 1,725 1,761 1,852
Spain 194,714 187,152 162,337 165,699 162,020 152,792 150,877 153,305
Sweden 81,434 118,198 153,756 152,731 148,783 126,937 138,888 148,811
Switzerland 97,041 116,798 195,998 194,002 207,370 205,222 211,037 225,558
Turkey 11,069 13,484 14,627 13,746 12,586 11,559 10,857 11,096
United Kingdom 362,636 506,137 639,435 623,108 619,774 581,588 631,067 676,000
Asia and Pacific 1,464,062 1,884,794 2,295,556 2,167,145 2,201,035 2,102,670 2,257,731 2,269,293
Australia 604,392 832,179 1,089,545 1,056,060 1,074,971 1,009,404 1,113,013 1,143,163
China 198,536 264,617 273,152 248,514 241,300 236,966 262,028 251,653
India 45,128 90,437 83,386 69,111 82,331 75,674 67,639 62,926
Japan 413,399 458,605 587,864 553,008 564,814 556,328 576,075 561,929
Korea, Rep. of 159,511 183,655 199,442 182,998 176,025 165,745 175,219 182,058
New Zealand 7,625 12,257 14,640 14,105 16,229 16,612 18,324 20,101
Pakistan 1,426 1,544 1,713 1,673 1,797 1,896 2,307 2,560
Philippines 908 1,033 1,635 1,616 1,636 1,662 1,827 2,049
Taiwan 33,137 40,467 44,179 40,060 41,932 38,383 41,299 42,854
Africa 49,880 73,761 105,983 99,911 99,045 89,215 96,588 100,950
South Africa 49,880 73,761 105,983 99,911 99,045 89,215 96,588 100,950
-
Note: Components may not sum to total because of rounding.
Source: National mutual fund associations; European Fund and Asset Management Association (EFAMA)
provides data for all European countries except Russia.
1
Funds of funds are not included, except for France, Germany, Italy, and Luxembourg. Home-domiciled
funds, except for Hong Kong, New Zealand and Trinidad & Tobago, which include home- and foreign-
domiciled funds.
2008
2009
2010
COUNTRY
2011
7/13/2012
SUPPLEMENTARY TABLES
Table S3
TOTAL NET ASSETS IN LOCAL CURRENCIES
1
Millions,
2
end of period
2012
Q1 Q2 Q3 Q4 Q1
Americas
Argentina 13,355 16,983 20,605 25,775 23,650 25,699 29,276 36,416
Brazil 1,109,388 1,367,636 1,628,818 1,722,231 1,727,377 1,789,167 1,883,567 2,029,414
Canada 507,059 595,222 635,673 661,799 656,436 748,570 769,658 813,030
Chile 11,229,370 17,368,463 17,897,598 16,341,050 15,956,632 17,212,398 17,366,113 17,745,118
Costa Rica 610,133 739,705 754,019 827,174 792,096 738,993 647,965 767,727
Mexico 826,351 925,024 1,210,495 1,194,640 1,244,693 1,259,956 1,292,436 1,321,077
Trinidad & Tobago 36,914 37,195 37,189 37,964 37,878 38,448 39,026
United States 9,603,649 11,120,153 11,820,650 12,188,720 12,238,206 11,052,165 11,621,595 12,456,983
Europe
Austria 67,018 69,157 70,850 69,232 67,456 64,020 62,631 64,176
Belgium 75,488 74,081 72,061 70,660 69,762 63,919 62,992 64,567
Bulgaria 317 347 442 470 450 440 440 423
Czech Republic 101,569 99,902 103,302 101,677 98,890 90,398 88,584 88,712
Denmark 348,960 428,884 500,920 502,169 497,443 462,345 487,747 521,962
Finland 35,029 45,905 53,293 53,448 52,441 46,969 48,066 51,680
France 1,143,265 1,253,395 1,210,280 1,196,943 1,172,954 1,080,382 1,068,141 1,132,372
Germany 171,004 220,424 249,748 247,507 247,337 221,914 226,456 238,736
Greece 8,758 8,631 6,456 6,547 5,689 4,739 4,029 3,928
Hungary 1,760,781 2,074,642 2,399,070 2,327,351 2,309,119 2,065,089 1,748,938 1,694,425
Ireland 517,702 597,331 758,946 752,055 769,965 754,903 820,041 870,723
Italy 189,400 193,998 175,358 167,668 161,933 149,371 139,697 140,219
Liechtenstein 21,863 31,234 33,115 34,810 31,814 30,962 30,633 28,964
Luxembourg 1,337,043 1,592,373 1,880,612 1,869,791 1,857,679 1,704,978 1,760,155 1,863,709
Malta 1,751 1,683 1,669 1,648 1,748
Netherlands 55,600 66,300 64,305 63,004 63,645 58,591 53,448 55,079
Norway 288,340 410,046 493,295 529,242 529,526 470,236 479,410 513,258
Poland 53,069 65,601 76,140 76,845 75,442 66,282 63,613 68,824
Portugal 9,752 10,973 8,235 7,859 7,381 6,187 5,658 5,651
Romania 941 3,350 5,479 6,144 6,708 8,143 7,971 8,670
Russia 59,584 95,561 119,616 126,413 118,667 101,667 98,736 102,958
Slovakia
3
83,151 2,931 3,255 3,212 3,150 2,810 2,466 2,303
Slovenia 1,485 1,812 1,993 1,980 1,951 1,725 1,761 1,852
Spain 194,714 187,152 162,337 165,699 162,020 152,792 150,877 153,305
Sweden 885,186 1,211,769 1,378,503 1,364,330 1,364,918 1,175,186 1,237,769 1,316,306
Switzerland 144,106 173,282 245,076 252,300 250,317 249,755 256,537 271,685
Turkey 23,784 29,055 30,270 30,169 29,576 29,014 26,526 26,380
United Kingdom 345,411 449,500 550,394 550,641 559,377 504,033 527,130 563,716
Asia and Pacific
Australia 1,197,184 1,335,505 1,422,657 1,452,484 1,449,095 1,410,703 1,410,605 1,475,813
China 1,886,511 2,602,499 2,411,457 2,311,968 2,254,292 2,041,822 2,134,241 2,116,978
India 3,065,020 6,061,460 4,981,060 4,377,640 5,318,730 5,004,260 4,644,170 4,275,870
Japan 52,147,648 61,455,165 63,720,067 65,311,768 65,763,151 57,888,204 57,327,400 62,194,916
Korea, Rep. of 279,609,852 307,963,080 300,072,814 285,185,191 271,620,328 263,665,121 261,279,166 275,520,661
New Zealand 18,322 24,429 25,073 26,315 28,287 29,461 30,507 32,790
Pakistan 157,015 187,357 196,077 202,906 223,307 223,898 268,463 309,927
Philippines 60,030 68,666 95,666 99,554 102,594 98,211 103,613 117,440
Taiwan 1,512,252 1,864,617 1,729,582 1,673,527 1,740,796 1,580,001 1,618,026 1,688,755
Africa
South Africa 661,201 786,117 938,779 961,567 969,027 975,389 1,011,053 1,034,541
-
3 Prior to 2009:Q1, data reported in the slovak koruna. Starting in 2009:Q1, Slovakia adopted the Euro and data are reported in Euros.
2
Local currency values for euro-area countries are reported in euros beginning in 1999 except for Greece, which adopted the euro in 2001.
1
Funds of funds are not included, except for France, Germany, Italy, and Luxembourg. Home-domiciled funds,
except for Hong Kong, New Zealand and Trinidad & Tobago, which include home- and foreign-domiciled funds.
Source: National mutual fund associations; European Fund and Asset Management Association (EFAMA)
provides data for all European countries except Russia.
2008
2009
2010
COUNTRY
2011
7/13/2012
SUPPLEMENTARY TABLES
Table S4
TOTAL NET ASSETS IN U.S. DOLLARS BY TYPE OF FUND,
1
2012:Q1
Millions, end of period
World 25,588,350 10,543,599 6,272,833 4,685,298 2,970,283 1,116,342
Americas 14,537,350 6,284,930 3,847,605 2,747,128 1,532,389 125,298
Argentina 8,316 397 4,014 2,821 1,084
Brazil 1,110,912 109,634 617,755 45,804 239,532 98,188
Canada 814,088 278,058 118,234 33,073 358,586 26,137
Chile 36,337 3,549 9,312 18,790 3,712 974
Costa Rica 1,511 12 67 1,432
Mexico 103,123 6,105 22,636 63,063 11,318
Trinidad & Tobago 6,079 53 5,343 683
United States 12,456,983 5,887,120 3,070,244 2,582,145 917,474
Europe 7,885,304 2,686,743 2,131,823 1,430,193 1,265,844 370,706
Austria 85,713 14,446 54,575 1,529 14,009 1,154
Belgium 86,236 46,502 12,593 5,975 21,165
Bulgaria 289 85 16 117 68 3
Czech Republic 4,791 774 2,141 481 1,394
Denmark 93,702 34,501 54,534 7 4,661
Finland 69,024 24,795 19,756 14,107 9,033 1,334
France 1,512,396 393,521 269,827 500,214 327,962 20,871
Germany 318,856 153,686 73,475 5,432 67,887 18,375
Greece 5,246 1,392 1,441 963 886 566
Hungary 7,674 647 1,449 5,493 68 18
Ireland 1,162,938 310,944 363,732 390,735 58,545 38,982
Italy 187,277 27,308 70,565 33,138 56,266
Liechtenstein 32,117 4,463 4,000 1,726 3,813 18,115
Luxembourg 2,489,170 763,644 787,208 379,679 397,930 160,709
Malta 2,335 166 223 143 1,803
Netherlands 73,564 35,112 16,292 15,139 7,021
Norway 90,151 47,691 20,707 17,536 3,360 857
Poland 22,138 6,222 5,527 4,063 2,865 3,461
Portugal 7,547 1,417 2,377 1,127 976 1,651
Romania 2,637 179 771 1,204 80 402
Russia 3,508 2,067 647 43 752
Slovakia 3,076 270 1,629 306 640 231
Slovenia 2,474 1,644 118 28 681 3
Spain 204,754 54,375 92,911 12,370 45,098
Sweden 198,752 131,957 12,310 14,038 38,309 2,137
Switzerland 301,256 97,413 73,632 22,729 107,483
Turkey 14,820 482 1,206 11,331 1,089 711
United Kingdom 902,865 531,042 188,160 5,822 85,542 92,300
Asia and Pacific 3,030,868 1,538,950 291,527 476,854 127,643 595,894
Australia 1,526,808 612,494 78,318 301,435 534,561
China 336,108 180,007 27,429 47,171 81,502
India 84,044 31,135 29,045 15,794 3,194 4,876
Japan 750,512 618,163 108,486 23,862
Korea, Rep. of 243,157 71,167 40,217 56,324 25,922 49,526
New Zealand 26,846 4,085 2,166 3,168 15,301 2,126
Pakistan 3,419 661 70 2,530 93 65
Philippines 2,737 590 1,596 31 519
Taiwan 57,236 20,647 4,201 26,539 1,112 4,738
Africa 134,829 32,977 1,878 31,123 44,407 24,445
South Africa 134,829 32,977 1,878 31,123 44,407 24,445
Note: Components may not sum to total because of rounding or unclassified funds.
1
Funds of funds are not included, except for France, Germany, Italy, and Luxembourg. Home-domiciled funds, except for New Zealand
and Trinidad & Tobago, which include home- and foreign-domiciled funds.
Money Market
Balanced/Mixed
Other
COUNTRY
Total
Equity
Bond
Source: National mutual fund associations; European Fund and Asset Management Association (EFAMA) provides data for all European
countries except Russia.
7/13/2012
SUPPLEMENTARY TABLES
Table S5
TOTAL NET ASSETS IN EUROS BY TYPE OF FUND,
1
2012:Q1
Millions, end of period
World 19,158,692 7,894,279 4,696,641 3,508,010 2,223,932 835,836
Americas 10,884,509 4,705,697 2,880,807 2,056,849 1,147,341 93,814
Argentina 6,227 297 3,005 2,112 812
Brazil 831,770 82,086 462,530 34,294 179,344 73,516
Canada 609,530 208,190 88,525 24,763 268,483 19,569
Chile 27,206 2,658 6,972 14,068 2,779 729
Costa Rica 1,132 9 50 1,072
Mexico 77,211 4,571 16,948 47,217 8,474
Trinidad & Tobago 4,551 40 4,000 511
United States 9,326,882 4,407,847 2,298,775 1,933,322 686,938
Europe 5,903,941 2,011,637 1,596,154 1,070,825 947,772 277,557
Austria 64,176 10,816 40,862 1,145 10,489 864
Belgium 64,567 34,817 9,429 4,474 15,847
Bulgaria 216 64 12 87 51 2
Czech Republic 3,587 579 1,603 360 1,044
Denmark 70,157 25,832 40,831 5 3,490
Finland 51,680 18,565 14,792 10,562 6,763 999
France 1,132,372 294,640 202,027 374,524 245,554 15,627
Germany 238,736 115,069 55,013 4,067 50,829 13,758
Greece 3,928 1,042 1,079 721 663 424
Hungary 5,746 484 1,085 4,113 51 13
Ireland 870,723 232,812 272,336 292,554 43,834 29,187
Italy 140,219 20,446 52,834 24,811 42,128
Liechtenstein 24,047 3,342 2,995 1,293 2,855 13,563
Luxembourg 1,863,709 571,761 589,404 284,276 297,941 120,327
Malta 1,748 124 167 107 1,350
Netherlands 55,079 26,289 12,198 11,335 5,257
Norway 67,498 35,707 15,504 13,130 2,516 642
Poland 16,575 4,659 4,138 3,042 2,145 2,592
Portugal 5,651 1,061 1,780 844 731 1,236
Romania 1,975 134 578 901 60 301
Russia 2,627 1,548 485 32 563
Slovakia 2,303 202 1,220 229 479 173
Slovenia 1,852 1,231 88 21 510 2
Spain 153,305 40,712 69,565 9,262 33,766
Sweden 148,811 98,800 9,217 10,510 28,683 1,600
Switzerland 225,558 72,936 55,130 17,018 80,476
Turkey 11,096 361 903 8,484 816 532
United Kingdom 676,000 397,605 140,880 4,359 64,047 69,108
Asia and Pacific 2,269,293 1,152,254 218,274 357,033 95,570 446,162
Australia 1,143,163 458,591 58,639 225,693 400,241
China 251,653 134,776 20,537 35,318 61,023
India 62,926 23,312 21,747 11,825 2,391 3,651
Japan 561,929 462,836 81,227 17,866
Korea, Rep. of 182,058 53,285 30,111 42,171 19,409 37,082
New Zealand 20,101 3,059 1,621 2,372 11,456 1,592
Pakistan 2,560 495 52 1,894 69 49
Philippines 2,049 442 1,195 24 389
Taiwan 42,854 15,459 3,145 19,871 832 3,547
Africa 100,950 24,691 1,406 23,302 33,249 18,302
South Africa 100,950 24,691 1,406 23,302 33,249 18,302
Note: Components may not sum to total because of rounding or unclassified funds.
1
Funds of funds are not included, except for France, Germany, Italy, and Luxembourg. Home-domiciled funds, except for New Zealand
and Trinidad & Tobago, which include home- and foreign-domiciled funds.
Money Market
Balanced/Mixed
Other
COUNTRY
Total
Equity
Bond
Source: National mutual fund associations; European Fund and Asset Management Association (EFAMA) provides data for all European
countries except Russia.
7/13/2012
SUPPLEMENTARY TABLES
Table S6
TOTAL NET ASSETS IN LOCAL CURRENCIES BY TYPE OF FUND,
1
2012:Q1
Millions, end of period
Americas
Argentina 36,416 1,739 17,577 12,353 4,748
Brazil 2,029,414 200,280 1,128,515 83,674 437,577 179,369
Canada 813,030 277,697 118,080 33,030 358,120 26,103
Chile 17,745,118 1,733,330 4,547,617 9,175,947 1,812,632 475,592
Costa Rica 767,727 6,014 34,149 727,564
Mexico 1,321,077 78,215 289,983 807,887 144,992
Trinidad & Tobago 39,026 340 34,301 4,385
United States 12,456,983 5,887,120 3,070,244 2,582,145 917,474
Europe
Austria 64,176 10,816 40,862 1,145 10,489 864
Belgium 64,567 34,817 9,429 4,474 15,847
Bulgaria 423 125 24 171 99 4
Czech Republic 88,712 14,329 39,651 8,913 25,819
Denmark 521,962 192,184 303,777 37 25,964
Finland 51,680 18,565 14,792 10,562 6,763 999
France 1,132,372 294,640 202,027 374,524 245,554 15,627
Germany 238,736 115,069 55,013 4,067 50,829 13,758
Greece 3,928 1,042 1,079 721 663 424
Hungary 1,694,425 142,841 319,891 1,212,912 14,918 3,863
Ireland 870,723 232,812 272,336 292,554 43,834 29,187
Italy 140,219 20,446 52,834 24,811 42,128
Liechtenstein 28,964 4,025 3,607 1,557 3,439 16,337
Luxembourg 1,863,709 571,761 589,404 284,276 297,941 120,327
Malta 1,748 124 167 107 1,350
Netherlands 55,079 26,289 12,198 11,335 5,257
Norway 513,258 271,520 117,889 99,838 19,130 4,881
Poland 68,824 19,343 17,182 12,630 8,908 10,761
Portugal 5,651 1,061 1,780 844 731 1,236
Romania 8,670 589 2,536 3,958 264 1,323
Russia 102,958 60,656 18,992 1,254 22,056
Slovakia 2,303 202 1,220 229 479 173
Slovenia 1,852 1,231 88 21 510 2
Spain 153,305 40,712 69,565 9,262 33,766
Sweden 1,316,306 873,935 81,529 92,970 253,718 14,154
Switzerland 271,685 87,851 66,404 20,498 96,933
Turkey 26,380 858 2,147 20,170 1,939 1,265
United Kingdom 563,716 331,563 117,480 3,635 53,409 57,629
Asia and Pacific
Australia 1,475,813 592,037 75,702 291,367 516,707
China 2,116,978 1,133,775 172,759 297,104 513,340
India 4,275,870 1,584,030 1,477,720 803,540 162,500 248,080
Japan 62,194,916 51,227,196 8,990,270 1,977,450
Korea, Rep. of 275,520,661 80,639,283 45,569,527 63,820,816 29,372,571 56,118,464
New Zealand 32,790 4,990 2,645 3,869 18,689 2,597
Pakistan 309,927 59,941 6,313 229,353 8,397 5,923
Philippines 117,440 25,320 68,505 1,349 22,265
Taiwan 1,688,755 609,178 123,943 783,036 32,803 139,795
Africa
South Africa 1,034,541 253,031 14,410 238,803 340,735 187,563
1
Funds of funds are not included, except for France, Germany, Italy, and Luxembourg. Home-domiciled funds, except for New Zealand and Trinidad & Tobago,
which include home- and foreign-domiciled funds.
Money Market
Balanced/Mixed
Other
COUNTRY
Total
Equity
Bond
Source: National mutual fund associations; European Fund and Asset Management Association (EFAMA) provides data for all European countries except Russia.
7/13/2012
SUPPLEMENTARY TABLES
Table S7
NUMBER OF MUTUAL FUNDS
1
End of period
2012
Q1 Q2 Q3 Q4 Q1
World 68,574 67,551 69,518 70,205 70,875 72,280 72,657 73,343
Americas 16,459 16,953 18,018 18,383 18,494 19,464 19,799 20,393
Argentina 253 252 254 260 267 273 281 285
Brazil 4,169 4,744 5,618 5,836 5,951 6,308 6,513 6,805
Canada 2,015 2,075 2,117 2,126 2,146 2,660 2,655 2,808
Chile 1,484 1,691 1,912 1,993 2,052 2,076 2,150 2,220
Costa Rica 85 64 68 65 65 62 63 63
Mexico 431 407 434 454 461 460 464 469
Trinidad & Tobago 36 35 36 36 36 36 36
United States 8,022 7,684 7,580 7,613 7,516 7,589 7,637 7,707
Europe 36,322 34,899 35,292 35,361 35,464 35,845 35,713 35,658
Austria 1,065 1,016 1,016 1,018 1,012 1,008 1,003 998
Belgium 1,828 1,845 1,797 1,787 1,787 1,735 1,723 1,723
Bulgaria 81 85 90 93 93 93 92 92
Czech Republic 76 78 80 77 78 78 80 78
Denmark 489 483 490 513 504 487 500 507
Finland 389 377 366 365 371 372 368 367
France 8,301 7,982 7,791 7,799 7,855 7,813 7,744 7,701
Germany 1,675 2,067 2,106 2,075 2,049 2,023 2,051 2,051
Greece 239 210 213 203 201 200 196 196
Hungary 270 264 276 280 278 281 152 157
Ireland 3,097 2,721 2,899 2,962 3,017 3,057 3,085 3,101
Italy 742 675 650 654 654 659 659 645
Liechtenstein 335 348 409 415 405 410 437 438
Luxembourg 9,351 9,017 9,353 9,440 9,455 9,485 9,462 9,452
Malta 46 58 59 59 61
Netherlands 493 495 455
Norway 530 487 507 507 507 507 507 576
Poland 210 208 214 220 225 226 226 235
Portugal 184 171 171 179 175 176 173 172
Romania 52 51 56 56 59 85 105 112
Russia 528 480 462 467 467 469 472 475
Slovakia 56 54 58 61 61 62 63 61
Slovenia 125 125 130 132 133 131 137 137
Spain 2,944 2,588 2,486 2,518 2,522 2,486 2,474 2,424
Sweden 508 506 504 504 506 498 508 488
Switzerland 572 509 653 662 670 665 664 681
Turkey 304 286 311 318 325 335 337 347
United Kingdom 2,371 2,266 2,204 2,010 1,997 1,952 1,941 1,928
Asia and Pacific 14,909 14,795 15,265 15,527 15,974 16,018 16,198 16,347
Australia
China 429 547 660 693 750 786 831 868
India 551 590 658 683 683 674 680 690
Japan 3,333 3,656 3,905 3,956 4,025 4,093 4,196 4,247
Korea, Rep. of 9,384 8,703 8,687 8,824 9,101 9,030 9,064 9,106
New Zealand 643 702 700 697 725 729 709 713
Pakistan 83 96 125 126 126 130 137 140
Philippines 43 41 43 46 47 47 47 48
Taiwan 443 460 487 502 517 529 534 535
Africa 884 904 943 934 943 953 947 945
South Africa 884 904 943 934 943 953 947 945
1
Funds of funds are not included, except for France, Germany, Italy, and Luxembourg. Home-domiciled funds, except
for Hong Kong, New Zealand and Trinidad & Tobago, which include home- and foreign-domiciled funds.
COUNTRY
Source: National mutual fund associations; European Fund and Asset Management Association (EFAMA) provides
data for all European countries except Russia.
2008
2009
2010
2011
7/13/2012