Lecture International trade and investment (2/e): Chapter 14 - John Gionea
Bạn đang xem bản rút gọn của tài liệu. Xem và tải ngay bản đầy đủ của tài liệu tại đây (1.66 MB, 18 trang )
Chapter 14
Doing business in advanced
economies
Copyright 2006 McGraw-Hill Australia Pty Ltd. PPTs t/a International Trade and Investment:
An Asia-Pacific Perspective 2e by Gionea. Slides prepared by John Gionea..
14–1
Lecture plan
• Definition of advanced economies (AEs)
• Import markets in ICs
– Western Europe; North America;
Japan; Australia and New Zealand;
newly industrialised economies
(NIEA-4)
• Trade issues in AEs
• Export marketing aspects
• Investing in AEs
Copyright 2006 McGraw-Hill Australia Pty Ltd. PPTs t/a International Trade and Investment:
An Asia-Pacific Perspective 2e by Gionea. Slides prepared by John Gionea..
14–2
Features of advanced economies
• High per capita income and standard of living
• Market based economic systems; limited
government intervention
• Mature secondary sector; dynamic tertiary sector
• Rational macroeconomic policies
• Sophisticated financial systems
• Well-developed infrastructures
• Advanced communication networks
• High-level education and training
Copyright 2006 McGraw-Hill Australia Pty Ltd. PPTs t/a International Trade and Investment:
An Asia-Pacific Perspective 2e by Gionea. Slides prepared by John Gionea..
14–3
Advanced economies as mixed
economies
• Predominance of private sector
–
domestic firms (small, medium, large)
–
MNEs
• Various degrees of government intervention
• Substantial freedom for markets and MNEs
Copyright 2006 McGraw-Hill Australia Pty Ltd. PPTs t/a International Trade and Investment:
An Asia-Pacific Perspective 2e by Gionea. Slides prepared by John Gionea..
14–4
Government involvement in
production of goods and services
• Government sector: about 1/3 of GDP of
ICs + 10% of GDP for government
companies
• Government ownership: electric and
telephone utilities; banking, petroleum
• Australia
– about 1/4 of GDP ( >US and UK;
• Privatisation trends in 1990s
Copyright 2006 McGraw-Hill Australia Pty Ltd. PPTs t/a International Trade and Investment:
An Asia-Pacific Perspective 2e by Gionea. Slides prepared by John Gionea..
14–5
Government involvement in
international business
• OECD: Principle of national treatment
for non-nationals (no discrimination
against foreign firms).
• Government control of international trade
and investment
– tariffs; non-tariff measures; taxes
– export support measures
Copyright 2006 McGraw-Hill Australia Pty Ltd. PPTs t/a International Trade and Investment:
An Asia-Pacific Perspective 2e by Gionea. Slides prepared by John Gionea..
14–6
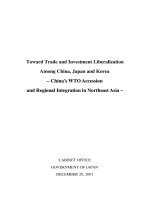
Shares of main groupings in total imports
of goods and services of advanced
economies (AEs) in 2003
NIEA = Newly Industrialised
Asian Economies
Source: adapted from WTO,
International Trade Statistics
2004
Copyright 2006 McGraw-Hill Australia Pty Ltd. PPTs t/a International Trade and Investment:
An Asia-Pacific Perspective 2e by Gionea. Slides prepared by John Gionea..
14–7
Merchandise import markets in advanced
economies (W. Europe, N. America,
Japan), U$S billion and %, 2003
•
Merchandise imports of the Triad (US$5065)
–
primary products (21.5–41.43%)
* food; raw materials; ores and minerals
–
manufactures (58–78%)
* iron and steel
* chemicals
* other semi-manufactures
* machinery and transport equipment (28–46.5%)
* textiles
* clothing
* other consumer goods
Copyright 2006 McGraw-Hill Australia Pty Ltd. PPTs t/a International Trade and Investment:
An Asia-Pacific Perspective 2e by Gionea. Slides prepared by John Gionea..
14–8
Australia and New Zealand’s merchandise
imports by source (%), 1990 and 2003
Supplier
1990
2003
North America
23.4
17.0
Latin America
1.0
0.9
27.2
24.4
Africa
0.4
1.1
Central & Eastern Europe
0.4
0.2
Middle East
3.4
2.3
17.9
12.2
8.5
9.3
17.9
32.6
Western Europe
Japan
Australia & New Zealand
Other Asia
Source: adapted from WTO International Trade Statistics 2001, 2004, Table A2
Copyright 2006 McGraw-Hill Australia Pty Ltd. PPTs t/a International Trade and Investment:
An Asia-Pacific Perspective 2e by Gionea. Slides prepared by John Gionea..
14–9
Merchandise imports of NIEAs by source,
2003, US$ billion and %
Singapore
Total US$ b.
out of which %
Asia
Taiwan
Hong
Kong
Rep. of
Korea
127.9
127.2
232.5
178.8
80.7
50.7
58.2
57.7
W.Europe
9.7
12.0
12.8
14.3
N&C America
6.2
16.1
14.4
15.0
Middle East
1.2
12.8
8.2
8.7
L.America
0.5
2.1
1.5
0.4
Africa
0.4
1.3
2.1
0.5
Oceania
0.8
3.6
2.5
1.9
Rest of the
world
0.5
1.5
0.2
1.5
Source: adapted from Asian Development Bank statistics,
Copyright 2006 McGraw-Hill Australia Pty Ltd. PPTs t/a International Trade and Investment:
An Asia-Pacific Perspective 2e by Gionea. Slides prepared by John Gionea..
14–10
Trade policy issues
•
•
•
•
Free trade agreements
Protection policy issues
Export marketing issues
Cultural differences
– US vs Europe
– US vs Australia/New Zealand
Copyright 2006 McGraw-Hill Australia Pty Ltd. PPTs t/a International Trade and Investment:
An Asia-Pacific Perspective 2e by Gionea. Slides prepared by John Gionea..
14–11
Export marketing aspects
• Very competitive markets
(local/regional and foreign
competition)
• Intra-MNE trade
• Sophisticated marketing techniques
– market segmentation
Copyright 2006 McGraw-Hill Australia Pty Ltd. PPTs t/a International Trade and Investment:
An Asia-Pacific Perspective 2e by Gionea. Slides prepared by John Gionea..
14–12
Export marketing aspects
cont.
• Price-setting strategies
– standard; dual; market-differentiated
pricing
– ‘gray markets’ (parallel importation)
• High media spending (e.g. US,
Switzerland)
– legal differences in advertising
• Distribution channels tend to be
shorter than in developing countries
Copyright 2006 McGraw-Hill Australia Pty Ltd. PPTs t/a International Trade and Investment:
An Asia-Pacific Perspective 2e by Gionea. Slides prepared by John Gionea..
14–13
Advertising expenditure per head
($US) and by medium (%) , 2003
$US/
Head
USA Japan
UK
Australia
NZ
Hong
Kong
Singapore
522
283
264
249
274
293
286
% of total expenditure
TV
36.4
46.1
31.4
36.0
33.1
34.2
42.8
Radio
13.0
4.3
4.2
9.3
13.6
6.3
7.9
42.7
34.5
54.8
49.7
50.2
51.3
42.9
Cinema
0.2
12.6
1.8
0.8
0.5
0.2
0.7
Outdoor
3.0
2.4
6.1
3.4
2.6
7.3
5.6
Online
4.7
0
1.8
0.8
0.7
0
Source: adapted from Euromonitor, Global Market Information Database, January 2005
Copyright 2006 McGraw-Hill Australia Pty Ltd. PPTs t/a International Trade and Investment:
An Asia-Pacific Perspective 2e by Gionea. Slides prepared by John Gionea..
14–14
Foreign direct investment in the
Triad
• Increasing concentration (‘the Triad’)
1999–2000
– 80% of global FDI inflows
– 78% of global FDI outflows
• US and EU > inward FDI than Japan
– foreign affiliates: 1.5% of total sales in Japan
• Sectoral shifts since mid 1970s
– services up; primary/secondary sectors down
– banking: the leading service sector
Copyright 2006 McGraw-Hill Australia Pty Ltd. PPTs t/a International Trade and Investment:
An Asia-Pacific Perspective 2e by Gionea. Slides prepared by John Gionea..
14–15
16
14
12
10
8
6
4
2
0
5.0
4.0
3.0
2.0
% of world
US$ Billion
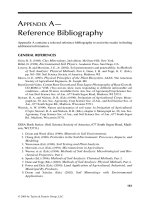
FDI inflows into Oceania, 1993–2003,
$US billion
Australia
New Zealand
CER share
1.0
0.0
Source: adapted from UNCTAD, World Investment Report, 2004
Copyright 2006 McGraw-Hill Australia Pty Ltd. PPTs t/a International Trade and Investment:
An Asia-Pacific Perspective 2e by Gionea. Slides prepared by John Gionea..
14–16
Investment considerations
• Political stability
• Nationalisation; government controls
– prices, pollution
• Economic outlook
(e.g. synchronised cycles)
• Attitude to foreign investment
Copyright 2006 McGraw-Hill Australia Pty Ltd. PPTs t/a International Trade and Investment:
An Asia-Pacific Perspective 2e by Gionea. Slides prepared by John Gionea..
14–17
Investment considerations
cont.
• Taxes
• Incentives
• Personnel, labour and social
considerations
• Exchange rates
• Ease of doing business
Copyright 2006 McGraw-Hill Australia Pty Ltd. PPTs t/a International Trade and Investment:
An Asia-Pacific Perspective 2e by Gionea. Slides prepared by John Gionea..
14–18