Summary of technical doctoral thesis: Research on the selection of models for mineral resource assessment of lode gold deposits at Phuoc Son – Quang Nam
Bạn đang xem bản rút gọn của tài liệu. Xem và tải ngay bản đầy đủ của tài liệu tại đây (582.39 KB, 27 trang )
MINISTRY OF EDUCATION AND TRAINING
HANOI UNIVERSITY OF MINING AND GEOLOGY
LE VAN LUONG
RESEARCH ON THE SELECTION OF MODELS FOR
MINERAL RESOURCE ASSESSMENT OF LODE GOLD
DEPOSITS AT PHUOC SON – QUANG NAM
SUMMARY OF TECHNICAL DOCTORAL THESIS
Ha Noi - 2014
The study was completed at: Drilling and Production Department,
Petroleum Faculty, Ha noi University of Mining and Geology.
Advisors:
1. Prof. Dr Truong Xuan Luan
2. Prof. Dr Nguyen Phuong
Reviewer 1: Prof. Dr Đo Đinh Toat
Reviewer 2: Dr Hoang Van Khoa
Reviewer 3: Dr Bui Tat Hop
The thesis will be defended in Assessment Committee of University level which
meeting at Hanoi University of Mining and Geology in time ..... hour...date
....month...year 2014
References to thesis at library: National library or
Hanoi University of Mining and Geology library
1
INTRODUCTION
1. Rationale of research: The Phuoc Son area, of Quang Nam
province, has complex geological structures and rich in mineral
resources, especially, lode gold deposits. However, research issues on
mineralization characteristics and the selection of mineral resource
assessment (MRA) models are not thoroughly studied. To elucidate
the characteristics of lode gold occurrences; especially to select the
appropriate models for mineral resource assessment and reserve
calculations, forming a basis for the exploration and exploitation
periods os a necessary task. The disertation “Research on the selection
of mineral resource assessment models for lode gold ores at Phuoc
Son area, Quang Nam province” is prepared from actual requirements
of mining activities in study area.
2. Objectives of the study: To study the characteristics of
mineralization zone of lode gold in Phuoc Son area; To select resource
assessment models for lode gold ores and associated minerals, as a
contribution to exploration methods using newly developed scientific
and technological advances.
3. Objects and scopes of the study: The ore bodies and
mineralization zone of lode gold at Phuoc Son region, especially in the
Dak Sa area.
4. Research contents: Data collection, investigation of previous
studies and data analysis for geological and mineral resource
information.
Additional research material composition to elucidate the
characteristics of the original gold ore. Determine the partition base and
prospect base area Phuoc Son gold. Studies shed light on the nature and
characteristics of transformation parameters geological ore body serves
exploration, resource evaluation, gold reserves. Application of
geographic information system (GIS) software dedicated especially
Surpac 5.1 software to build a database, resource assessment, the
original gold reserves. Study selection model awareness mineralization
characteristics and change selected resource assessment methods,
appropriate reserves root Phuoc Son gold ore types.
2
5. Research methods: Collect, synthesize, geological data
processing of minerals; Additional research material composition of
ore; Building a database (the database) geological mineral form of
tables on the basis of Surpac software applications and databases in
GIS to manage digital map; The study used models: statistical (oneway and two-way), the structure function (Variogram), mine
geometry, geological cross-sections for modeling objects as the basis
for the research methodology selection resource prices, original gold
reserves; Research using the Kriging method, inverse distance
weighting to calculate reserves, resources and methodology
determined according to mineralization straight to forecast resource
undetermined.
6. Significance scientific and practical values:
- Scientific significance: the thesis contributes additional
evidence on a more comprehensive understanding of the material
composition of ore, mineralization characteristics and spatial
variations of the geological parameters of the original gold ore bodies
investigated Research; Contributing to complete exploration
methodology; Research focus is on selecting the appropriate model for
resource assessment, the original gold reserves.
- Practical significance: to give managers and enterprise database
geological mineral Phuoc Son Gold root zone to ensure reliability, the
references in the search and navigation, exploration and mining;
Provide production base methodology to enhance the reliability of
resource assessment, reserve; Selecting the appropriate network probe
with original style Phuoc Son gold ore and other areas where
geological conditions similar minerals.
7. New achievements of the disertation:
- Phuoc Son Gold of the original style quartz - sulphide
polymetallic - typically yellow, two-stage mineralization with
complex symbiosis is characterized mineral quartz - pyrite II - the first
gold and quartz - pyrrhotite II - Gold II - galena - sphalerite (possible
electrum);
- Content of Au and associated elements (Ag, Pb and Zn) in the
root zone of gold ore bodies may inductive study of the standard
3
logarithmic distribution function, we have the relationship between
correlated from relatively tight to close tightly.
- Characteristics of Au transformed space can function modeled by
model type bridge structure, Au concentrations have local variability
and weak anisotropy, can basically see as isotropic in space. This feature
is the scientific foundation for network exploration using squares and
equilateral triangles, rhombus.
- The results of the study with the help of software Surpac
Vietnam confirmed the superiority of the model structure and function
Kriging method in resource assessment, the original gold reserves
Phuoc Son.
- The study results suggested resource assessment process, the
original gold reserves Phuoc Son ensure reliability, utility and mining
exploration.
8. Theoretical points of dissertation:
Thesis 1: Using modeling solution components reflected by the
quality of the original gold complex statistical models (onedimensional, two-dimensional) structure and function (Variogram) has
contributed to a more comprehensive awareness of mineralization
characteristics; Au content in two dimensions (in strike and dip of ore
body) local variation, weak anisotropy, can be considered as isotropic.
This is a scientific foundation for network application suitable for ore
exploration area Phuoc Son gold original.
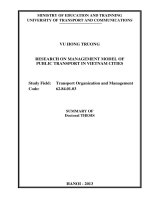
Thesis 2: Resource Assessment, the original gold reserves
according to the research proposed in the thesis (Figure 2:11); Kriging
method which is key to ensure the reliability and utility for use in
planning material exploration and mining.
9. Basis Document
The work geologic mapping area ratio 1:200.000, 1:50,000;
Report the results of exploration, gold mining and the original
subdivision Bai Bai Dat Type the Phuoc Son; Documents in the
thematic studies, surveys, original gold exploration in the region; The
resources of gold and foreign origin.
10. Place this research
4
The thesis was completed at the Department Search and
Exploration, Department of Geology, University of Mining and
Geology under the scientific guidance of Prof. Truong Xuan Luan,
Prof. Nguyen Phuong. NCS is pleased to express deep gratitude for
the guidance and help of the dedicated science instructor. NCS
received attention, facilitated by the Department of exploration,
backroom University, University of Mining and Geology, Office
Leadership Board of Assessment national mineral reserves. The
teachers, scientists in and outside the University of Mining and
Geology. NCS would like to express gratitude!
CHAPTER 1
OVERVIEW OF THE STUDY AREA
1.1. STRUCTURAL CHARACTERISTICS OF REGIONAL
GEOLOGY PHUOC SON
1.1.1. Position in the scheme of the study area structure
Phuoc Son region has an area of approximately 100km2, located
north of Kontum massif, terrane of South Asia Ngai.
1.1.2. History of geological and mineral research
- Before 1975: Geological studies document the left is a
representative profile Fromaget, JH Hofet (1933-1941), La Croix A,
Tran Huynh Anh (1932-1968).
- After 1975: Works geological mapping and mineral ratio of
1:500.000 Tran Duc Luong and Nguyen Xuan Bao co-editor (1976).
Geological and mineral maps Bana ratio 1:200.000 sheets are vetted
Nguyen Duc Thang 2006; The East team to Tam Ky - German
Association of Koliada A. A et al (1990); A group of northern forms of
Bui The Vinh Hoi et al (2011); To the south is the newspaper group Dak
Glei - Do Kham Duc Van Chi et al (1997).
The search for the 1:10,000 scale gold Phuoc Son has done in 7
areas: Banana Beach, K7, Longjing Tea - Spring Tree, Butterfly
Beach, Golden Light, Wind and Mountain Gold Beach. Sa Dak area
has been explored.
1.1.3. An overview of the stratigraphy
NCS uses geological map scale 1: 25,000 of Le Van Hai et al,
combined with vetted results geological and mineral maps 1:200.000
5
sheets Bana rate of Nguyen Duc Thang et al, topographic maps
mineral ratio 1:50,000 sheets A group of Bui The Vinh Hoi et al
include the following formations:
+ Kham Duc Formation, middle tier module (PR2-3kd2) consists of
quartz-biotite schist, quartz-chlorite, quartz-biotite schist containing garnet.
+ Breast Mountain Formation, the upper sub (PR3-€ 1nv2)
occupies the largest area distribution center in the study area.
Lithological composition includes quartz schist - biotite, actinolite albite, actinolite - chlorite, limestone and shale of lime blossom. The
rocks are strongly modified, common slope angle 30-500. During the
oral argument breaks, fractures of the quartz schist - biotite,
calcareous shale, distribution of ore bodies of gold polymetallic
sulfide quartz vein, network circuit, circuit lens. Thickness of about
1,300 meters floor modules.
+ A Great Formation (€ 2-O1av) consists of schist quartz - biotite,
quartz - biotite-chlorite, sericite - quartz, slate coal-rich material.
1.1.4. Overview of intrusive
Mainly granodiorit, granite - biotite phase 2 complexes Ben
Giang - Que Son distributed in the west of the original gold-related
areas, less than olivinit rock, pyroxenite Hiep Duc complex, in
addition to the majority circuit unknown age.
1.1.5. An overview of structural features, tectonic
The west fault Kham Duc, Dak Po Ko, K7, K7 which faults and
anticlines Song Giang distribution of quartz - sulphide polymetallic gold on the southwest side. These are favorable conditions for root in
the area, looking for gold.
In a nutshell: the Phuoc Son geological structure complicated,
distributed mainly metamorphosed sedimentary Breast Mountain
Formation, upper level modules. The sulfide ore bodies of gold in quartz
schist quartz - biotite, alternating calcareous shale files related to
faulting K7 and distribution wing Giang River anticline. This is the basis
of delimitation, the area of the original gold prospects in the region.
1.2. Features gold mineralization awkward angle Phuoc Son
8 areas identified primary gold ore distribution includes: Dak Sa,
Banana Beach, K7, Longjing Tea - Spring Tree, Butterfly Beach,
6
Golden Light, Wind and Mountain Gold Beach. In which the Dak Sa
has been explored in two zones (2 mines), the other new zones
meticulous search.
1.2.1. Characteristics of the mineralization zone
The gold mineralization zone containing the main northeast southwest, longitude, northwest - southeast, length 200 - 1,500 mm,
width 5 - 30 m depth is estimated at 45 - 100m. On the Au: 0.1 to 98.16
g / t; deep, Au: 0.1 to 69.7 g / t, averaging 0.5 to 3.27 g / T.
1.2.2. Characteristics of ore bodies
Sa Dak region, including two sub-areas and grounds timber yard
- Beach Land Division Main orebody (BDMQ) accounting
reserves mainly in zones, quartz schist in practice - biotite. Small ore
bodies (BDUQ) located on a thickness small, discontinuous
distribution, of little value.
- Classification Type Beach area have been 6 beam control
including SERP itself, BGUQ, SC2, MB2, BGLQ, QTZ4 and 02
single body SC3, MB1. In particular ore body QTZ3 (under the beam
itself BGLQ) accounts for the reserves in subdivisions distributed in
quartz schist episode - biotite calcareous shale alternating sets.
Comment: in the Dak Sa, the original gold ore bodies form circuits,
network circuits, circuit lenses, fill the cup surface layer of the developing
northeast - southwest, is the less than or west longitude north - SE. Part of
the wall is often distributed collection of flowers limestone, calcareous
shale alternating quartz schist episode - biotite, usually cylindrical quartz
schist - biotite, the boundary between the rocks surrounding the ore body
is relatively clear.
1.2.3. Characteristics of material composition
The thesis focused research, describe, calculate parameters Sa
Dak mineralization zones, as the basis of interpretation of ore
characteristics and model selection evaluation resources reserve.
- Mineral components: Beach Land subdivision mainly
pyrrhotite, pyrite, galena, sphalerite and native gold (electrum can be)
filled cracks form, accounting for 1 ÷ 65%. In that little sphalerite
from 50% to 12% less galena, pyrite from less to 2%, from less than
1% pyrrhotite; Subdivision consisting of pyrrhotite timber yards,
7
pyrite, sphalerite, galena and native gold (electrum can be); total
sulfide minerals 2 ÷ 15%, locally up to 45%.
+ Main mineralogical characteristics: native gold (Au) exist are
varied and plentiful including 2 generations scattered disseminated in
quartz; IC form filling cracks; and disseminated sphalerite and gelenit
(image 1.3, 1:16). Gold particle size from 0.01 to 0.2 mm, from
relatively isometric (photo 1.3) to the distorted grain (photo 1.5) or
granular particles to form larger neighbor (photo 1:16), in the form
spontaneous encounter Au system flat contact with galena, sphalerite
(Image 1.3); with galena, sphalerite and pyrite II (picture 1:16).
Photo 1.3. Model LV1, floor furnace 1, China BDMQ. Native
gold, isometric particles in contact with galena and sphalerite Picture
Flat 1.5. Model LV2-2, 2-story fireplace, China BDMQ. Extends native
gold grains disseminated in accordance with the microchip micro cracks
1:16 Picture: BG 7.3 (oven 1) China QTZ3, native gold (Au) (≈ 0.2 mm)
created THCSKV with sphalerite, galena, pyrrhotite II
Non-ore minerals are mainly quartz, dolomite, calcite (less
sericite and chlorite).
- Chemical composition of ore
+ Key Element
In the mineralization zone, on the Au concentration: 0.1 to 98.16
g / T (K7); deep Au: 0.1 to 69.7 g / T; zone average 0.5 to 3.27 g / T.
In Au grade ore bodies BDMQ: 0.13 ÷ 76g / t (sample handling
characteristics were high), average 18.65 g / t; levels of change are
extremely uneven (Vc = 267%); QTZ3 relative Au concentration: 0.11
÷ 48g / t (sample handling characteristics were high), average: 9.57 g /
T; levels of change are extremely uneven (Vc = 206%).
+ The accompanying elements including Ag, Pb and Zn recovery value.
- Composition characteristics, architecture ore: in the main drive
form, fill cracks, chips form. The ore mineral particles to form larger tha
picture, particle lasts, sometimes relatively isometric particles, angular.
- Mineral Complex symbiotic stage mineralization
In the region there are 3 main stages of ore formation; with the
mineralogical characteristics:
8
Stage 1: quartz, pyrrhotite I, pyrite I;
Stage 2: quartz, pyrite II, gold I;
Stage 3: quartz, pyrrhotite II, II gold, galena, sphalerite (possible electrum).
In this present gold mineralization in two phases 2 and 3.
- Feature change surrounding rocks
Transform ice thickness around 0.1 ÷ 0.3 m, disseminated gold at
low levels, fail to achieve the industry. Mineralization accompanying
phenomenon mainly of quartz, dolomite is less of goods and calcite.
Slate quartz - biotite quartz is the mineral of ore containing up to 10%
(Bai Dat and Bai Go), dolomite chemical, chemical calcite mineral ore
containing less than 2% of, (K7, Tra Long - Stream Tree) , chlorite
chemical (Long Tea - Spring Tree, Bai pump), sericitization
phenomenon is limited.
Picture 1:22. Quartz biotite schist are quartz ore Picture of 1:23.
Quartz biotite schist are quartz, dolomite, chemical, ore 1:24 Image.
Of dolomite rock is talc, magnesite of disseminated ore
- Identify the source of the original gold ore
From the results of additional studies, combined with previous
literature (Tran Trong Hoa, Le Van Hai, Vinh Bui et al) allow to
draw: original gold zones Sa Dak derived average temperature
hydrothermal , medium low (300-1800).
1.3. DIVISION REGIONAL PERSPECTIVE
1.3.1. Establishments partition prospects
- Premise: is the collective slate quartz - biotite, calcareous shale
of Breast Mountain Formation, the upper sub; Phase 2 complexes Ben
Giang - Que Son; tectonic breccia zones related to faults and
anticlines K7 Giang River.
- Signs of search: the ore outcrop, handmade exploitation work,
the alteration zones of dolomite, quartz and calcite of goods;
Geochemical dispersion haloes of primary Pb, Zn and Ag, the boulder
zone containing sulfide minerals, geophysical anomalies.
1.3.2. Promising Results partition
Results were divided: very promising area (A) as follows: Sa
Dak area: 0.5 km2 (outside the area explored); Banana Beach: 0.112
9
km2; Tea - Spring Tree: 0.59 km2; Beach Wind: 0.13 km2; Prospect
area (B) include: parks K7: 0.173 km2; Butterfly Beach: 0.28 km2;
Light Gold 0.185 km2; The area of unknown prospects (C) is the Gold
Mountain: 0.16 km2.
CHAPTER 2
STUDY METHOD AND MODEL SELECTION FOR NATURAL
RESOURCES, RESERVES ACCESSMENT
2.1. Overview geochemical, mineralogy characteristics and types
origin of industrial gold mine
Gold mineralogy is quite simple, native gold and tellus gold has
main industrial value. Most native gold contains impurities such as
Ag, Cu and Fe; sometimes Bi, Pd and Rd.
Gold has main industrial value includes: high-temperature
hydrothermal; average temperature hydrothermal; low temperature
hydrothermal; The helmet of the sulfide deposits; Mine type
metamorphic origin conglomerate contains gold.
2.2. Study Methods
2.2.1. To survey, collect, synthesize material: geological route in lines
associated with exploration and exploitation, establishing the additional
detail sections at the Dak Sa area.
2.2.2. Studying on building database of geological minerals including: digital
database tables; Database of geographical information systems (GIS).
2.2.3. Modelling
- The concept of modelling: Modelling is a solution to study,
search, test and evaluate with the purpose of understanding,
interpretation, prediction and selection of mineral explore and
exploration methods. Mines model or the critical features of the
mineral deposits are usually done by the method of inductive or
simulation. Products of the modeling process can be a specific pattern
observed with the naked eye (resolution map blocks, the plan, section,
etc.) or inductive model as a mathematical formula (abstract model).
- The model:
+ Model based on mine geometry theory includes: To geometrize
the features of ore body, analysis Trend and model the two-way or
10
three-way Fourier series. The dissertation uses geometric patterns
mining (contours) for modeling orebodies.
+ Statistical model includes: One-way, two-way and multi-way to
determine the statistical distribution laws, the statistical characteristics
and the relationship between the elements in the ore body.
+ Mathematical model based on the theory of stochastic
processes including: content structure, linear algebra theory,
autocorrelation analysis, wave analysis harmonic oscillator.
Postgraduate focus on studying structure function model (Variogram).
Structure function model (h): to guide on interpreting
exploration network, layout exploration works, sampling and help to
choose shape and size of block for resources reserves assessment by
Kriging methods. The theoretical models can be spherical,
exponential, Gauss, hole effects, etc.
Variogram is not only the unit of change measure, but also shows
clearly structural properties and spatial variations of the studied
parameters, is the key to perform the Kriging methods in particular
and geo-statistical methods in general. In geostatistics, some authors
also considered Variogram as a basis for calculating and
decentralization (reliability) resource reserves.
2.2.4. Method of Mineral resource reserves Assessment
- Method of forecast undetermined-resource
Forecast value of area; Forecast for a region or specific area with
similar approach; Estimating the abundance of regional natural
resources based on empirical formula; forecast mine type according to
area with certain reliability; Professional method; Aggregate forecast
regional links; Calculation method based on the straight vertical
mineralization parameters.
- The method of calculating identified resources reserves
Geological block method; Geological cross-sections; exploitation
Block; Polygons; Triangles; Inverse distance weight, Kriging. The
thesis uses Kriging method, inverse distance weighting and geological
block method (for comparison).
Common Kriging method known as Kriging unknown average value,
based primarily on the theory of stable random function (stop) really.
11
Today, with the help of computers, geostatistical methods are
considered as key method in spatial forecasting. The method has
closely algorithmic, ability to forecast reliability, is not affected by the
shape, size of probe network, overcoming the drawbacks that other
methods can not calculator such as remove the local errors in
calculation. Input data volume is large enough, the result is high
reliability; on the other hand the method also shows the error in
calculation according to the Kriging variance. By Kriging we could
calculate reserves, resources each block of small size even if no work
in block, and very useful for design mining engineering, mining
directing, supporting for the other methods such as establishing
contour maps, etc.
2.2.5. Research Surpac software application
5.1 Surpac software to handle geological data, modeling ore
body and calculator resource reserves of deposit.
Design, establishment and database management geology mining, modeling and evaluate original gold resources reserves.
2.3. Select model and method for resources and reserves original
gold accessment in Phuoc Son area
2.3.1. The factor affect model sellection
Factors of mineralization controlling; shape, size of ore bodies;
distribution of beneficial components in the ore body; shape
exploration networks affect model selection.
2.3.2. Select model
+ The search: document is preliminary, Postgraduate use
vetically calculation method based on mineralization parameters for
forecasting Au resource, correlation function model (regression) to
predict useful accompanied element (Ag, Pb and Zn).
+ The exploration zone
* Controlling mineralization factor: Bai Dat zone, the main ore
body (BDMQ) distributes in the surface separated-layers of shale
quartz - biotite. Bai Go zone, QTZ3 ore body distributes in the surface
separated-layers of quartz - biotite shale, calcareous shale.
* Ore body shape and size: BDMQ ore body extends to the
north-east - south-west about 250m, plug direction to the Northwest
12
120 - 300 m, average slope angle of about 30°, the variation
coefficient of contour perimeter is 1.23, type of simplified. QTZ3 ore
body extends to the NNE - SSW 450m, plug direction to the west northwest of 1,200 m, with an average slope angle of 35o, the variation
coefficient of contour perimeter of 1.62, kind of complicated.
* The distribution of beneficial components in ore body: BDMQ
body has Au ore grade: 0.13 - 76g / T (solid samples have done),
especially distributed unevenly (Vc = 267%); Au content of QTZ3 ore
body: 0.11 - 48g / T (solid samples have done), distributed very
unevenly (Vc = 206%).
* Shape exploration network: Drilling construction works is not
follow a geometric network. Probe network equivalent to route by
route about of (30 - 50) m and work on route is of (30 - 50) m.
Based on the analysis of related geological factors and
mineralization control, relationships between the mineralization with
surrounding rocks, shape, size, variation characteristics and the
distribution of useful components, exploration system and the
advantages and disadvantages of each model as described in the
thesis, it is best to use the model to coordinate the geological section,
mine geometry, statistics math, and structure function with structure
function model is a key function.
2.3.3. Factor affecting select evaluation method for resources, reserves
The factors of shape, size, ore body lying; the distribution of
elements in the ore body; exploration system, mining systems affect
the selection of resources and reserves assessment method.
Geological cross method requires the exploration network have to
layout in route that in many cases difficult to implement in field,
canculating results is not exactly if the distances between the routes is
long or ore body changes. Geological block method does not depend on
how the layout of the probe work, but not favorable for ore body has
complex structure, sometimes is difficult in zoning off to ensure three
uniformity factors in volume calculated resource, reserves. Inverse
distance method can be applied if network probe is sparser than size of
influence zone and the ore body is isotropic. Kriging method almost
overcomes the disadvantages of the other methods, especially when a
13
number of exploration works is large enough and distances between the
works is smaller than the size of the affected zone (Hm).
2.3.4. Selecting assessment process of original gold resources and
reserves
Figure 2.11 Assessment process of origin Au resources, reserves
Studied object (TQ)
Approach to relevant document
Building geological-mineral database
CSDL ĐC-KS
Table
Map, Chart in GIS
Modelling ore body
Type model of
geological section
Statistical
model
Mine geometric
model
Identify
experimental
[(h)] in the
different direction
Structure function
model [(h)]
Selecting size of
affected zone,
isotropic,
anisotropic
Selecting size for mini-block, elipsoid
Selecting the method for calculating reserves and resources (Kriging, inverse
distance, etc.)
Result
14
CHAPTER 3
RESULT AND DISCUSSION
3.1.1. Data base of geological – the original gold mineral of study
region
- Table data base: Data of Terrain mining, borehole data (coordinates
of drill hole, stratigraphic drilling, drill sample results, drilling azimuth).
- Data base in GIS: To manage information layers in Mapinfo
and Autocad
3.1.2. Modelling characteristics of mineralization
- Geological section model: Establishment of the geological
section of ore bodies allows overview assessment about distribution
characteristics, the relationship between ore bodies and surrounding
rocks, it is the basis to implement of the next research.
- Isoline model: Based on sectional system was established to
formed the cylindrical framework, closure framework, equal thickness
framework by interpolation method (Kriging method is a key).
* BĐMQ orebody is controlled by 57 boreholes including 190
core samples which is analysis Au, Ag, Pb and Zn component, the
result is shown in table 3.6
(test the distribution model)
Table 3.6. The analysis result of the statistical characteristics of Au,
Ag, Pb and Zn content in TQ BĐMQ
Element
Au (g/T)
Ag (g/T)
Pb (%)
Zn (%)
Value sample
190
Min
0,13
0,1
0,0003
0,0001
Content
Max
197,55
438
29,3
28,87
Average
18,31
26,53
1,750
1,753
tA
tE
3,19
3,80
4,16
3,87
16,57
19,44
23,13
19,64
Comments: Both standard deviation of Au content |tA| = |A/A| and
normal kurtosis |tE|= |E/E| more than 3; frequency nomogram deviates
from the left. So it did not satisfy the normal distribution, the useful
elements Ag, Pb and Zn were similar.
Test the logarithmic distribution standard: By changing the initial
value to the logarithmic values for statistical processing. The synthesis results
is shown in Table 3.9
15
Table 3.9. Statistical characteristics of Au, Ag and Zn content
accroding to logarithmic distribution standard in TQ BĐMQ
Content
Element
Sample value
Au (g/T)
Ag (g/T)
Pb (%)
Zn (%)
190
Error of mean
square
Min Max Average
()
-0,88 1,88
0,83
0,63
-1,00 2,16
0,68
0,8
-3,50 1,00 -0,79
1,1
-4
1,00 -0,98
1,2
tA
tE
-0,09
0,18
-0,11
0,11
2,21
2,10
2,01
1,97
Table 3.9 shows that the standard |tA|<3 and |tE|<3; it allows
assessment that Au content in the BDMQ orebody complies with
logarithmic distribution standard. Similar results for Ag, Pb and Zn.
Distribution function
The density function f(x) which is presented formula (3.1),
distribution function (3.2) distributed Au content on BDMQ orebody
accroding to logarithmic standard.
1
f x
e
0,63. 2.
lg x 0 ,83 2
2.0 , 39
(3.1);
F ( ≤x) =
1
0,63. 2.
x
1
o xe
lg x 0,83 2
2.0 , 39
dx
(3.2)
Table 3.10. Statistical Au concentration on BDMQ orebody accroding
to logarithmic distribution standard model
Content (g/T)
element
Au
Min
Max
Average
Error of mean
square ()
0,13
76
18,65
32,25
Function of
variation
(V%)
267
Comment: The results calculated Au content compare with
calculated results of exploration report in 2010 (averaged according to
single sample Au= 18.31 g/T) wtih error +0.34 g/T, equivalent to 1,86%.
+ QTZ3 orebody is controlled by 56 boreholes with 252 samples
which is analysis Au, Ag, Pb and Zn content.
Test the distribution model: Statistical distribution model of Au
concentrations similar to the BDMQ orebody
Table 3.11. the statistical characteristics of Au, Ag, Pb and Zn
content in TQ QTZ3
Sample
Content
Element
tA
tE
value
Min
Max Average
16
Au (g/T)
0,11
206
10,34
5,62 49,80
Ag (g/T)
0,10
254
17,38
3,22 13,99
252
Pb (%)
0,0006 22,6
1,36
3,10 14,08
Zn (%)
0,0004 3,76
0,099
6,40 51,65
Table 3.11 shows that Au, Ag, Pb and Zn content has distribution
standard |tA|>3 and |tE|>3; frequency nomogram deviates from the
left. So it did not satisfy the normal distribution.
Test the logarithmic distribution standard:
Table 3.14. Statistical characteristics of Au, Ag and Zn content
accroding to logarithmic distribution standard in TQ QTZ3
Content
Element
Error of mean
square
Sample value
Min
Au (g/T)
Ag (g/T)
Max Average
tA
tE
()
-0,88 1,88
0,83
0,63
-0,09
2,21
-1,00 2,16
0,68
0,8
0,18
2,10
-3,50 1,00
-0,79
1,1
-0,11
2,01
-0,98
1,2
0,11
1,97
190
Pb (%)
Zn (%)
-4
1,00
Table 3.14 shows that the standard of Au, Ag and Pb conten is
|tA|<3 and |tE|<3; it allows assessment that Au, Ag, Pb content in the
QTZ3 orebody complies with logarithmic distribution standard, Zn
content is |tE|=3,39>3; however standard deviation is small maybe
consider logarithmic distribution standard.
Distribution function
The density function f(x) of Au content accroding to logarithmic
standard is presented formula (3.3), distribution function (3.4):
1
f x
e
0,56. 2.
lg x 0 , 62 2
2.0 , 32
(3.3);
F( ≤x) =
1
0,56. 2.
x
1
o xe
lg x 0 , 62 2
2.0 ,32
dx
(3.4)
Table 3.15. Statistical Au concentration on the TQ QTZ3 orebody
accroding to logarithmic distribution standard model
Content (g/T)
element
Au
Min
Max
Average
Error of mean
square ()
0,11
48
9,57
48,5
Function of
variation
(V%)
206
17
The results calculated Au content compare with calculated
results of exploration report in 2010 (averaged according to single
sample Au= 10,35g/T) wtih error -0,87g g/T, equivalent to 7,5%.
Comment: The research results of One-dimensional
mathematical statistics shown Au content and of accompanying
elements in the orebodys in Dak Sa area consistent with the
logarithmic distribution standard, in accordance with the law of
distribution of content mineral rare.
- Two-dimensional statistical model: In the BDMQ orebody, Au is
related closely with Ag, Pb and Zn. In addition, there is also a positive
correlation between Ag and Pb, Ag and Zn, Pb and Zn which is very
close. In the QTZ3 orebody, Au is related closely with Ag, Pb and is
related weakly with Zn; Ag is related very closely with Pb and is related
closely with Zn; Pb is related very closely with Zn.
General Comments: Basically, Au and accompanying elements
(Ag, Pb and Zn) have correlated pretty closely, however that
relationship has a little the differences between the two orebodies.
Initially we can use the regression functions which is built to forecast
resource accompanying elements in the study area.
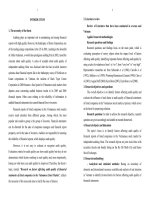
- Structure function model γ(h)
+ The BDMQ orebody
Starting from 2900 strike with the scan angle is 450; the next strike
will be 3350, 200, 650 to 1100 strike. Postgraduate carried out to survey
half (½) hemisphere (the equivalent of 4 strikes), left hemisphere have
similar values. The input values which have been converted to the lg(x)
value. The results are shown in Figure 3:27. Postgraduate has
calculated many different methods to choose the optimal method.
18
Figure 3.27. The survey results of
Figure 3.31. The survey results of
0
Variogram according to the 290 strike Variogram according to the 2800 strike
in the BDMQ orebody
in the QTZ3 orebody
Table 3:22. Table synthetic survey results of Variogram in the
BDMQ orebody
parameters characteristics of (h)
Survey
Sill
Size of
method Autofining
(and
influence
(degree)
effects
nugget) zone (m)
290
0,28
1,03
60
Model
h
h3
(h) 0,28 0,75(1,5 0,5 3 ) if h≤ 60
60
60
= 0,28+0,75=1,03
if h>60
3
335
0,40
0,90
65
(h) 0,40 0,50(1,5
h
h
0,5 3 ) if h≤ 65
65
65
= 0,40+0,50=0,90
if h>65
3
20
0,53
1,21
70
(h) 0,53 0,68(1,5
h
h
0,5 3 ) if h≤ 70
70
70
= 0,53+0,68=1,21
if h>70
3
65
0,5
0,99
65
(h) 0,5 0,49(1,5
h
h
0,5 3 ) if h≤ 65
65
65
= 0,5+0,49=0,99
if h>65
+ The QTZ3 orebody
Starting from 2800 strike with the scan angle is 450; the next strike
will be 3250, 100, 550 to 1000, left hemisphere have similar values (The
results are shown in Figure 3:27).
Comment: The QTZ3 orebody, structure functions have autofining
effects and circle model which shows that special variation is not
uniform, the most complex according to northwest - southeast direction
19
(100-2800) nearly coincides with azimuth of slope; simpler according to
northeast – southwest direction (10-1900) nearly coincides with the strike
of orebody; expression of local variation, anisotropic hole and weak
anisotropy (anisotropy index 1.4); can be interpolated the ore body
accroding to slope within from 50 to 55m; 55-70m along the strike; circle
model be used to to determine the size of impact zone, the size of the
micro block, Kriging method is executed to calculate reserves, resources.
Table 3.27. Table synthetic survey results of Variogram in the QTZ3 orebody
parameters characteristics of (h)
Survey
Size of
method Autofining Sill (and
influence
(degree)
effects
nugget)
zone (m)
280
0,15
0,81
50
Model
(h) 0,15 0,66(1,5
h
h3
0,5 3 ) if h≤ 50
50
50
= 0,15+0,66=0,81
if h>50
3
325
0,16
0,103
55
(h) 0,16 0,87(1,5
h
h
0,5 3 ) if h≤ 55
55
55
= 0,16+0,87=1,03
if h>55
3
10
0,01
0,72
70
(h) 0,01 0,71(1,5
h
h
0,5 3 ) if h≤ 70
70
70
= 0,01+0,71 =0,72
if h>70
3
55
0,15
1,12
55
(h) 0,15 0,97(1,5
h
h
0,5 3 ) if h≤ 55
55
55
= 0,15+0,97=1,12
if h>55
General Comments: From the Variogram survey results of the
BDMQ orebody and the QTZ3 orebody given mineralization
characteristics of Au element as follows:
1. Au content on the BDMQ orebody shown no clearly
anisotropy, anisotropy coefficient = 1.17 (long axis of ellipsoid
extending to 200 strike, short axis accroding to 2900 strike). The QTZ3
orebody have weakly anisotropy with anisotropy coefficient Idh = 1.4
(long axis of ellipsoid extending to 100 strike, the short axis extending
to 2800), can be considered isotropic.
2. Intensity mineralization of the orebody is quite high. Intensity
mineralization of the BDMQ orebody is higher Intensity mineralization
of the QTZ3 orebody with the demand curve conversion coefficient
ranging from 0.49 to 0.75; the QTZ3 orebody with the demand curve
conversion coefficient ranging from 0.66 to 0.97.
20
3. BDMQ orebody have high autofining effects, Co: from 0.28 to
0.53, QTZ3 orebody have low autofining effects, Co: from 0.01 to
0.16. Abiogenesis gold and high gold content on the BĐMQ orebody
is larger abiogenesis gold and high gold content on the QTZ3
orebody. That is consistent with mineralization in the orebody study,
ore erasable, micro vein, infilling fractures in quartz vein.
4. All of variogram presents hole effects and local variation,
indicated gold mineralization at the Dak Sa has least two - mineralization
stages, consistent with the analysis of mineralography samples.
- Apply structure function model on calculating reserves and
resources by setting ellipsoid.
+ BDMQ Ore Body: Based on the survey results of the models
(h), identify the main axis (major - axis) nearly coincides with the
strike of ore body, direction 20-2000, size is of 70m, secondary axis
(semi major - axis) nearly coincides with the pitch of the ore body,
direction 290 - 1100 with a size of 60 meters, the shortest axis (minor axis) coincides with the thickness of the ore body.
+ QTZ3 Ore Body: The main axis nearly coincides with the
strike of ore body, direction 10-1900 is of 70m, the secondary axis
nearly coincides with the pitch of the ore body, d irection 280-1000 is
of 50m, the short axis coincides with the thickness of the ore body.
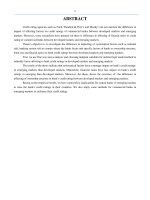
3.1.3. Assement of reserves and identified resources
- Kriging Method
Steps to solve Kriging problem and choice size for mini-block
logically are explained in detail in the thesis.
Fig 3.42a. Chart of Kriging
interpolation results for Au
content TQ BDMQ
Fig 3.43a. Chart of Kriging
interpolation results for Au
content TQ QTZ3
Fig 3.43
Legend
21
Reserves and resources of Au calculated by Kriging method for ore
bodies BDMQ and QTZ3 is total of 14,660 kg Au (detail in table 3:31).
- Method of inverse distance weighting
Reserves and resources of Au calculated by the inverse distance
weighting method for ore bodies BDMQ and QTZ3 is total of 14.279
kg Au (detail in table 3:34).
Table 3:31. Calculation result of Au reserves and resources using
Kriging method
Reserves and
resources
level
122
BĐMQ
333
Total
122
QTZ3
333
Total
Ore
body
Ore reserves and
resources
(tonnes)
213.824
244.434
458.258
232.334
1.029.614
1.261.948
Au average
content
(g/T)
14,61
9,99
7,81
7,07
Au reserves
and resources
(kg)
3.124
2.442
5.566
1.815
7.279
9.094
Table 3:34. Calculation result of Au reserves and resources using
inverse distance weighting method
Reserves and
resources level
122
BĐMQ
333
Total
122
QTZ3
333
Total
Ore body
Ore reserves and
resources (tonnes)
213.379
169.577
382.956
232.312
1.047.788
1.280.100
Au average
content (g/T)
15,1
10,51
7,72
7.14
Au reserves and
resources (kg)
3.222
1.782
5.004
1.793
7.481
9.275
- Geological block method
Table 3:35. Results of calculated Au reserves and resources
using Geological block method (Le Van Hai et al, 2010)
The result listed in Table 3:35 was approved by the National
Council on evaluation of mineral reserves in 2010. Therefore,
Postgraduate did not recalculate but using the result as the reference
for comparison with the proposed method.
3.1.4. Forecast undetermined resources
Using the vertical caculation method based on mineralization
parameters to forecast for the region need to explore meticulously. The
22
result show that predicted resources is about 22,932 kg Au; Using the
correlation function (regression) predicted for Ag: 20,668 kg, Pb: 381
537 tons and Zn: 368 182 tons in the remaining areas including Bai
Chuoi, B, K7, Bai Gio, Tra Long – Suoi Cay, Vang Nhe and Bai Buom.
3.1.5. Results comparison
- Compared with the 6-122 block mining results
Table 3:40. The table compares the results calculated reserves to
the results 6-122 block mining TQ BDMQ
Reserves
block
Result
6-122
Khai
thác
Comparation
parameters
The error between the methods (%)
Inverse distance Geological
Kriging
weighting
block
Reserve (tons)
-2,00
-2,07
+6,941
grade (g/T)
+0,70
+2,60
+5,66
Notes: - decrease; + increase compare with 6-122 block
Comparing result in Table 3:40 show the ore reserves and Au
content calculated by Kriging method has the smallest error.
Comparing the results calculated by Kriging method with geological
block for all reserves blocks at 122 level, reserves error in the blocks
range from 0.3 to 18.5%, an average of about 4%.
- Comparing the sections
Compare AA’ section made from the results of exploration and
exploitation of TQ BDMQ shows that basically the shape of ore
bodies is similar; Exploiting result discovered 01 small tranform
zones, however, does not affect the form of the ore body; According
to the result of expldoration and result of exploitation, the area of the
ore body on the AA' section is different about 6%.
Conclusion: In order to fully understand the variation
characteristics of primary gold mineralization, it is best to use
statistical model (one-way, two-way), and mine geometric model and
structure function model, focus on structure function model. Using
Kriging method, distance inverse weighting; focus on Kriging to
evaluate resources and reserves and vertical calculation method
according to mineralization parameters to forecast original gold ore
resource in Phuoc Son area to ensure reliability.
3.1.6. Orientation for exploration network and development
of mines
23
According to geologists, to ensure reliability can probe the
ore bodies in Dak Sa area according to networking = (2/3) Hm
(Hm, influenced size):
Table 3:45. exploration Network is based on survey results
Variogram
Ore body
Strike (m)
Pitch (m)
BĐMQ
40-50
40-45
QTZ3
35-50
30-35
Table 3:46. Exploration Network convert to square network
Ore body
Strike (m)
Pitch (m)
BĐMQ
40-47
40-47
QTZ3
32-41
32-41
3.2. DISCUSSION
1. Regard to rare minerals, in addition to applying a statistical
model to use the structure function model, allowing full understand
the variation, affect size, anisotropy, isotropic of the parameters of
orebody to interpreter exploration network, and applying Kriging on
resources, reserves assessment.
2. Kriging method should be applied as a key method in
assessing resources, reserves; particularly for rare minerals.
CONCLUSIONS AND RECOMMENDATIONS
1. Conclusions
1.1. Phuoc Son region located in the north of Kontum block,
belongs to Nam Ngai area. Region has complex geological structures,
distributed mainly metamorphosed sedimentary of Nui Vu formation,
upper sub-layer and intrusive phase 2 of Ben Giang - Que Son
complex. In contact position of metamorphosed sedimentary of
formations Nui Vu and intrusive of Ben Giang - Que Son complex
distributes the quartz - sulfide polymetallic - gold ore bodies.
1.2. The original gold ore bodies in Phuoc Son are mainly the
vein, circuits network, circuits lens, distributed in the separated-layer
of quartz - biotite shale, calcareous shale of formations Nui Vu, the