Chapter 12: Finite element programming with MALTAB
Bạn đang xem bản rút gọn của tài liệu. Xem và tải ngay bản đầy đủ của tài liệu tại đây (437.54 KB, 58 trang )
Chapter
12
Finite Element Programming with
MATLAB
Chapter 12 includes a general introduction to MATLAB functions, selected topics in
linear algebra with MATLAB, and a collection of finite element programs for: trusses
(Chapter 2), general one-dimensional problems (Chapter 5), heat conduction in 2D
(Chapter 8) and elasticity in 2D (Chapter 9). This Chapter is published electronic format
only for several reasons:
1. the data structure of the finite element program will be periodically updated to
reflect emerging finite element technologies and MATLAB syntax changes;
2. to allow the course instructors to use their own MALAB or other finite element
codes.
3. to create a forum where students and instructors would exchange ideas and place
alternative finite element program data structures. The forum is hosted at
/>
12.1 Using MATLAB for FEM1
12.1.1 The MATLAB Windows
Upon opening MATLAB you should see three windows: the workspace window, the
command window, and the command history window as shown in Figure 12.1. If you do
not see these three windows, or see more than three windows you can change the layout
by clicking on the following menu selections: View → desktop layout → default.
1
May not be covered in the class. Recommended as independent reading.
Figure 12.1: Matlab Windows
12.1.2 The Command Window
If you click in the command window a cursor will appear for you to type and enter various
commands. The cursor is indicated by two greater than symbols (>>).
12.1.3 Entering Expressions
After clicking in the command window you can enter commands you wish MATLAB to execute.
Try entering the following: 8+4. You will see that MATLAB will then return: ans = 12.
12.1.4 Creating Variables
Just as commands are entered in MATLAB, variables are created as well. The general
format for entering variables is: variable = expression. For example, enter y = 1 in the
command window. MATLAB returns: y = 1. A variable y has been created and assigned
a value of 1. This variable can be used instead of the number 1 in future math operations.
For example: typing y*y at the command prompt returns: ans = 1. MATLAB is case
sensitive, so y=1, and Y=5 will create two separate variables.
2
12.1.5 Functions
MATLAB has many standard mathematical functions such as sine (sin(x)) and cosine
(cos(x)) etc. It also has software packages, called toolboxes, with specialized functions
for specific topics.
12.1.6 Getting Help and Finding Functions
The ability to find and implement MATLAB’s functions and tools is the most important
skill a beginner needs to develop. MATLAB contains many functions besides those
described below that may be useful.
There are two different ways obtain help:
• Click on the little question mark icon at the top of the screen. This will open up the
help window that has several tabs useful for finding information.
• Type “help” in the command line: MATLAB returns a list of topics for which it has
functions. At the bottom of the list it tells you how to get more information about a
topic. As an example, if you type “help sqrt” and MATLAB will return a list of
functions available for the square root.
12.1.7 Matrix Algebra with MATLAB
MATLAB is an interactive software system for numerical computations and graphics. As
the name suggests, MATLAB is especially designed for matrix computations. In addition,
it has a variety of graphical and visualization capabilities, and can be extended through
programs written in its own programming language. Here, we introduce only some basic
procedures so that you can perform essential matrix operations and basic programming
needed for understanding and development of the finite element program.
12.1.8 Definition of matrices
A matrix is an mxn array of numbers or variables arranged in m rows and n columns; such
a matrix is said to have dimension mxn as shown below
a11 a12 L a1n
a
a22
a = 21
M
O
a
a
mn
m1
Bold letters will denote matrices or vectors. The elements of a matrix a are denoted
by aij , where i is the row number and j is the column number. Note that in both
describing the dimension of the matrix and in the subscripts identifying the row and
column number, the row number is always placed first.
An example of a 3x3 matrix is:
1 2 3
a = 4 5 6
7 8 0
3
The above matrix a is is an example of a square matrix since the number of rows and
columns are equal.
The following commands show how to enter matrices in MATLAB (>> is the
MATLAB prompt; it may be different with different computers or different versions of
MATLAB.)
>> a = [1 2 3; 4 5 6; 7 8 0]
a=
1
2
3
4
5
6
7
8
0
Notice that rows of a matrix are separated by semicolons, while the entries on a row are
separated by spaces (or commas). The order of matrix a can be determined from
size(a )
The transpose of any matrix is obtained by interchanging rows and columns. So for
example, the transpose of a is:
1 4 7
a = 2 5 8
3 6 0
T
In MATLAB the transpose of a matrix is denoted by an apostrophe (‘).
If aT = a , the matrix a is symmetric.
A matrix is called a column matrix or a vector if n=1, e.g.
b1
b = b2
b3
In MATLAB, single subscript matrices are considered row matrices, or row vectors.
Therefore, a column vector in MATLAB is defined by
>> b = [1 2 3]'
b=
1
2
3
Note the transpose that is used to define b as a column matrix. The components of the
vector b are b1, b2 , b3 . The transpose of b is a row vector
4
bT = [b1 b2
b3 ]
or in MATLAB
>> b = [1 2 3]
b=
1
2
3
A matrix is called a diagonal matrix if only the diagonal components are nonzero,
i.e., aij = 0, i ¹ j . For example, the matrix below is a diagonal matrix:
1 0 0
a = 0 5 0
0 0 6
A diagonal matrix in MATLAB is constructed by first defining a row vector b = [1 5 6],
and then placing this row vector on the diagonal
>> b = [1 5 6];
>> a = diag (b)
a=
1
0
0
0
5
0
0
0
6
A diagonal matrix where all diagonal components are equal to one is called an identity or
unit matrix and is denoted by I. For example, 2 ´ 2 identity matrix is given by
1 0
I =
0 1
The MATLAB expression for an order n unit matrix is
eye(n )
Thus, the MATLAB expression I = eye(2) gives the above matrix.
A matrix in which all components are zero is called a zero matrix and is denoted by 0. In
MATLAB, B = zeros (m, n) creates m ´ n matrix B of zeros. A random m ´ n matrix can
be created by rand (m,n).
5
In finite element method, matrices are often sparse, i.e., they contain many zeros.
MATLAB has the ability to store and manipulate sparse matrices, which greatly increases
its usefulness for realistic problems. The command sparse (m, n) stores an m ´ n zero
matrix in a sparse format, in which only the nonzero entries and their locations are sorted.
The nonzero entries can then be entered one-by-one or in a loop.
>> a = sparse (3,2)
a=
A ll zero sparse: 3-by-2
>> a(1,2)=1;
>> a(3,1)=4;
>> a(3,2)=-1;
>> a
a=
(3,1)
4
(1,2)
1
(3,2)
-1
Notice that the display in any MATLAB statement can be suppressed by ending the line
with a semicolon.
The inverse of a square matrix is defined by
a- 1a = aa- 1 = I
if the matrix a is not singular. The MATLAB expression for the inverse is inv(a ) . Linear
algebraic equations can also be solved by using backslash operator as shown in Section
1.3.10, which avoids computations of the inverse and is therefore faster.
The matrix a is nonsingular if its determinant, denoted by det (a), is not equal to
zero. A determinant of a 2x2 matrix is defined by
a
a
a = 11 12
a
a
21
22
det( a) = a11a22 − a12a21
The MATLAB expression for the determinant is
det (a )
For example,
6
>> a = [1 3; 4 2];
>> det (a)
ans =
-10
12.1.9 Operation with matrices
Addition and Subtraction
a11 ± b11 a12 ± b12 L a1n ± b1n
a ±b
a22 ± b22
c = a ± b = 21 21
M
O
a
±
b
a
±
b
mn
mn
m1 m1
An example of matrix addition in MATLAB is given below:
>> a = [1 2 3;4 5 6;7 8 9];
>> a = [1 1 1;2 2 2;3 3 3];
>> c = [1 2;3 4;5 6];
>> a+b
ans =
2
3
4
6
7
8
10
11
12
>> a+c
??? Error using ==> +
Matrix dimensions must agree
Multiplication
1. Multiplication of a matrix by a scalar
a11 a12 L a1n ca11 ca12 L ca1n
a
a22
= ca21 ca22
c ⋅ a = c ⋅ 21
M
M
O
O
amn cam1
camn
am1
7
2. Scalar product of two column vectors
aT ⋅ b = [a1 a2
K
b1 n
b
°
an ]. 2 =
M
i =1
bn
a
ai bi
In MATLAB the scalar product as defined above is given by either a * b ¢or dot (a, b) .
The length of a vector a is denoted by |a| and is given by
a=
a12 + a 22 + L + an2
The length of a vector is also called its norm.
3. Product of two matrices
The product of two matrices a (m ´ k ) and b (k ´ n )is defined as
k
°
a1 j b j1
j =1
k
°
a21 j b j1
c = ab = j =1
M
k
°
amj b j1
j =1
a
a
k
k
°
°
a
a1 j b j 2
L
j =1
k
°
a
a
j =1
a2 j b j 2
j =1
O
k
°
a
a
j =1
a1 j b jn
amj b jn
Alternatively we can write the above as
n
cij =
å
aikbkj
k= 1
Note the the i,j entry of c is the scalar product of row i of a and column j of b.
The product of two matrices a and b c is defined only if the number of columns in
a equals the number of rows in a. In other words, if a is an (m ´ k ) matrix, then
b must be an (k ´ n ) matrix, where k is arbitrary. The product c will then have
the same number of rows as a and the same number of columns as b, i.e. it will be
an m ´ n matrix.
8
An important fact to remember is that matrix multiplication is not commutative,
i.e. ab ¹ ba except in unusual circumstances.
The MATLAB expression for matrix multiplication is
c = a *b
Consider the same matrices a and c as before. An example of matrix
multiplication with MATLAB is:
>> a*c
ans =
22
28
49
64
76
100
>> c*c
??? Error using ==> *
Inner matrix dimensions must agree.
4. Other matrix operations
T
a) Transpose of product: (ab) = bT aT
b) Product with identity matrix: aI = a
c) Product with zero matrix: a0 = 0
12.1.10 Solution of system of linear equations
Consider the following system of n equations with n unknowns, dk , k = 1, 2, L , n :
We can rewrite this system of equations in matrix notation as follows:
Kd = f
9
where
K11 K12 L K1n
K
K 22
K = 21
M
O
K nm
K n1
f1
f
f = 2
M
f n
d1
d
d = 2
M
d n
The symbolic solution of the above system of equation can be found by multiplying both
sides with inverse of K, which yields
d = K- 1f
MATLAB expression for solving the system of equations is
d= K \ f
or
d = inv (K )* f
An example of solution of system of equations with MATLAB is given below:
>> A = rand (3,3)
A =
0.2190
0.6793
0.5194
0.0470
0.9347
0.8310
0.6789
0.3835
0.0346
>> b = rand (3,1)
b=
0.0535
0.5297
0.6711
>> x = A \ b
x=
-159.3380
314.8625
-344.5078
As mentioned before, the backslash provides a faster way to solve equations and should
always be used for large systems. The reason for this is that the backslash uses
elimination to solve with one right hand side, whereas determining the inverse of an nxn
10
matrix involves solving the system with n right hand sides. Therefore, the backslash
should always be used for solving large system of equations.
12.1.11 Strings in MATLAB
MATLAB variables can also be defined as string variables. A string character is a text
surrounded by single quotes. For example:
>> str='hello world'
str =
hello world
It is also possible to create a list of strings by creating a matrix in which each row is a
separate string. As with all standard matrices, the rows must be of the same length. Thus:
>> str_ m at = ['string A ' ; 'string B']
str_ m at =
string A
string B
Strings are used for defining file names, plot titles, and data formats. Special built-in
string manipulation functions are available in MATLAB that allow you to work with
strings. In the MATALB codes provided in the book we make use of strings to compare
functions. For example the function strcmpi compares two strings
>> str = 'print output';
>> strcmpi(str,'PR INT OUT PUT ')
ans =
1
A true statment results in 1 and a false statement in 0. To get a list of all the built-in
MATLAB functions type
>> help strfun
Another function used in the codes is fprintf. This function allows the user to print to the
screen (or to a file) strings and numeric information in a tabulated fasion. For example
>>fprintf(1,'T he number of nodes in the mesh is %d \ n',10)
T he number of nodes in the mesh is 10
11
The first argument to the function tells MATLAB to print the message to the screen. The
second argument is a string, where %d defines a decimal character with the value of 10
and the \n defines a new line. To get a complete description type
>> help fprintf
12.1.11 Programming with MATLAB
MATLAB is very convenient for writing simple finite element programs. It provides the
standard constructs, such as loops and conditionals; these constructs can be used
interactively to reduce the tedium of repetitive tasks, or collected in programs stored in
''m-files'' (nothing more than a text file with extension ``.m'').
12.1.11.1 Conditional and Loops
MATLAB has a standard if-elseif-else conditional.
The general form
An example
>> t = 0.76;
if expression1
>> if t > 0.75
statements1
s = 0;
elseif expression2
elseif t < 0.25
statements2
s = 1;
…
else
…
s = 1-2*(t-0.25);
…
end
else
>> s
statements
s=
end
0
MATLAB provides two types of loops, a for-loop (comparable to a Fortran do-loop or a
C for-loop) and a while-loop. A for-loop repeats the statements in the loop as the loop
index takes on the values in a given row vector; the while-loop repeats as long as the
given expression is true (nonzero):
The general form
for index = start:increment:end
statements
end
while expression
statements
end
Examples
>> for i=1:1:3
disp(i^2)
end
1
4
9
>> x=1;
>> while 1+x > 1
x = x/2;
end
12
>> x
x=
1.1102e-16
12.1.11.2 Functions
Functions allow the user to create new MATLAB commands. A function is defined in an
m-file that begins with a line of the following form:
function [output1,output2,...] = cmd_name(input1,input2,...)
The rest of the m-file consists of ordinary MATLAB commands computing the values of
the outputs and performing other desired actions. Below is a simple example of a
function that computes the quadratic function f (x ) = x 2 - 3x - 1 . The following
commands should be stored in the file fcn.m (the name of the function within MATLAB
is the name of the m-file, without the extension)
function y = fcn( x )
y=x^ 2-3*x-1;
T hen type command:
>> fcn(0.1)
ans =
-1.2900
12.1.12 Basic graphics
MATLAB is an excellent tool for visualizing and plotting results. To plot a graph the user
specifies the x coordinate vector and y coordinate vector using the following syntax
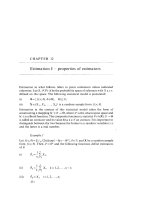
>> x=[0:0.01:1];
>> y=x.^ 2;
>> plot(x,y);
The above will generate
13
Figure 12.2 Typical outpout of plot(x,y) function
Various line types, plot symbols and colors may be obtained with plot(x,y,s) where s is a
character string consisting of elements from any combination of the following 3 columns:
b
g
r
c
m
y
k
blue
green
red
cyan
magenta
yellow
black
. point
o circle
x x-mark
+ plus
* star
s square
d diamond
- solid
: dotted
-. dashdot
-- dashed
(none) no line
To add a title, x and y labels, or a grid, the user should use the following MATLAB
functions. Note that the arguments to the functions are strings
>> title('circle');
>> xlabel('x');
>> ylabel('y');
>> grid
In the MATLAB Finite Element code provided in the book, we also use two specialized
plots. The first plot is the patch function. This function is used to visualize 2D polygons
with colors. The colors are interpolated from nodes of the polygon to create a colored
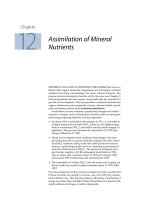
surface. The following example generates a filled square. The colors along the x axis are
the same while the colors along the y axis are interpolated between the values [0,1].
14
>> x = [0 1 1 0];
>> y = [0 0 1 1];
>> c = [0 0 1 1];
>> patch(x,y,c)
Figure 12.3 Typical outpout of patch(x,y,c) function
We will use the patch function to visualize temperatures, stresses and other variables
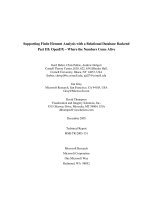
obtained at the finite element solutions. Another specialized plot function is the quiver.
This function is used to visualize gradients of functions as an arrow plot. The following
example demonstrates the use of quiver function for plotting the gradients to the function
y=x2
>> x=0:0.1:1; y=x.^ 2;
>> cx=ones(1,11); cy=2*x;
>> plot(x,y); hold on
>> quiver(x,y,cx,cy)
15
Figure 12.4 Typical outpout of quiver(x,y,cx,cy) function
The hold on command is used to hold the current plot and all axis properties so that
subsequent graphing commands will executed on the existing graph.
Using the text function, the user can add to a plot a text message. For example
text(1,1,'flux')
The first and second arguments define the position of the text on the plot, while the
string gives the text.
12.1.13 Remarks
a) In practice the number of equations n can be very large. PCs can today solve
thousands of equations in a matter of minutes if they are sparse (as they are in
FEM analysis-you will learn about this later) but sometimes millions of
equations are needed, as for an aircraft carrier or a full model of an aircraft;
parallel computers are then needed.
b) Efficient solution techniques that take advantage of the sparsity and other
advantageous properties of FEM equations are essential for treating even
moderately large systems. The issue of how to efficiently solve large systems
will not be considered in this course.
c) In this course, we will see that
• The matrix corresponding to the system of equations arising from
FEM (denoted as K) is non-singular (often called regular), i.e.,
K- 1 exists if the correct boundary conditions are prescribed and the
elements are properly formulated. Furthermore, for good models it is
usually well-conditioned, which means it is not very sensitive to
roundoff errors.
16
•
•
K is symmetric, i.e. KT = K .
K is positive definite, i.e., xT Kx > 0 " x (meaning for any value of x)
Alternatively, K is said to be positive definite if all the eigenvalues are
strictly positive. The eigenvalue problem consists of finding nonzero
eigenvectors y and the corresponding eigenvalues l satisfying
Ky = l y
The MATLAB expression for the eigenvalues problem is:
>> K =[2 -2;-2 4];
>> [y, lamda]=eig(K)
y=
0.8507
-0.5257
-0.5257
0.8507
lamda =
0.7639
0
0
5.2361
12.2 Finite element programming with MATLAB for trusses
In Chapter 2 the basic structure of the finite element method for truss structures
has been illustrated. In this section we present a simple finite element program using
MATLAB programming language. Since MATLAB manipulates matrices and vectors
with relative ease the reader can focus on fundamentals ideas rather than on algorithmic
details.
The code is written to very closely follow the formulation given in this chapter.
In order to better understand how the program works Figure 2.8 and Example Problem
2.2 in Chapter 2 have been included as examples solved by the program. Going through
the code along with this guide and the example problems is an effective method to
comprehend the program.
The main routines in the finite element code are:
1. Preprocessing including input data and assembling the proper arrays, vectors,
and matrices.
2. Calculation of element stiffness matrices and force vectors
3. Direct assembly of matrices and vectors
4. Partition and solution
5. Postprocessing for secondary variables
Explanation for various MATLAB routines (stored in *.m files) are described as
comments within each subroutine.
17
12.2.1 Notations and definitions
12.2.1.1 User provided
nsd:
number of space dimension (1 for 1D problems)
ndof: number of degrees-of-freedom per node
nnp:
number of nodal points
nel:
number of elements
nen:
number of element nodes (2 in this case)
nd:
number of prescribed (known) displacements
CArea: cross-sectional area
Area = CArea(element number)
E:
Young’s Modulus
Young = E(element number)
leng: element length
Length = leng(element number)
phi:
angle from x ¢axis to x axis for each element specified in degrees. Remember,
x ¢ is
always from local node 1 to 2
phi = phi(element number)
IEN: connectivity information matrix
global node number = IEN (local node number, element number)
d_bar: prescribed displacement vector - d in Eq. Error! Reference source not found..
f_hat: given force vector - ˆf in Eq. Error! Reference source not found..
plot_truss:
plot_nod:
plot_stress:
string for output control: [‘yes’] to plot truss elements
string for output control: [‘yes’] to plot truss global node numbers
string for output control: [‘yes’] to plot stresses
12.1.1.2 Calculated or derived by program
neq: total number of equations
K: global stiffness matrix
d:
global displacement vector is stored as:
for 1-D problems
for 2-D problems
u1x
u1 y = d
M
uny
u1
M = d
un
18
f:
global force vector (excluding the reactions) is stored as:
for 1-D problems
for 2-D problems
f1x
f1 y = f
M
f ny
f1
M = f
f n
e: element number
ke: element stiffness matrix
de: element nodal displacement vector:
for 1-D problems
for 2-D problems
u1ex
u1ey
e = de
u2 x
ue
2y
u1
= de
u2
LM: gather matrix
The gather matrix is used to extract the element and local degrees-of-freedom. It
has the following structure:
global degree-of-freedom=LM (local degree-of-freedom, element number)
When ndof = 1 (see example in Figure 2.8) IEN and LM are defined as follows:
e =1
e =2
e =1
1 2 = IEN
2 3
e =2
1 2 = LM
2 3
When ndof = 2 (example Problem 2.2), IEN and LM are defined as:
e =1
1
2
5
6
e = 2
1 2
3 3
= IEN
3
4
= LM
5
6
In both examples, columns indicate the elements and rows indicate global degrees-offreedom.
partition of the global stiffness matrix K based on Eq.
Error! Reference source not found.
K_EF:
partition of the global stiffness matrix K based on Eq.
Error! Reference source not found.
K_F:
partition of the global stiffness matrix K based on Eq.
Error! Reference source not found.
d_F:
unknown (free) part of the global displacement vector d based on Eq.
Error! Reference source not found.
K_E:
19
d_E:
f_E:
stress:
prescribed (essential) part of the global displacement vector d based on
Eq. Error! Reference source not found.
reaction force (unknown) vector based on Eq.
Error! Reference source not found.
stress for each element
Remark: In this chapter nodes where the displacements are prescribed have to be
numbered first.
12.21.2 MATLAB Finite element code for trusses
truss.m
%%%%%%%%%%%%%%%%%%%%%%
% 2D Truss (Chapter 2)
%
% Haim Waisman, Rensselaer
%
%%%%%%%%%%%%%%%%%%%%%%
clear all;
close all;
% include global variables
include_flags;
% Preprocessor Phase
[K,f,d] = preprocessor;
% Calculation and assembly of element matrices
for e = 1:nel
ke = trusselem(e);
K
= assembly(K,e,ke);
end
% Solution Phase
[d,f_E] = solvedr(K,f,d);
% Postprocessor Phase
postprocessor(d)
include_flags.m
% file to include global variables
global nsd ndof nnp nel nen neq nd
global CArea E leng phi
global plot_truss plot_nod plot_stress
global LM IEN x y stress
preprocessor.m
% preprocessing– read input data and set up mesh information
function [K,f,d] = preprocessor;
include_flags;
20
% input file to include all variables
input_file_example2_2;
%input_file_example2_8;
% generate LM array
for e = 1:nel
for j = 1:nen
for m = 1:ndof
ind = (j-1)*ndof + m;
LM(ind,e) = ndof*IEN(j,e) - ndof + m;
end
end
end
input_file_example2_2.m
% Input Data for Example 2.2
nsd
= 2;
% Number of space dimensions
ndof
= 2;
% Number of degrees-of-freedom per node
nnp
= 3;
% Number of nodal points
nel
= 2;
% Number of elements
nen
= 2;
% Number of element nodes
neq
= ndof*nnp;
f
d
K
= zeros(neq,1); % Initialize force vector
= zeros(neq,1); % Initialize displacement matrix
= zeros(neq); % Initialize stiffness matrix
% Element properties
CArea = [1
1 ];
leng
= [1 sqrt(2)];
phi
= [90
45 ];
E
= [1
1 ];
% Number of equations
% Elements area
% Elements length
% Angle
% Young’s Modulus
% prescribed displacements
% displacement d1x d1y d2x d2y
d
= [0
0
0
0]';
nd
= 4;
% Number of prescribed displacement degrees-of-freedom
% prescribed forces
f(5)
= 10; % Force at node 3 in the x-direction
f(6)
= 0;
% Force at node 3 in the y-direction
% output plots
plot_truss
= 'yes';
plot_nod
= 'yes';
% mesh Generation
truss_mesh_2_2;
21
truss_mesh_2_2.m
% geometry and connectivity for example 2.2
function truss_mesh_2_2
include_flags;
% Nodal coordinates (origin placed at node 2)
x
= [1.0 0.0 1.0 ]; % x coordinate
y
= [0.0 0.0 1.0 ]; % y coordinate
% connectivity array
IEN = [1 2
3 3];
% plot truss
plottruss;
input_file_example2_8.m
% Input Data from Chapter 2 Figure 2.8
nsd
= 1; % Number of spatial dimensions
ndof
= 1; % Number of degrees-of-freedom per node
nnp
= 3; % Total number of global nodes
nel
= 2; % Total number of elements
nen
= 2; % Number of nodes in each element
neq
= ndof*nnp;
f
d
K
= zeros(neq,1); % Initialize force vector
= zeros(neq,1); % Initialize displacement vector
= zeros(neq); % Initialize stiffness matrix
% Element properties
CArea = [.5
1];
leng
= [2
2];
E
= [1
1];
% Number of equations
% Elements cross-sectional area
% Elements length
% Young’s Modulus
% prescribed displacements
d(1)
= 0;
nd
= 1;
% Number of prescribed displacement degrees of freedom
% prescribed forces
f(3)
= 10;
% force at node 3 in the x-direction
% output controls
plot_truss = 'yes';
plot_nod = 'yes';
% mesh generation
truss_mesh_2_8;
22
truss_mesh_2_8.m
% geometry and connectivity for example problem in Figure 2.8
function truss_mesh_2_8;
include_flags;
% Node coordinates (origin placed at node 1)
x
= [0.0 1.0 2.0 ]; % x coordinate
y
= [0.0 0.0 0.0 ]; % y coordinate
% connectivity array
IEN = [1 2
2 3];
% plot truss
plottruss;
Plottruss.m
% function to plot the elements, global node numbers and print mesh parameters
function plottruss;
include_flags;
% check if truss plot is requested
if strcmpi(plot_truss,'yes')==1;
for i = 1:nel
XX = [x(IEN(1,i)) x(IEN(2,i)) x(IEN(1,i)) ];
YY = [y(IEN(1,i)) y(IEN(2,i)) y(IEN(1,i)) ];
line(XX,YY);hold on;
% check if node numbering is requested
if strcmpi(plot_nod,'yes')==1;
text(XX(1),YY(1),sprintf('%0.5g',IEN(1,i)));
text(XX(2),YY(2),sprintf('%0.5g',IEN(2,i)));
end
end
title('Truss Plot');
end
% print mesh parameters
fprintf(1,'\tTruss Params \n');
fprintf(1,'No. of Elements %d \n',nel);
fprintf(1,'No. of Nodes %d \n',nnp);
fprintf(1,'No. of Equations %d \n\n',neq);
trusselem.m
% generate the element stiffness matrix for each element
function ke = trusselem(e)
include_flags;
const = CArea(e)*E(e)/leng(e);
% constant coefficient within the truss element
23
if ndof == 1
ke = const * [1 -1 ;
% 1-D stiffness
-1 1];
elseif ndof == 2
p = phi(e)*pi/180;
% Converts degrees to radians
s = sin(p);
s2 = s^2;
ke = const*[c2
c*s
-c2
-c*s
c = cos(p);
c2 = c^2;
c*s -c2 -c*s;
s2 -c*s -s2;
-c*s c2
c*s;
-s2
c*s s2];
% 2-D stiffness
end
assembly.m
% assemble element stiffness matrix
function K = assembly(K,e,ke)
include_flags;
for loop1 = 1:nen*ndof
i = LM(loop1,e);
for loop2 = 1:nen*ndof
j = LM(loop2,e);
K(i,j) = K(i,j) + ke(loop1,loop2);
end
end
solvedr.m
% partition and solve the system of equations
function [d,f_E] = solvedr(K,f,d)
include_flags;
% partition the matrix K, vectors f and d
K_E
= K(1:nd,1:nd);
K_F
= K(nd+1:neq,nd+1:neq);
K_EF = K(1:nd,nd+1:neq);
f_F
= f(nd+1:neq);
d_E
= d(1:nd);
% Extract K_E matrix
% Extract K_E matrix
% Extract K_EF matrix
% Extract f_F vector
% Extract d_E vector
% solve for d_F
d_F
=K_F\( f_F - K_EF'* d_E);
% reconstruct the global displacement d
d = [d_E
d_F];
% compute the reaction r
24
f_E = K_E*d_E+K_EF*d_F;
% write to the workspace
solution_vector_d
=d
reactions_vector
= f_E
postprocessor.m
% postprocessing function
function postprocesser(d)
include_flags;
% prints the element numbers and corresponding stresses
fprintf(1,'element\t\t\tstress\n');
% compute stress vector
for e=1:nel
de
= d(LM(:,e));
% displacement at the current element
const
= E(e)/leng(e); % constant parameter within the element
if ndof == 1 % For 1-D truss element
stress(e) = const*([-1 1]*de);
end
if ndof == 2 % For 2-D truss element
p = phi(e)*pi/180;
% Converts degrees to radians
c = cos(p); s = sin(p);
stress(e) = const*[-c -s c s]*de;
% compute stresses
end
fprintf(1,'%d\t\t\t%f\n',e,stress(e));
end
12.3 Shape functions and Gauss quadrature with MATLAB
In Chapter 2 the basic finite element programming structure was introduced for
one- and two-dimensional analysis of truss structures. In this section we give the
functions for the construction of element shape functions in one-dimension and their
derivatives. The shape functions are defined in the physical coordinate system.
12.3.1 Notations and definitions
xe:
xt:
N:
B:
gp:
W:
element nodal x-coordinates
x coordinate at which the functions are evaluated
array of shape functions
array of derivatives of the shape functions
array of position of Gauss points in the parent element domain array of weights - [W1 W2 L Wngp ]
25
[x1
x2
L
xngp
]