Survey of serum iron and ferritin concentrations in patients with stage 3 to 5 chronic kidney disease
Bạn đang xem bản rút gọn của tài liệu. Xem và tải ngay bản đầy đủ của tài liệu tại đây (1.75 MB, 7 trang )
JOURNAL OF MILITARY PHARMACO-MEDICINE N09-2017
SURVEY OF SERUM IRON AND FERRITIN CONCENTRATIONS
IN PATIENTS WITH STAGE 3 TO 5 CHRONIC KIDNEY DISEASE
Nguyen Van Hung*; Nguyen Cao Luan**; Le Viet Thang***
SUMMARY
Objectives: To evaluate the serum iron and ferritin concentrations in patients with chronic
kidney disease (CKD) predialysis and its relation with stages of CKD and some other features.
Subjects and methods: A cross-sectional study on a group of 175 patients with CKD stage 3 - 5
and a control group of 51 healthy people at Department of Nephrology and Hemodialysis,
103 Military Hospital. Results: The average concentrations of serum iron in study group was
significantly lower than control group (12.87 ± 6.85 µmol/L versus 16.57 ± 5.83 µmol/L), but the
average concentrations of serum ferritin in study group was higher than in the control group
(308.59 ± 178.41 ng/mL versus 159.89 ± 87.98 ng/mL) with p < 0.01. Serum iron and ferritin
concentrations were significantly associated with the stages of CKD (p < 0.05). Ferritin levels were
positively correlated with serum creatinine levels (r = 0.256; p < 0.01) and hs-CRP levels
(r = 0.383; p < 0.001). Conclusion: Patients with stage 3 - 5 CKD, predialysis had lower serum iron
and higher serum ferritin concentrations compared to control group. There was significant
correlation between serum iron, ferritin with serum creatinine concentrations and hs-CRP levels.
* Keywords: Chronic kidney disease; Serum iron; Serum ferritin; Predialysis.
INTRODUCTION
Chronic kidney disease is a worldwide
public health problem with an increasing
incidence and prevalence, poor outcomes
and high cost. Chronic kidney disease
causes not only kidney failure but also
complications of decreased kidney function
and cardiovascular disease [5].
Anaemia of chronic kidney disease (CKD)
is widely common in patients with renal
impairment and is associated with significant
morbidity and mortality. Deficient erythropoietin
(EPO) production and reduced bioavailability
of iron ultimately lead to absolute or functional
iron deficiency anaemia. Anaemia of endstage renal disease can be managed
successfully by recombinant human
EPO. Iron administration plays a central
role in enhancing anaemia responsiveness
to EPO. Serum ferritin concentrations and
iron saturation ratio are among the two most
commonly used markers of iron status in
maintenance dialysis patients [4].
Absolute iron deficiency, the iron
deficiency that is characterized by low
orabsent bone marrow staining for iron,
is to be distinguished from functional or
* Transport Hospital
** Bachmai Hospital
** 103 Military Hospital
Corresponding author: Nguyen Van Hung ()
Date received: 04/10/2017
Date accepted: 22/11/2017
163
JOURNAL OF MILITARY PHARMACO-MEDICINE N09-2017
relative iron deficiency, which is defined
within last 7 days; did not agree to participate
as a response to intravenous iron with an
in the study.
increase in hemoglobin (Hb) or a decrease
2. Methods.
in erythropoiesis-stimulating agent (ESA)
* Study design: A cross-sectional
requirement [8]. Therefore, we conducted
this research aiming: To assess the
descriptive study.
serum iron and ferritin concentrations in
- Serum iron concentrations measurement:
patients with stage 3 - 5 CKD and its
Quantification of serum iron concentrations
relation with stages of CKD, serum creatinine
by color comparison following the principle:
concentrations and hs-CRP.
Fe3+ is released from the transferrin-Fe
SUBJECTS AND METHODS
complex at pH < 2.0; Fe3+ in the acid
environment will be reduced to Fe2+. Fe2+
1. Subjects.
combined with ferrozine buffers to form a
The study was conducted on a group
of 175 patients with CKD stage 3 - 5,
predialysis and a control group of 51 healthy
people at Department of Nephrology and
color complex. After that, the test is conducted
on the Cobas 6,000 system with Roche's
kit.
-
Hemodialysis, 103 Military Hospital.
* Excluding criteria: Blood transfusion,
acute bleeding, some acute diseases,
being performed surgery within 3 months
Serum
ferritin
concentrations
measurement: Quantification of serum
ferritin by immunohistochemistry on the
Cobas 6,000 system with Roche's kit.
prior to study period; taking iron products
* Diagnostic criteria:
Table 1: Stages of CKD: K/DOQI 2002 [1].
Stage
Description
≥ 90
1
Kidney damage with normal or increase GFR
2
Kidney damage with mild decrease GFR
60 - 90
3
Moderate decrease GFR
30 - 59
4
Severe decrease GFR
15 - 29
5
Kidney failure
- Serum hs-CRP > 5 mg/L: diagnosed as increase.
* Statistical analysis:
Statistical analyses were conducted using SPSS 20.0.
164
2
GFR (mL/min/1.73m )
< 15 (or dialysis)
JOURNAL OF MILITARY PHARMACO-MEDICINE N09-2017
RESULTS AND DISCUSSION
The study group with an average age of 53.26 years old, 69.1% male, 30.9% female.
There was not significant difference compared to those of control group.
Table 2: Iron and ferritin concentrations between study group and control group.
Indexes
Iron* (µmoL/L)
Ferritin* (ng/mL)
Control group (n = 51)
Study group (n = 175)
p
average
16.57 ± 5.83
12.87 ± 6.85
< 0.01
min
7.8
2.0
max
41.8
38.7
average
159.89 ± 87.98
308.59 ± 178.41
min
10.6
35.1
max
501.8
698.6
< 0.001
In our study, the average concentrations
weight of about 450 kDa, containing
of serum iron in study group was significant
heavy (H) and light (L) subunits. Serum
lower than control group (12.87 µmol/L
ferritin is slightly different than tissue
versus 16.57 µmol/L) with p < 0.01. The
ferritin and contains little or no iron. While
average concentrations of serum ferritin in
tissue ferritin clearly plays a role in
study group was higher than in the control
intracellular iron handling, the role of
group with p < 0.01 (308.59 ng/mL versus
serum ferritin is less clearly understood.
159.89 ng/mL). The study by Malyszko J
The level of ferritin in plasma represents
also showed that the average concentrations
the balance between its secretion, which
of serum iron and ferritin in chronic kidney
is directly related to intracellular iron synthesis
failure was significantly lower than control
and its clearance, mainly in liver and other
group (with p < 0.05 and 0.001, respectively)
organs [3]. However, liver dysfunction and
[7]. Serum ferritin is a frequently used
inflammatory factors may interfere with
marker of iron status in CKD patients.
the synthesis and clearance of ferritin,
Serum ferritin concentration results from
thereby increasing serum ferritin levels
the leakage of tissue ferritin, an intracellular
due to circumstances unrelated to iron
iron storage protein shell with a molecular
metabolism.
165
JOURNAL OF MILITARY PHARMACO-MEDICINE N09-2017
Table 3: Relationship between iron, ferritin concentrations and stages of CKD in study
group (n = 175).
Stages of CKD
Iron (µmol/L)
X ± 2SD
Ferritin (ng/mL)
X ± 2SD
3 (n = 31)
16.31 ± 6.56
197.46 ± 50.85
4 (n = 35)
13.88 ± 6.26
261.70 ± 141.19
5 (n = 109)
11.57 ± 6.77
355.25 ± 194.51
< 0.01
< 0.001
pANOVA
Our results showed that serum iron and ferritin concentrations were significantly
associated with the stages of CKD (p < 0.01). Patients with stage 3 CKD had the
highest levels of serum iron and the lowest levels of serum ferritin, while the patients
with stage 5 CKD had the lowest iron concentrations and the highest serum ferritin
concentrations.
Table 4: Correlation between serum iron, ferritin concentrations and serum creatinine
(n = 175).
Creatinine (µmol/l)
Indexes
Correlation equation
r
p
Iron (µmol/L)
-0.103
> 0.05
Ferritin (ng/mL)
0.256
< 0.01
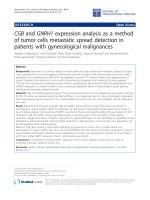
Serum iron concentrations was not
correlated with serum creatinine
concentrations, whereas ferritin levels
were positively correlated with serum
creatinine levels (r = 0.256; p < 0.01). Our
results in table 3 and 4 showed that
serum iron and ferritin concentrations
were significantly associated with the
stage of CKD as well as the serum
creatinine concentration. These results
were similar to those by Fishbane S’
(the same subjects): among women, there
was a trend toward lower decreasing
mean TSAT for progressively lower levels
of renal function (p < 0.02) and a statistically
significant trend toward increasing serum
166
Ferritin = 0.121 x creatinine + 240.46
ferritin for progressively lower levels of
renal function (p < 0.0001) [2]. Iron is a
vital element for numerous body functions,
most notably as an ingredient of hemoglobin
(Hb). Most healthy people can achieve a
stable iron balance, managing to ingest
the required amount of iron in the diet
to compensate for the small amount of
daily loss iron from the gut. However,
many patients with advanced CKD
are in negative iron balance as a result
of reduced dietary intake, impaired
absorption from the gut and increased
loss iron, so serum iron concentrations
mostly decreased. In our study, there
was an increase in serum ferritin
JOURNAL OF MILITARY PHARMACO-MEDICINE N09-2017
concentrations. It is likely due to the
effect of inflammation. It is well known
that occult inflammation is commonly
present in CKD and may increase with
progressive disease [6]. Inflammation has
a profound effect on iron indices.
Previously, in hemodialysis, hs-CRP,
an indicator of inflammation, was found to
be highly correlated with serum ferritin
values [2].
Ferritin = 0.121xCreatinine + 240.46
800
700
600
Ferritin
500
400
300
200
100
0
Creatinine
0
500
1000
1500
2000
2500
Chart 1: Correlation between serum ferritin concentration and serum creatinine.
Table 5: Relationship between serum iron, ferritin concentrations and hs-CRP
(n = 175).
hs-CRP status
Iron (µmol/L)
X ± 2SD
Ferritin (ng/mL)
X ± 2SD
hs-CRP > 5 mg/L (n = 52)
11.71 ± 6.97
411.03 ± 177.65
hs-CRP ≤ 5 mg/L (n = 123)
13.36 ± 6.77
265.28 ± 160.75
> 0.05
< 0.001
p
In patients with elevated hs-CRP levels, serum iron concentrations were significantly
lower than those without elevated hs-CRP, but the difference was not statistically
significant (p > 0.05). By contrast, serum ferritin concentrations in patients who elevated
hs-CRP was significantly higher than non elevated hs-CRP group with p < 0.001.
167
JOURNAL OF MILITARY PHARMACO-MEDICINE N09-2017
Table 6: Correlation between serum iron, ferritin concentrations and hs-CRP (n = 175).
hs-CRP (mg/l)
Indexes
Correlation equation
r
p
Iron (µmol/L)
-0.117
> 0.05
Ferritin (ng/mL)
0.383
< 0.001
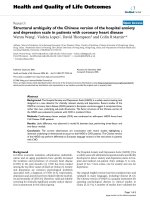
Ferritin = 23.52 x CRP + 223.26
There was no correlation between serum iron concentrations and hs-CRP levels, but
there was a positive correlation between ferritin and hs-CRP levels (r = 0.383; p < 0.001).
Ferritin = 0.121xCreatinine + 240.46
800
700
600
Ferritin
500
400
300
200
100
0
0
500
Creatinine
1000
1500
2000
2500
Chart 2: Correlation between serum ferritin concentration and hs-CRP.
In table 5 and 6, we found that serum
ferritin concentration in patients who elevated
hs-CRP was significantly higher than non
elevated hs-CRP group and there was a
positive correlation between ferritin and
hs-CRP levels. The study by KalantarZadeh K. also showed that there was a
possitive correlation between serum ferritin
and serum hs-CRP concentration (r = 0.31;
p = 0.005) [4]. Inflammation has been
implicated in several complications in CKD,
including malnutrition and accelerated
168
atherosclerosis. It also blunts the iron
utilization and induces resistance to
erythropoietin therapy. The exact pathway
which the inflammatory cascade results in
erythropoietin resistance is not completely
understood. It has been hypothesized that
inflammatory activators have a pro-apoptotic
effect on erythroid progenitor cells and
compete with the anti-apoptotic effect of
erythropoietin, the end result being
erythropoietin resistance. Serum ferritin is
also an acute phase reactant which may
JOURNAL OF MILITARY PHARMACO-MEDICINE N09-2017
also be elevated during an inflammation.
Thus, an elevation of serum ferritin can be
due to an increase in body iron stores or
an inflammation, both of which are hazardous
in patients with CKD.
CONCLUSIONS
In our study, the average concentration
of serum iron in study group was significantly
lower than that in the control group (12.87 ±
6.85 µmol/L versus 16.57 ± 5.83 µmol/L),
but the average concentration of serum
ferritin in study group was higher than that in
the control group (308.59 ± 178.41 ng/mL
versus 159.89 ± 87.98 ng/mL) with p < 0.01.
Serum iron and ferritin concentrations were
significantly associated with the stages of
CKD (p < 0.01). Ferritin levels were positively
correlated with serum creatinine levels
(r = 0.256; p < 0.01) and hs-CRP levels
(r = 0.383; p < 0.001).
REFFERENCES
1. K/DOQI clinical practice guidelines for
chronic kidney disease: evaluation, classification,
and stratification. Am J Kidney Dis. 2002. 39
(2 Suppl 1), pp.S1-266.
2. Fishbane S et al. Iron indices in chronic
kidney disease in National Health and Nutritional
Examination Survey 1988 - 2004. Clin J Am
Soc Nephrol. 2009. 4 (1), pp.57-61.
3. Kalantar-Zadeh K et al. Serum ferritin is
a marker of morbidity and mortality in
hemodialysis patients. Am J Kidney Dis. 2001,
37 (3), pp.564-572.
4. Kalantar-Zadeh K, R.A. Rodriguez, M.H.
Humphreys. Association between serum
ferritin and measures of inflammation, nutrition
and iron in haemodialysis patients. Nephrol
Dial Transplant. 2004. 19 (1), pp.141-149.
5. Krishnan A et al. Anaemia of chronic
kidney disease: What We Know Now. 2017,
Vol 1, 11.
6. Landray M.J et al. Inflammation,
endothelial dysfunction and platelet activation
in patients with chronic kidney disease: the
chronic renal impairment in Birmingham
(CRIB) study. Am J Kidney Dis. 2004, 43 (2),
pp.244-253.
7. Malyszko J et al. Hepcidin, iron status
and renal function in chronic renal failure,
kidney transplantation and hemodialysis. Am
J Hematol. 2006, 81 (11), pp.832-837.
8. Wish J.B. Assessing iron status: beyond
serum ferritin and transferrin saturation. Clin J
Am Soc Nephrol. 2006, 1, Suppl 1, pp.S4-S8.
169