Ebook Marks'' essentials of medical biochemistry a clinical approach (2nd edition): Part 2
Bạn đang xem bản rút gọn của tài liệu. Xem và tải ngay bản đầy đủ của tài liệu tại đây (8.55 MB, 294 trang )
SECTION FIVE
21
Carbohydrate Metabolism
Basic Concepts in the Regulation of
Fuel Metabolism by Insulin, Glucagon, and
Other Hormones
CHAPTER OUTLINE
I. METABOLIC HOMEOSTASIS
II. MAJOR HORMONES OF METABOLIC
HOMEOSTASIS
III. SYNTHESIS AND RELEASE OF INSULIN AND
GLUCAGON
A. Endocrine pancreas
B. Synthesis and secretion of insulin
C. Stimulation and inhibition of insulin
release
D. Synthesis and secretion of glucagon
IV. MECHANISMS OF HORMONE ACTION
A. Signal transduction by hormones that bind
to plasma membrane receptors
1. Signal transduction by insulin
2. Signal transduction by glucagon
B. Signal transduction by cortisol and other
hormones that interact with intracellular
receptors
C. Signal transduction by epinephrine and
norepinephrine
KEY POINTS
■
■
■
■
■
■
■
■
■
■
■
■
■
■
Insulin and glucagon are the two major hormones that regulate fuel mobilization and storage.
Insulin and glucagon maintain blood glucose levels near 80 to 100 mg/dL despite varying carbohydrate intake during the day.
Glucose homeostasis is the maintenance of constant blood glucose levels.
If dietary intake of all fuels is in excess of immediate need, it is stored as either glycogen or fat.
Appropriately stored fuels are mobilized when demand requires.
Insulin is released in response to carbohydrate ingestion and promotes glucose utilization as a fuel
and glucose storage as fat and glycogen.
Glucagon is decreased in response to a carbohydrate meal and elevated during fasting.
Glucagon promotes glucose production via glycogenolysis (glycogen degradation) and gluconeogenesis (glucose synthesis from amino acids and other noncarbohydrate precursors).
Increased levels of glucagon relative to insulin also stimulate the release of fatty acids from adipose
tissue.
Insulin secretion is regulated principally by blood glucose levels.
Glucagon release is regulated principally through suppression by glucose and by insulin.
Glucagon acts by binding to a receptor on the cell surface, which stimulates the synthesis of the
intracellular second messenger, cAMP.
cAMP activates protein kinase A, which phosphorylates key regulatory enzymes, activating some and
inhibiting others.
Insulin acts via a receptor tyrosine kinase and leads to the dephosphorylation of the key enzymes
phosphorylated in response to glucagon.
329
Lieberman_Ch21.indd 329
9/16/14 2:04 AM
SECTION V ■ CARBOHYDRATE METABOLISM
330
THE WAITING ROOM
Fatty acids provide an example of
the influence that the level of a compound in the blood has on its own
rate of metabolism. The concentration of fatty
acids in the blood is the major factor determining whether skeletal muscles will use fatty
acids or glucose as a fuel (see Chapter 24). In
contrast, hormones are (by definition) carriers
of messages between their sites of synthesis
and their target tissues. Insulin and glucagon,
for example, are two hormonal messengers
that participate in the regulation of fuel metabolism by carrying messages that reflect the
timing and composition of our dietary intake of
fuels. Epinephrine, however, is a fight-or-flight
hormone that signals an immediate need for
increased fuel availability. Its level is regulated
principally through the activation of the sympathetic nervous system.
A
Glucose
Insulin
Liver
Triglyceride synthesis
Glycogen synthesis
Active glycolysis
B
Liver
Glucose
Glucagon
Epinephrine
Glycogen degradation
Gluconeogenesis
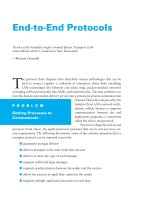
FIG. 21.1. Insulin and the insulin counterregulatory hormones. A. Insulin promotes glucose storage as triglyceride (TG) or glycogen.
B. Glucagon and epinephrine promote glucose
release from the liver, activating glycogenolysis and gluconeogenesis. Cortisol will stimulate
both glycogen synthesis and gluconeogenesis.
Lieberman_Ch21.indd 330
Deborah S. returned to her physician for her monthly office visit. She has
been seeing her physician for over a year because of obesity and elevated
blood glucose levels. She still weighed 198 lb, despite trying to adhere to
her diet. Her blood glucose level at the time of the visit, 2 hours after lunch, was
221 mg/dL (reference range ϭ 80 to 140). Deborah suffers from type 2 diabetes, an
impaired response to insulin. Understanding the actions of insulin and glucagon are
critical for understanding this disorder.
Connie C. is a 46-year-old woman who 6 months earlier began noting
episodes of fatigue and confusion as she finished her daily prebreakfast
jog. These episodes were occasionally accompanied by blurred vision and
an unusually urgent sense of hunger. The ingestion of food relieved all of her symptoms within 25 to 30 minutes. In the last month, these attacks have occurred more
frequently throughout the day and she has learned to diminish their occurrence by
eating between meals. As a result, she has recently gained 8 lb.
A random serum glucose level done at 4:30 PM during her first office visit was
subnormal at 67 mg/dL. Her physician, suspecting she was having episodes of hypoglycemia, ordered a series of fasting serum glucose, insulin, and c-peptide levels.
In addition, he asked Connie to keep a careful daily diary of all of the symptoms that
she experienced when her attacks were most severe.
I.
METABOLIC HOMEOSTASIS
Living cells require a constant source of fuels from which to derive adenosine triphosphate (ATP) for the maintenance of normal cell function and growth. Therefore,
a balance must be achieved between carbohydrate, fat, and protein intake; their rates
of oxidation; and their rates of storage when they are present in excess of immediate need. Alternatively, when the demand for these substrates increases, the rate of
mobilization from storage sites and the rate of their de novo synthesis also require
balanced regulation. The control of the balance between substrate need and substrate availability is referred to as metabolic homeostasis. The intertissue integration
required for metabolic homeostasis is achieved in three principal ways:
• The concentration of nutrients or metabolites in the blood affects the rate at
which they are used or stored in different tissues.
• Hormones carry messages to individual tissues about the physiological state of
the body and nutrient supply or demand.
• The central nervous system uses neural signals to control tissue metabolism,
either directly or through the release of hormones.
Insulin and glucagon are the two major hormones that regulate fuel storage
and mobilization (Fig. 21.1). Insulin is the major anabolic hormone of the body.
It promotes the storage of fuels and the utilization of fuels for growth. Glucagon
is the major hormone of fuel mobilization. Other hormones, such as epinephrine,
are released as a response of the central nervous system to hypoglycemia, exercise,
or other types of physiologic stress. Epinephrine and other stress hormones also
increase the availability of fuels (Fig. 21.2).
Glucose has a special role in metabolic homeostasis. Many tissues (e.g., the
brain, red blood cells, kidney medulla, exercising skeletal muscle) depend on
glycolysis for all or a part of their energy needs. As a consequence, these tissues
9/16/14 2:04 AM
CHAPTER 21 ■ BASIC CONCEPTS IN THE REGULATION OF FUEL METABOLISM
Insulin
Blood
fuel
Dietary Fuels:
• Carbohydrate
• Fat
• Protein
Blood
fuel
Fuel
stores
+
Growth
Neuronal
signals
Glucagon
+
Stress
hormones
Blood
fuel
Fuel utilization
ATP
Cell function
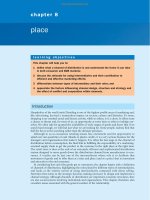
FIG. 21.2. Signals that regulate metabolic homeostasis. The major stress hormones are
epinephrine and cortisol.
require uninterrupted access to glucose to meet their rapid rate of ATP use. In the
adult, a minimum of 190 g glucose is required per day, approximately 150 g for the
brain and 40 g for other tissues. Significant decreases of blood glucose below 60 mg/
dL limit glucose metabolism in the brain and elicit hypoglycemic symptoms (as
experienced by Connie C.), presumably because the overall process of glucose flux
through the blood–brain barrier, into the interstitial fluid, and subsequently into the
neuronal cells is slow at low blood glucose levels because of the Km values of the
glucose transporters required for this to occur (see Chapter 22).
The continuous efflux of fuels from storage depots, during exercise, for example, is necessitated by the high amounts of fuel required each day to meet
the need for ATP under these conditions. Disastrous results would occur if even
a day’s supply of glucose, amino acids, and fatty acids could not enter cells normally and were instead left circulating in the blood. Glucose and amino acids
would be at such high concentrations in the circulation that the hyperosmolar effect
would cause progressively severe neurologic deficits and even coma. The concentration of glucose and amino acids would rise above the renal tubular threshold
for these substances (the maximal concentration in the blood at which the kidney can completely resorb metabolites), and some of these compounds would be
wasted as they spilled over into the urine. Nonenzymatic glycosylation of proteins
would increase at higher blood glucose levels altering the function of tissues in
which these proteins reside. Triacylglycerols, present primarily in chylomicrons
and very low density lipoproteins (VLDL) would rise in the blood, increasing the
likelihood of atherosclerotic vascular disease. These potential metabolic derangements emphasize the need to maintain a normal balance between fuel storage and
fuel use.
II. MAJOR HORMONES OF METABOLIC HOMEOSTASIS
The hormones that contribute to metabolic homeostasis respond to changes in the
circulating levels of fuels that, in part, are determined by the timing and composition
of our diet. Insulin and glucagon are considered the major hormones of metabolic
homeostasis because they continuously fluctuate in response to our daily eating
pattern. They provide good examples of the basic concepts of hormonal regulation. Certain features of the release and action of other insulin counterregulatory
Lieberman_Ch21.indd 331
331
Hyperglycemia may cause a constellation of symptoms such as
polyuria and subsequent polydipsia
(increased thirst). The inability to move glucose
into cells necessitates the oxidation of lipids as
an alternative fuel. As a result, adipose stores
are used, and the patient with poorly controlled
diabetes mellitus loses weight in spite of a good
appetite. Extremely high levels of serum glucose
can cause a hyperosmolar hyperglycemic state
in patients with type 2 diabetes mellitus. Such
patients usually have sufficient insulin responsiveness to block fatty acid release and ketone
body formation, but they are unable to significantly stimulate glucose entry into peripheral
tissues. The severely elevated levels of glucose
in the blood compared with those inside the cell
leads to an osmotic effect that causes water to
leave the cells and enter the blood. Because of
the osmotic diuretic effect of hyperglycemia, the
kidney produces more urine, leading to dehydration, which, in turn, may lead to even higher
levels of blood glucose. If dehydration becomes
severe, further cerebral dysfunction occurs and
the patient may become comatose. Chronic hyperglycemia also produces pathological effects
through the nonenzymatic glycosylation of a
variety of proteins. Hemoglobin A (HbA), one of
the proteins that becomes glycosylated, forms
HbA1c (see Chapter 7). Deborah S.’s high levels
of HbA1c (12% of the total HbA, compared with
the reference range of 4.7% to 6.4%) indicate
that her blood glucose has been significantly elevated over the last 12 to 14 weeks, the half-life
of hemoglobin in the bloodstream.
All membrane and serum proteins exposed
to high levels of glucose in the blood or interstitial fluid are candidates for nonenzymatic
glycosylation. This process distorts protein
structure and slows protein degradation, which
leads to an accumulation of these products in
various organs, thereby adversely affecting
organ function. These events contribute to the
long-term microvascular and macrovascular
complications of diabetes mellitus, which include diabetic retinopathy, nephropathy, and
neuropathy (microvascular), in addition to coronary artery, cerebral artery, peripheral artery
disease, and atherosclerosis (macrovascular).
9/16/14 2:04 AM
332
SECTION V ■ CARBOHYDRATE METABOLISM
Liver
Glycogen
–
+
+
–
Protein
+
Glucose
Fatty acids
Amino
acids
VLDL
Glucose
+
Fatty acids
–
+
+
Protein
+
CO2
Glycogen
Skeletal
muscle
Triacylglycerols
Adipocyte
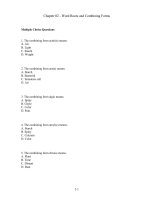
FIG. 21.3. Major sites of insulin action in fuel metabolism. VLDL, very low density
lipoprotein; ᮍ, stimulated by insulin; ᮎ, inhibited by insulin.
Connie C.’s studies confirmed that
her fasting serum glucose levels
were below normal with an inappropriately high insulin level. She continued to
experience the fatigue, confusion, and blurred
vision she had described on her first office
visit. These symptoms are referred to as the
neuroglycopenic manifestations of severe hypoglycemia (neurologic symptoms resulting
from an inadequate supply of glucose to the
brain for the generation of ATP).
Connie also noted the symptoms that are
part of the adrenergic response to hypoglycemic stress. Stimulation of the sympathetic
nervous system (because of the low levels of
glucose reaching the brain) results in the release of epinephrine, a stress hormone, from
the adrenal medulla. Elevated epinephrine levels cause tachycardia (rapid heart rate), palpitations, anxiety, tremulousness, pallor, and
sweating.
In addition to the symptoms described by
Connie C., individuals may experience confusion, light-headedness, headache, aberrant
behavior, blurred vision, loss of consciousness,
or seizures. When severe or prolonged, death
may occur.
Lieberman_Ch21.indd 332
hormones, such as epinephrine, norepinephrine, and cortisol, will be described and
compared with insulin and glucagon.
Insulin is the major anabolic hormone that promotes the storage of nutrients: glucose storage as glycogen in liver and muscle, conversion of glucose to
triacylglycerols in liver and their storage in adipose tissue, and amino acid uptake
and protein synthesis in skeletal muscle (Fig. 21.3). It also increases the synthesis of
albumin and other proteins by the liver. Insulin promotes the use of glucose as a fuel
by facilitating its transport into muscle and adipose tissue. At the same time, insulin
acts to inhibit fuel mobilization.
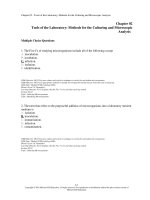
Glucagon acts to maintain fuel availability in the absence of dietary glucose by
stimulating the release of glucose from liver glycogen (see Chapter 23); by stimulating gluconeogenesis from lactate, glycerol, and amino acids (see Chapter 26); and,
in conjunction with decreased insulin, by mobilizing fatty acids from adipose triacylglycerols to provide an alternate source of fuel (see Chapter 20 and Fig. 21.4). Its
sites of action are principally the liver and adipose tissue; it has no influence on skeletal muscle metabolism because muscle cells lack glucagon receptors. The message
carried by glucagon is that “Glucose is gone”; that is, the current supply of glucose
is inadequate to meet the immediate fuel requirements of the body.
The release of insulin from the β-cells of the pancreas is dictated primarily by the
level of glucose bathing the β-cells in the islets of Langerhans. The highest levels
of insulin occur approximately 30 to 45 minutes after a high-carbohydrate meal
(Fig. 21.5). They return to basal levels as the blood glucose concentration falls, approximately 120 minutes after the meal. The release of glucagon from the α-cells
of the pancreas, conversely, is controlled principally through a reduction of glucose
and/or a rise in the concentration of insulin in blood, bathing the α-cells in the
pancreas. Therefore, the lowest levels of glucagon occur after a high-carbohydrate
meal. Because all of the effects of glucagon are opposed by insulin, the simultaneous stimulation of insulin release and suppression of glucagon secretion by a
high-carbohydrate meal provides integrated control of carbohydrate, fat, and protein
metabolism.
Insulin and glucagon are not the only regulators of fuel metabolism. The intertissue balance between the use and storage of glucose, fat, and protein is also accom-
9/16/14 2:04 AM
CHAPTER 21 ■ BASIC CONCEPTS IN THE REGULATION OF FUEL METABOLISM
–
Highcarbohydrate
meal
Liver
Glycogen
333
+
Glucose
mg/dL
120
–
+
Fatty acids
100
Glucose
80
Amino
acids
120
μU/mL
Glucose
Fatty acids
Fatty acids
+
Triacylglycerols
No
effect
80
Insulin
40
0
Skeletal
muscle
120
pg/mL
Adipocyte
FIG. 21.4. Major sites of glucagon action in fuel metabolism. ᮍ, pathways stimulated by
glucagon; ᮎ, pathways inhibited by glucagon.
Glucagon
110
100
90
60
0
60
120
180
240
Minutes
plished by the circulating levels of metabolites in the blood, by neuronal signals,
and by the other hormones of metabolic homeostasis (epinephrine, norepinephrine,
cortisol, and others) (Table 21.1). These hormones oppose the actions of insulin
by mobilizing fuels. Like glucagon, they are insulin counterregulatory hormones
(Fig. 21.6). Of all these hormones, only insulin and glucagon are synthesized and
released in direct response to changing levels of fuels in the blood. The release of
cortisol, epinephrine, and norepinephrine is mediated by neuronal signals. Rising
levels of the insulin counterregulatory hormones in the blood reflect, for the most
part, a current increase in the demand for fuel.
FIG. 21.5. Blood glucose, insulin, and glucagon levels after a high-carbohydrate meal.
Table 21.1 Physiological Actions of Insulin and Insulin Counterregulatory
Hormones
Hormone
Function
Major Metabolic Pathways Affected
Insulin
• Promotes fuel storage after
a meal
• Promotes growth
Glucagon
• Mobilizes fuels
• Stimulates glucose storage as
glycogen (muscle and liver)
• Stimulates fatty acid synthesis and
storage after a high-carbohydrate meal
• Stimulates amino acid uptake and
protein synthesis
• Activates gluconeogenesis and
glycogenolysis (liver) during fasting
• Activates fatty acid release from
adipose tissue
• Stimulates glucose production from
glycogen (muscle and liver)
• Stimulates fatty acid release from
adipose issue
• Stimulates amino acid mobilization
from muscle protein
• Stimulates gluconeogenesis to
produce glucose for liver glycogen
synthesis
• Stimulates fatty acid release from
adipose tissue
Epinephrine
Cortisol
Lieberman_Ch21.indd 333
• Maintains blood glucose levels
during fasting
• Mobilizes fuels during acute
stress
• Provides for changing requirements during stress
9/16/14 2:04 AM
334
SECTION V ■ CARBOHYDRATE METABOLISM
Low Blood Glucose
Hypothalamic regulatory
center
Pituitary
ACTH
Autonomic nervous system
␣-Cells
The message that insulin carries to
tissues is that glucose is plentiful
and can be used as an immediate
fuel or can be converted to storage forms such
as triacylglycerol in adipocytes or glycogen in
liver and muscle.
Because insulin stimulates the uptake of
glucose into tissues where it may be immediately oxidized or stored for later oxidation, this
regulatory hormone lowers blood glucose levels. Therefore, one of the possible causes of
Connie C.’s hypoglycemia is an insulinoma, a
tumor that produces excessive insulin.
Cortex
Medulla
Adrenal
Cortisol
Epinephrine
Pancreas
Norepinephrine
Glucagon
FIG. 21.6. Major insulin counterregulatory hormones. The stress of a low blood glucose
level mediates the release of the major insulin counterregulatory hormones through neuronal signals. Hypoglycemia is one of the stress signals that stimulates the release of cortisol,
epinephrine, and norepinephrine. Adrenocorticotropic hormone (ACTH) is released from the
pituitary and stimulates the release of cortisol (a glucocorticoid) from the adrenal cortex.
Neuronal signals stimulate the release of epinephrine from the adrenal medulla and norepinephrine from nerve endings. Neuronal signals also play a minor role in the release of
glucagon. Although norepinephrine has counterregulatory actions, it is not a major counterregulatory hormone.
III. SYNTHESIS AND RELEASE OF INSULIN AND GLUCAGON
A. Endocrine Pancreas
Whenever an endocrine gland continues to release its hormone in
spite of the presence of signals that
normally would suppress its secretion, this
persistent inappropriate release is said to be
“autonomous.” Secretory neoplasms of endocrine glands generally produce their hormonal
product autonomously in a chronic fashion.
Autonomous hypersecretion of insulin from
a suspected pancreatic β-cell tumor (an insulinoma) can be demonstrated in several ways. The
simplest test is to simultaneously draw blood for
the measurement of both glucose and insulin at
a time when the patient is spontaneously experiencing the characteristic adrenergic or neuroglycopenic symptoms of hypoglycemia. During
such a test, Connie C.’s glucose levels fell to
45 mg/dL (normal ϭ 80 to 100 mg/dL), and her
ratio of insulin to glucose was far higher than
normal. The elevated insulin levels markedly
increased glucose uptake by the peripheral tissues, resulting in a dramatic lowering of blood
glucose levels. In normal individuals, as blood
glucose levels drop, insulin levels also drop.
Lieberman_Ch21.indd 334
Insulin and glucagon are synthesized in different cell types of the endocrine pancreas,
which consists of microscopic clusters of small glands, the islets of Langerhans,
scattered among the cells of the exocrine pancreas. The α-cells secrete glucagon,
and the β-cells secrete insulin into the hepatic portal vein via the pancreatic veins.
B. Synthesis and Secretion of Insulin
Insulin is a polypeptide hormone. The active form of insulin is composed of two
polypeptide chains (the A chain and the B chain) linked by two interchain disulfide
bonds. The A chain has an additional intrachain disulfide bond (Fig. 21.7).
Insulin, like many other polypeptide hormones, is synthesized as a preprohormone
that is converted in the rough endoplasmic reticulum (RER) to proinsulin. The “pre-”
sequence, a short hydrophobic signal sequence at the N-terminal end, is cleaved as
it enters the lumen of the RER. Proinsulin folds into the proper conformation and
disulfide bonds are formed between the cysteine residues. It is then transported in
microvesicles to the Golgi complex. It leaves the Golgi complex in storage vesicles,
where a protease removes the biologically inactive “connecting peptide” (C-peptide)
and a few small remnants, resulting in the formation of biologically active insulin (see
Fig. 21.7). Zinc ions are also transported in these storage vesicles. Cleavage of the
C-peptide decreases the solubility of the resulting insulin, which then coprecipitates
with zinc. Exocytosis of the insulin storage vesicles from the cytosol of the β-cell into
the blood is stimulated by rising levels of glucose in the blood bathing the β-cells.
Glucose enters the β-cell via specific glucose transporter proteins known as GLUT2
(see Chapter 22). Glucose is phosphorylated through the action of glucokinase to form
glucose-6-phosphate, which is metabolized through glycolysis, the tricarboxylic acid
9/16/14 2:04 AM
CHAPTER 21 ■ BASIC CONCEPTS IN THE REGULATION OF FUEL METABOLISM
335
20
Ala
Leu Ser Gly Ala Gly Pro
Pro Gln
Gly Gly
Leu
Leu
Gly
C-Peptide
Glu
Leu
Glu
Val
Gly
Gln
Ser
31
Gly
Leu
Val
Gln
Lys
Gln
Arg
Leu
Gly
Asp
Ile
Val
NH2
Asn
Glu
Phe
A-Chain
S
Gln
Glu
Thr
Gln
S
Gln
Ser Ile
Cys Ser Leu Tyr
Arg
Leu
S
Thr
Lys
10
S
Insulin
Thr
S
Gly
His
Tyr
Phe
B-Chain
Leu
10
30
Pro
Cys
Ser
Arg
Asn
Cys
Asn
Glu 1
Tyr
S
Cys
Leu
Ala
21
Cys
Val
His
Glu
COOH
Glu
Val Glu
Gly
Ala Leu Tyr
Leu Val Cys
20
Arg
Gly
Phe
FIG. 21.7. Cleavage of proinsulin to insulin. Proinsulin is converted to insulin by proteolytic cleavage, which removes the C-peptide and a few
additional amino acid residues. Cleavage occurs at the arrows. (From Murray RK, et al. Harper’s Biochemistry, 23rd Ed. Stanford, CT: Appleton
& Lange, 1993:560.)
(TCA) cycle, and oxidative phosphorylation. These reactions result in an increase in
ATP levels within the β-cell (circle 1 in Fig. 21.8). As the β-cell [ATP]/[ADP] ratio
increases, the activity of a membrane-bound, ATP-dependent Kϩ channel (KϩATP) is
inhibited (i.e., the channel is closed) (circle 2 in Fig. 21.8). The closing of this channel leads to a membrane depolarization (as the membrane is normally hyperpolarized,
see circle 3, Fig. 21.8), which activates a voltage-gated Ca2ϩ channel that allows Ca2ϩ
to enter the β-cell such that intracellular Ca2ϩ levels increase significantly (circle 4,
Fig. 21.8). The increase in intracellular Ca2ϩ stimulates the fusion of insulin containing
exocytotic vesicles with the plasma membrane, resulting in insulin secretion (circle 5,
Fig. 21.8). Thus, an increase in glucose levels within the β-cells initiates insulin release.
Ca2+
+
⌬
3
[Ca2+]
K+
4
Fusion and
exocytosis
Glucose
5
–
Insulin
2
Glycolysis
1
TCA cycle
Oxidative
phosphorylation
ATP
-Cell
FIG. 21.8. Release of insulin by the β-cells. Details are provided in the text.
Lieberman_Ch21.indd 335
9/16/14 2:04 AM
336
SECTION V ■ CARBOHYDRATE METABOLISM
A rare form of diabetes known as maturity-onset diabetes of the young (MODY)
results from mutations in either pancreatic glucokinase or specific nuclear transcription factors. MODY type 2 is caused by a glucokinase mutation that results in
an enzyme with reduced activity because of either an elevated Km for glucose or a reduced
Vmax for the reaction. Because insulin release depends on normal glucose metabolism within
the β-cell that yields a critical [ATP]/[ADP] ratio in the β-cell, individuals with this glucokinase mutation cannot significantly metabolize glucose unless glucose levels are higher than
normal. Thus, although these patients can release insulin, they do so at higher than normal
glucose levels and are, therefore, almost always in a hyperglycemic state. Interestingly, however, these patients are somewhat resistant to the long-term complications of chronic hyperglycemia. The mechanism for this seeming resistance is not well understood.
Neonatal diabetes is an inherited disorder in which newborns develop diabetes within
the first 3 months of life. The diabetes may be permanent, requiring lifelong insulin treatment,
or transient. The most common mutation leading to permanent neonatal diabetes is in the
KCNJ11 gene, which encodes a subunit of the KϩATP channel in various tissues including the
pancreas. This is an activating mutation, which keeps the KϩATP channel open and less susceptible to ATP inhibition. If the KϩATP channel cannot be closed, activation of the Ca2ϩ channel will not occur and insulin secretion will be impaired.
C. Stimulation and Inhibition of Insulin Release
Deborah S. is taking a sulfonylurea
compound known as glipizide to
treat her diabetes. The sulfonylureas
act on the KϩATP channels on the surface of the
pancreatic β-cells. The KϩATP channels contain
pore-forming subunits (encoded by the KCNJ11
gene) and regulatory subunits (the subunit to
which sulfonylurea compounds bind encoded
by the SUR1 gene). The binding of the drug to
the sulfonylurea receptor closes Kϩ channels
(as do elevated ATP levels), which, in turn, increases Ca2ϩ movement into the interior of the
β-cell. This influx of calcium modulates the interaction of the insulin storage vesicles with
the plasma membrane of the β-cell, resulting in
the release of insulin into the circulation.
Measurements of proinsulin and the
connecting peptide between the αand β-chains of insulin (C-peptide)
in Connie C.’s blood during her hospital fast
provided confirmation that she had an insulinoma. Insulin and C-peptide are secreted in approximately equal proportions from the β-cell,
but C-peptide is not cleared from the blood
as rapidly as insulin. Therefore, it provides a
reasonably accurate estimate of the rate of
insulin secretion. Plasma C-peptide measurements could also be potentially useful in treating patients with diabetes mellitus because
they provide a way to estimate the degree of
endogenous insulin secretion in patients who
are receiving exogenous insulin, which lacks
the C-peptide.
Lieberman_Ch21.indd 336
The release of insulin occurs within minutes after the pancreas is exposed to a high
glucose concentration. The threshold for insulin release is approximately 80 mg
glucose/dL. Above 80 mg/dL, the rate of insulin release is not an all-or-nothing response but is proportional to the glucose concentration up to approximately 300 mg/
dL glucose. As insulin is secreted, the synthesis of new insulin molecules is stimulated, so that secretion is maintained until blood glucose levels fall. Insulin is rapidly
removed from the circulation and degraded by the liver (and, to a lesser extent, by
kidney and skeletal muscle), so that blood insulin levels decrease rapidly once the
rate of secretion slows.
Several factors other than the blood glucose concentration can modulate insulin
release. The pancreatic islets are innervated by the autonomic nervous system, including a branch of the vagus nerve. These neural signals help to coordinate insulin
release with the secretory signals initiated by the ingestion of fuels. However, signals
from the central nervous system are not required for insulin secretion. Certain amino
acids also can stimulate insulin secretion, although the amount of insulin released during a high-protein meal is very much lower than that released by a high-carbohydrate
meal. Gastric inhibitory polypeptide (GIP) and glucagonlike peptide 1 (GLP-1), gut
hormones released after the ingestion of food, also aid in the onset of insulin release.
Epinephrine, secreted in response to fasting, stress, trauma, and vigorous exercise,
decreases the release of insulin. Epinephrine release signals energy utilization, which
indicates that less insulin needs to be secreted, as insulin stimulates energy storage.
D. Synthesis and Secretion of Glucagon
Glucagon, a polypeptide hormone, is synthesized in the α-cells of the pancreas by
cleavage of the much larger preproglucagon, a 160–amino acid peptide. Like insulin, preproglucagon is produced on the RER and is converted to proglucagon as it
enters the endoplasmic reticulum (ER) lumen. Proteolytic cleavage at various sites
produces the mature 29–amino acid glucagon (molecular weight 3,500) and larger
glucagon-containing fragments (named glucagonlike peptides 1 and 2). Glucagon is
rapidly metabolized, primarily in the liver and kidneys. Its plasma half-life is only
about 3 to 5 minutes.
Glucagon secretion is regulated principally by circulating levels of glucose and
insulin. Increasing levels of each inhibit glucagon release. Glucose probably has
both a direct suppressive effect on secretion of glucagon from the α-cell as well
as an indirect effect, the latter being mediated by its ability to stimulate the release
9/16/14 2:04 AM
Glucose (mg/dL)
Highprotein
meal
Nitrogen
90
85
6
7
8
Glucose
20
Insulin
10
Glucagon (pg/mL)
200
Glucagon
180
337
Insulin (U/mL) ␣-Amino nitrogen (mg/dL)
CHAPTER 21 ■ BASIC CONCEPTS IN THE REGULATION OF FUEL METABOLISM
160
140
120
100
–60
0
60
120 180 240
Minutes
FIG. 21.9. Release of insulin and glucagon in response to a high-protein meal. This figure
shows the increase in the release of insulin and glucagon into the blood after an overnight fast
followed by the ingestion of 100 g protein (equivalent to a slice of roast beef). Insulin levels
do not increase nearly as much as they do after a high-carbohydrate meal (see Fig. 21.5). The
levels of glucagon, however, significantly increase above those present in the fasting state.
of insulin. The direction of blood flow in the islets of the pancreas carries insulin
from the β-cells in the center of the islets to the peripheral α-cells, where it suppresses glucagon secretion.
Conversely, certain hormones stimulate glucagon secretion. Among these are the
catecholamines (including epinephrine) and cortisol.
Many amino acids also stimulate glucagon release (Fig. 21.9). Thus, the high
levels of glucagon that would be expected in the fasting state do not decrease after a
high-protein meal. In fact, glucagon levels may increase, stimulating gluconeogenesis in the absence of dietary glucose. The relative amounts of insulin and glucagon
in the blood after a mixed meal depend on the composition of the meal, because glucose stimulates insulin release and amino acids stimulate glucagon release. However,
amino acids also induce insulin secretion but not to the same extent that glucose does.
Although this may seem paradoxical, it actually makes good sense. Insulin release
stimulates amino acid uptake by tissues and enhances protein synthesis. However,
because glucagon levels also increase in response to a protein meal and the critical
factor is the insulin to glucagon ratio, sufficient glucagon is released that gluconeogenesis is enhanced (at the expense of protein synthesis), and the amino acids that
are taken up by the tissues serve as a substrate for gluconeogenesis. The synthesis
of glycogen and triglycerides is also reduced when glucagon levels rise in the blood.
IV. MECHANISMS OF HORMONE ACTION
For a hormone to affect the flux of substrates through a metabolic pathway, it must be
able to change the rate at which that pathway proceeds by increasing or decreasing
the rate of the slowest step(s). Either directly or indirectly, hormones affect the activity of specific enzymes or transport proteins that regulate the flux through a pathway.
Thus, ultimately, the hormone must either cause the amount of the substrate for the
enzyme to increase (if substrate supply is a rate-limiting factor), change the conformation at the active site by phosphorylating the enzyme, change the concentration of
Lieberman_Ch21.indd 337
Patients with type 1 diabetes mellitus, such as Dianne A., have almost
undetectable levels of insulin in their
blood. Patients with type 2 diabetes mellitus,
such as Deborah S., conversely, have normal
or even elevated levels of insulin in their blood;
however, the level of insulin in their blood is
inappropriately low relative to their elevated
blood glucose concentration. In type 2 diabetes mellitus, skeletal muscle, liver, and other
tissues exhibit a resistance to the actions of
insulin. As a result, insulin has a smaller than
normal effect on glucose and fat metabolism
in such patients. Levels of insulin in the blood
must be higher than normal to maintain normal blood glucose levels. In the early stages of
type 2 diabetes mellitus, these compensatory
adjustments in insulin release may keep the
blood glucose levels near the normal range.
Over time, as the β-cells’ capacity to secrete
high levels of insulin declines, blood glucose
levels increase, and exogenous insulin becomes necessary.
9/16/14 2:04 AM
338
SECTION V ■ CARBOHYDRATE METABOLISM
During the “stress” of hypoglycemia, the autonomic nervous system
stimulates the pancreas to secrete
glucagon, which tends to restore the serum
glucose level to normal. The increased activity of the adrenergic nervous system (through
epinephrine) also alerts a patient, such as
Connie C., to the presence of increasingly severe hypoglycemia. Hopefully, this will induce
the patient to ingest simple sugars or other carbohydrates, which, in turn, will also increase
glucose levels in the blood. Connie C. gained
8 lb before resection of her pancreatic insulinsecreting adenoma through this mechanism.
an allosteric effector of the enzyme, or change the amount of the protein by inducing
or repressing its synthesis or by changing its turnover rate or location. Insulin, glucagon, and other hormones use all of these regulatory mechanisms to regulate the rate
of flux in metabolic pathways. The effects mediated by phosphorylation or changes
in the kinetic properties of an enzyme occur rapidly within minutes. In contrast,
it may take hours for induction or repression of enzyme synthesis to change the
amount of an enzyme in the cell.
The details of hormone action were previously described in Chapter 8 and are
only summarized here.
A. Signal Transduction by Hormones that Bind to
Plasma Membrane Receptors
Hormones initiate their actions on target cells by binding to specific receptors or
binding proteins. In the case of polypeptide hormones (such as insulin and glucagon) and catecholamines (epinephrine and norepinephrine), the action of the hormone is mediated through binding to a specific receptor on the plasma membrane.
The first message of the hormone is transmitted to intracellular enzymes by the activated receptor and an intracellular second messenger; the hormone does not need
to enter the cell to exert its effects. (In contrast, steroid hormones such as cortisol
and the thyroid hormone triiodothyronine [T3] enter the cytosol and eventually move
into the cell nucleus to exert their effects.)
The mechanism by which the message carried by the hormone ultimately affects
the rate of the regulatory enzyme in the target cell is called signal transduction.
The three basic types of signal transduction for hormones binding to receptors on
the plasma membrane are (a) receptor coupling to adenylate cyclase which produces cyclic adenosine monophosphate (cAMP), (b) receptor kinase activity, and
(c) receptor coupling to hydrolysis of phosphatidylinositol bisphosphate (PIP2). The
hormones of metabolic homeostasis each use one of these mechanisms to carry out
their physiological effect. In addition, some hormones and neurotransmitters act
through receptor coupling to gated ion channels (previously described in Chapter 8).
1.
SIGNAL TRANSDUCTION BY INSULIN
Insulin initiates its action by binding to a receptor on the plasma membrane of
insulin’s many target cells (see Fig. 8.12). The insulin receptor has two types of
subunits: the α-subunits to which insulin binds, and the β-subunits, which span the
membrane and protrude into the cytosol. The cytosolic portion of the β-subunit has
tyrosine kinase activity. On binding of insulin, the tyrosine kinase phosphorylates
tyrosine residues on the β-subunit (autophosphorylation) as well as on several other
enzymes within the cytosol. A principal substrate for phosphorylation by the receptor, insulin receptor substrate 1 (IRS-1), then recognizes and binds to various signal
transduction proteins in regions referred to as SH2 domains. IRS-1 is involved in
many of the physiological responses to insulin through complex mechanisms that
are the subject of intensive investigation. The basic tissue-specific cellular responses
to insulin, however, can be grouped into five major categories: (a) insulin reverses
glucagon-stimulated phosphorylation, (b) insulin works through a phosphorylation
cascade that stimulates the phosphorylation of several enzymes, (c) insulin induces
and represses the synthesis of specific enzymes, (d) insulin acts as a growth factor
and has a general stimulatory effect on protein synthesis, and (e) insulin stimulates
glucose and amino acid transport into cells (Fig. 21.10).
Several mechanisms have been proposed for the action of insulin in reversing
glucagon-stimulated phosphorylation of the enzymes of carbohydrate metabolism.
From the student’s point of view, the ability of insulin to reverse glucagon-stimulated phosphorylation occurs as if it were lowering cAMP and stimulating phosphatases that could remove those phosphates added by protein kinase A. In reality, the
mechanism is more complex and still not fully understood.
Lieberman_Ch21.indd 338
9/16/14 2:04 AM
CHAPTER 21 ■ BASIC CONCEPTS IN THE REGULATION OF FUEL METABOLISM
Glucagon release
339
Insulin release
Blood glucose
Glycogenolysis
Glycogen synthesis
Gluconeogenesis
Fatty acid synthesis
Lipolysis
Triglyceride synthesis
Liver glycolysis
Liver glycolysis
FIG. 21.10. Pathways regulated by the release of glucagon (in response to a lowering of
blood glucose levels) and insulin (released in response to an elevation of blood glucose
levels). Tissue-specific differences occur in the response to these hormones, as detailed in
subsequent chapters of this text.
2.
SIGNAL TRANSDUCTION BY GLUCAGON
The pathway for signal transduction by glucagon is one that is common to several hormones; the glucagon receptor is coupled to adenylate cyclase and cAMP
production (see Fig. 8.13). Glucagon, through G proteins, activates the membranebound adenylate cyclase, increasing the synthesis of the intracellular second messenger 3Ј,5Ј-cyclic AMP (cAMP) (see Fig. 7.9A). cAMP activates protein kinase
A (cAMP-dependent protein kinase), which changes the activity of enzymes by
phosphorylating them at specific serine residues. Phosphorylation activates some
enzymes and inhibits others.
The G proteins, which couple the glucagon receptor to adenylate cyclase, are proteins in the plasma membrane that bind guanosine triphosphate (GTP) and have dissociable subunits that interact with both the receptor and adenylate cyclase. In the
absence of glucagon, the stimulatory Gs protein complex binds guanosine diphosphate
(GDP) but cannot bind to the unoccupied receptor or adenylate cyclase (see Fig. 8.14).
Once glucagon binds to the receptor, the receptor also binds the Gs complex, which
then releases GDP and binds GTP. The α-subunit then dissociates from the βγ-subunits
and binds to adenylate cyclase, thereby activating it. As the GTP on the α-subunit is
hydrolyzed to GDP, the subunit dissociates and recomplexes with the β- and γ-subunits.
Only continued occupancy of the glucagon receptor can keep adenylate cyclase active.
Although glucagon works by activating adenylate cyclase, a few hormones inhibit adenylate cyclase. In this case, the inhibitory G protein complex is called a
Gi complex.
cAMP is very rapidly degraded to AMP by a membrane-bound phosphodiesterase. The concentration of cAMP is thus very low in the cell so changes in its concentration can occur rapidly in response to changes in the rate of synthesis. The amount
of cAMP present at any time is a direct reflection of hormone binding and the activity of adenylate cyclase. It is not affected by ATP, ADP, or AMP levels in the cell.
cAMP transmits the hormone signal to the cell by activating protein kinase A
(cAMP-dependent protein kinase). As cAMP binds to the regulatory subunits of
protein kinase A, these subunits dissociate from the catalytic subunits, which are
thereby activated. Activated protein kinase A phosphorylates serine residues of key
regulatory enzymes in the pathways of carbohydrate and fat metabolism. Some enzymes are activated and others are inhibited by this change in phosphorylation state.
The message of the hormone is terminated by the action of semispecific protein
phosphatases that remove phosphate groups from the enzymes. The activity of the
protein phosphatases is also controlled through hormonal regulation.
Changes in the phosphorylation state of proteins that bind to cAMP response elements (CREs) in the promoter region of genes contribute to the regulation of gene transcription by several cAMP-coupled hormones (see Chapter 13). For instance, cAMP
response element binding protein (CREB) is directly phosphorylated by protein kinase
A, a step essential for the initiation of transcription. Phosphorylation at other sites on
CREB, by a variety of kinases, may also play a role in regulating transcription.
Lieberman_Ch21.indd 339
cAMP is the intracellular second
messenger for a number of hormones that regulate fuel metabolism.
The specificity of the physiological response to
each hormone results from the presence of
specific receptors for that hormone in target
tissues. For example, glucagon activates glucose production from glycogen in liver but not
in skeletal muscle because glucagon receptors
are present in liver but absent in skeletal muscle. However, skeletal muscle has adenylate
cyclase, cAMP, and protein kinase A, which
can be activated by epinephrine binding to the
β2-receptors in the membrane of muscle cells.
Liver cells also have epinephrine receptors.
Phosphodiesterase is inhibited by
methylxanthines, a class of compounds
that includes caffeine. Would the effect
of a methylxanthine on fuel metabolism be similar
to fasting or to a high-carbohydrate meal?
9/16/14 2:04 AM
340
SECTION V ■ CARBOHYDRATE METABOLISM
Inhibition of phosphodiesterase by
methylxanthine would increase cAMP
and have the same effects on fuel metabolism as would an increase of glucagon and
epinephrine, as in the fasted state. Increased
fuel mobilization would occur through glycogenolysis (the release of glucose from glycogen)
and through lipolysis (the release of fatty acids
from triacylglycerols).
The mechanism for signal transduction by glucagon illustrates some of the important principles of hormonal signaling mechanisms. The first principle is that specificity of action in tissues is conferred by the receptor on a target cell for glucagon.
In general, the major actions of glucagon occur in liver, adipose tissue, and certain
cells of the kidney that contain glucagon receptors. The second principle is that signal transduction involves amplification of the first message. Glucagon and other hormones are present in the blood in very low concentrations. However, these minute
concentrations of hormone are adequate to initiate a cellular response because the
binding of one molecule of glucagon to one receptor ultimately activates many protein kinase A molecules, each of which phosphorylates hundreds of downstream enzymes. The third principle involves integration of metabolic responses. For instance,
the glucagon-stimulated phosphorylation of enzymes simultaneously activates glycogen degradation, inhibits glycogen synthesis, and inhibits glycolysis in the liver (see
Fig. 21.10). The fourth principle involves augmentation and antagonism of signals. An
example of augmentation involves the actions of glucagon and epinephrine (which is
released during exercise). Although these hormones bind to different receptors, each
can increase cAMP and stimulate glycogen degradation. A fifth principle is that of
rapid signal termination. In the case of glucagon, both the termination of the Gs protein activation and the rapid degradation of cAMP contribute to signal termination.
B. Signal Transduction by Cortisol and Other Hormones that
Interact with Intracellular Receptors
Signal transduction by the glucocorticoid cortisol and other steroids that have glucocorticoid activity and by thyroid hormone involves hormone binding to intracellular
(cytosolic) receptors or binding proteins, after which this hormone-binding protein
complex, if not already in the nucleus, moves into the nucleus, where it interacts with
chromatin. This interaction changes the rate of gene transcription in the target cells
(see Chapter 13). The cellular responses to these hormones continue as long as the target cell is exposed to the specific hormones. Thus, disorders that cause a chronic excess in their secretion will result in an equally persistent influence on fuel metabolism.
For example, chronic stress such as that seen in prolonged sepsis may lead to varying
degrees of glucose intolerance if high levels of epinephrine and cortisol persist.
The effects of cortisol on gene transcription are usually synergistic to those of
certain other hormones. For instance, the rates of gene transcription for some of the
enzymes in the pathway for glucose synthesis from amino acids (gluconeogenesis)
are induced by glucagon as well as by cortisol.
C. Signal Transduction by Epinephrine and Norepinephrine
HO
HO
H
O
H CH3
C
C NH
H
Epinephrine
HO
HO
H
H
O
H
C
C NH2
H H
Norepinephrine
FIG. 21.11. Structure of epinephrine and norepinephrine. Epinephrine and norepinephrine
are synthesized from tyrosine and act as both
hormones and neurotransmitters. They are catecholamines, the term catechol referring to a
ring structure containing two hydroxyl groups.
Lieberman_Ch21.indd 340
Epinephrine and norepinephrine are catecholamines (Fig. 21.11). They can act as
neurotransmitters or as hormones. A neurotransmitter allows a neural signal to be
transmitted across the juncture or synapse between the nerve terminal of a proximal
nerve axon and the cell body of a distal neuron. A hormone, conversely, is released
into the blood and travels in the circulation to interact with specific receptors on the
plasma membrane or cytosol of the target organ. The general effect of these catecholamines is to prepare us for fight or flight. Under these acutely stressful circumstances, these “stress” hormones increase fuel mobilization, cardiac output, blood
flow, and so on, which enable us to meet these stresses. The catecholamines bind to
adrenergic receptors (the term adrenergic refers to nerve cells or fibers that are part
of the involuntary or autonomic nervous system, a system that employs norepinephrine as a neurotransmitter).
There are nine different types of adrenergic receptors: α1A, α1B, α1D, α2A, α2B,
α2C, β1, β2, and β3. Only the three β- and α1- receptors are discussed here. The three
β-receptors work through the adenylate cyclase–cAMP system, activating a Gs protein,
which activates adenylate cyclase, and eventually protein kinase A. The β1-receptor is
the major adrenergic receptor in the human heart and is primarily stimulated by norepinephrine. On activation, the β1-receptor increases the rate of muscle contraction.
9/16/14 2:04 AM
CHAPTER 21 ■ BASIC CONCEPTS IN THE REGULATION OF FUEL METABOLISM
341
The β2-receptor is present in liver, skeletal muscle, and other tissues and is involved
in the mobilization of fuels (such as the release of glucose through glycogenolysis). It
also mediates vascular, bronchial, and uterine smooth muscle contraction. Epinephrine
is a much more potent agonist for this receptor than norepinephrine, whose major action is neurotransmission. The β3-receptor is found predominantly in adipose tissue
and to a lesser extent in skeletal muscle. Activation of this receptor stimulates fatty acid
oxidation and thermogenesis, and agonists for this receptor may prove to be beneficial
weight loss agents. The α1-receptors, which are postsynaptic receptors, mediate vascular and smooth muscle contraction as well as glycogenolysis in liver. The α1-receptors
work through the PIP2 system via activation of a Gq protein and phospholipase C-β.
CLINICAL COMMENTS
Diseases discussed in this chapter are summarized in Table 21.2.
Deborah S. Deborah S. has type 2 diabetes mellitus (formerly called
non–insulin-dependent diabetes mellitus), whereas Dianne A. has type 1
diabetes mellitus (formally designated insulin-dependent diabetes mellitus). Although the pathogenesis differs for these major forms of diabetes mellitus,
both cause varying degrees of hyperglycemia. In type 1 diabetes mellitus, the pancreatic β-cells are gradually destroyed by antibodies directed at a variety of proteins
within the β-cells. As insulin secretory capacity by the β-cells gradually diminishes
below a critical level, the symptoms of chronic hyperglycemia develop rapidly. In
type 2 diabetes mellitus, these symptoms develop more subtly and gradually over
the course of months or years. Eighty-five percent or more of type 2 patients are
obese and, like Ivan A., have a high waist-hip ratio with regard to adipose tissue disposition. This abnormal distribution of fat in the visceral (peri-intestinal) adipocytes
is associated with reduced sensitivity of fat cells, muscle cells, and liver cells to
the actions of insulin outlined previously. This insulin resistance can be diminished
through weight loss, specifically in the visceral depots.
Connie C. Connie C. underwent an ultrasonographic (ultrasound) study
of her upper abdomen, which showed a 2.6-cm mass in the midportion of
her pancreas. With this finding, her physicians decided that further noninvasive studies would not be necessary before surgery and removal of the mass. At
the time of surgery, a yellow-white 2.8-cm mass consisting primarily of insulin-rich
β-cells was resected from her pancreas. No cytologic changes of malignancy were
seen on cytologic examination of the surgical specimen, and no evidence of malignant behavior by the tumor (such as local metastases) was found. Connie had an uneventful postoperative recovery and no longer experienced the signs and symptoms
of insulin-induced hypoglycemia.
Table 21.2
Diseases Discussed in Chapter 21
Disease or Disorder
Environmental or
Genetic
Type 2 diabetes
Both
Insulinoma
Both
Hyperglycemia
Both
Type 1 diabetes
Both
Maturity onset diabetes
of the young
Neonatal diabetes
Genetic
Lieberman_Ch21.indd 341
Deborah S., a patient with type 2
diabetes mellitus, is experiencing
insulin resistance. Her levels of circulating insulin are normal to high, although
inappropriately low for her elevated level of
blood glucose. However, her insulin target
cells, such as muscle and fat, do not respond
as those of a nondiabetic subject would to this
level of insulin. For most type 2 patients, the
site of insulin resistance is subsequent to binding of insulin to its receptor; that is, the number of receptors and their affinity for insulin is
near normal. However, the binding of insulin at
these receptors does not elicit most of the normal intracellular effects of insulin discussed
previously. Consequently, there is little stimulation of glucose metabolism and storage after a
high-carbohydrate meal and little inhibition of
hepatic gluconeogenesis.
Genetic
Comments
Emergence of insulin resistance due to a wide variety of causes; tissues do not respond to
insulin as they normally would.
Periodic release of insulin from a tumor of the β-cells, leading to hypoglycemic symptoms,
which are accompanied by excessive appetite and weight gain.
Constantly elevated levels of glucose in the circulation due to a wide variety of causes. Hyperglycemia leads to protein glycation and potential loss of protein function in a variety of tissues.
No production of insulin by the β-cells due to an autoimmune destruction of the β-cells.
Hyperglycemia and ketoacidosis may result from the lack of insulin.
Form of diabetes caused by specific mutations, such as a mutation in pancreatic glucokinase,
which alters the set point for insulin release from the β-cells.
One cause of neonatal diabetes is a mutation in a subunit of the potassium channel in various tissues. Such a mutation in the pancreas leads to permanent opening of the potassium channel,
keeping intracellular calcium levels low and difficulty in releasing insulin from the β-cells.
9/16/14 2:04 AM
342
SECTION V ■ CARBOHYDRATE METABOLISM
REVIEW QUESTIONS-CHAPTER 21
1.
2.
3.
A patient with type I diabetes mellitus takes an insulin injection before eating dinner but then gets distracted and
does not eat. About 3 hours later, the patient becomes
shaky, sweaty, and confused. These symptoms have occurred due to which one of the following?
A. Low blood glucose levels
B. Increased glucagon release from the pancreas
C. Decreased glucagon release from the pancreas
D. High blood glucose levels
E. Elevated blood ketone levels
Caffeine is a potent inhibitor of the enzyme cAMP phosphodiesterase. Which one of the following consequences
would you expect to occur in the liver after drinking two
cups of strong expresso coffee?
A. An inhibition of protein kinase A
B. An enhancement of glycolytic activity
C. A reduced rate of glucose export to the circulation
D. A prolonged response to insulin
E. A prolonged response to glucagon
Assume that a rise in blood glucose concentration from 5
to 10 mM would result in insulin release by the pancreas.
A mutation in pancreatic glucokinase can lead to MODY
due to which one of the following within the pancreatic
β-cell?
A. An inability to raise cAMP levels
B. An inability to raise ATP levels
Lieberman_Ch21.indd 342
C. An inability to stimulate gene transcription
D. An inability to activate glycogen degradation
E. An inability to raise intracellular lactate levels
4.
A patient is rushed to the emergency room after a fainting
episode. Blood glucose levels were extremely low; insulin
levels were normal, but there was no detectable C-peptide.
The cause of the fainting episode may be due to which one
of the following?
A. An insulin-producing tumor
B. A glucagon-producing tumor
C. An overdose of glucagon
D. An overdose of insulin
E. An overdose of epinephrine
5.
Assume that an individual had a glucagon-secreting pancreatic tumor (glucagonoma). Which one of the following
is most likely to result from hyperglucagonemia?
A. Hypoglycemia
B. Weight loss
C. Increased muscle protein synthesis
D. Decreased lipolysis
E. Increased liver glycolytic rate
9/16/14 2:04 AM
22
Digestion, Absorption, and Transport
of Carbohydrates
CHAPTER OUTLINE
I. DIETARY CARBOHYDRATES
III. DIETARY FIBER
II. DIGESTION OF DIETARY CARBOHYDRATES
A. Salivary and pancreatic α-amylase
B. Disaccharidases of the intestinal brush
border membrane
1. Glucoamylase
2. Sucrase–isomaltase complex
3. Trehalase
4. β-Glycosidase complex (lactaseglucosylceramidase)
5. Location within the intestine
C. Metabolism of sugars by colonic bacteria
D. Lactose intolerance
1. Nonpersistent and persistent lactase
2. Intestinal injury
IV. ABSORPTION OF SUGARS
A. Absorption by the intestinal epithelium
1. Naϩ-dependent transporters
2. Facilitative glucose transporters
3. Galactose and fructose absorption
through glucose transporters
B. Transport of monosaccharides into tissues
V. GLUCOSE TRANSPORT THROUGH THE
BLOOD–BRAIN BARRIER AND INTO NEURONS
KEY POINTS
■
■
■
■
■
■
■
■
■
■
The major carbohydrates in the American diet are starch, lactose, and sucrose.
Starch is a polysaccharide composed of many glucose units linked together through α-1,4- and
α-1,6-glycosidic bonds (see Fig. 3.11).
Lactose is a disaccharide composed of glucose and galactose.
Sucrose is a disaccharide composed of glucose and fructose.
Digestion converts all dietary carbohydrates to their respective monosaccharides.
Amylase digests starch; it is found in the saliva and pancreas, which releases it into the small
intestine.
Intestinal epithelial cells contain disaccharidases, which cleave lactose, sucrose, and digestion
products of starch into monosaccharides.
Dietary fiber is composed of polysaccharides that cannot be digested by human enzymes.
Monosaccharides are transported into the absorptive intestinal epithelial cells via active transport
systems.
Monosaccharides released into the blood via the intestinal epithelial cells are recovered by tissues
that utilize facilitative transporters.
343
Lieberman_Ch22.indd 343
9/16/14 2:07 AM
344
SECTION V ■ CARBOHYDRATE METABOLISM
THE WAITING ROOM
Deborah S.’s fasting and postprandial blood glucose levels are frequently
above the normal range in spite of good compliance with insulin therapy.
Her physician has referred her to a dietician skilled in training diabetic
patients in the successful application of an appropriate American Diabetes Association diet. As part of the program, Ms. S. is asked to incorporate foods containing
fiber into her diet, such as whole grains (e.g., wheat, oats, corn), legumes (e.g., peas,
beans, lentils), tubers (e.g., potatoes, peanuts), and fruits.
The dietary sugar in fruit juice and
other sweets is sucrose, a disaccharide composed of glucose and fructose joined through their anomeric carbons.
Nina M.’s symptoms of pain and abdominal distension are caused by an inability to digest sucrose or absorb fructose, which are converted
to gas by colonic bacteria. Nina’s stool sample
had a pH of 5 and gave a positive test for sugar.
The possibility of carbohydrate malabsorption
was considered, and a hydrogen breath test
was recommended.
Nina M. is a 7-month-old baby girl, the second child born to unrelated parents. Her mother had a healthy, full-term pregnancy, and Nina’s birth weight
was normal. She did not respond well to breastfeeding and was changed
entirely to a formula based on cow’s milk at 4 weeks. Between 7 and 12 weeks of
age, she was admitted to the hospital twice with a history of screaming after feeding but was discharged after observation without a specific diagnosis. Elimination
of cow’s milk from her diet did not relieve her symptoms; Nina’s mother reported
that the screaming bouts were worse after Nina drank juice and that Nina frequently
had gas and a distended abdomen. At 7 months, she was still thriving (weight above
97th percentile) with no abnormal findings on physical examination. A stool sample
was taken.
I.
DIETARY CARBOHYDRATES
Carbohydrates are the largest source of calories in the average American diet and
usually constitute 40% to 45% of our caloric intake. The plant starches amylopectin and amylose, which are present in grains, tubers, and vegetables, constitute
approximately 50% to 60% of the carbohydrate calories consumed. These starches
are polysaccharides, containing 10,000 to 1 million glucosyl units. In amylose, the
glucosyl residues form a straight chain linked via α-1,4-glycosidic bonds; in amylopectin, the α-1,4-chains contain branches connected via α-1,6-glycosidic bonds
(Fig. 22.1). The other major sugar found in fruits and vegetables is sucrose, a disaccharide of glucose and fructose (see Fig. 22.1). Sucrose and small amounts of
the monosaccharides glucose and fructose are the major natural sweeteners found
in fruit, honey, and vegetables. Dietary fiber, the part of the diet that cannot be
digested by human enzymes of the intestinal tract, is also composed principally of
plant polysaccharides and a polymer called lignin.
Many foods derived from animals, such as meat or fish, contain very little carbohydrate except for small amounts of glycogen (which has a structure similar to
amylopectin) and glycolipids. The major dietary carbohydrate of animal origin is
lactose, a disaccharide composed of glucose and galactose that is found exclusively
in milk and milk products (see Fig. 22.1).
Although all cells require glucose for metabolic functions, neither glucose nor
other sugars are specifically required in the diet. Glucose can be synthesized from
many amino acids found in dietary protein. Fructose, galactose, xylulose, and all
the other sugars required for metabolic processes in the human can be synthesized
from glucose.
II. DIGESTION OF DIETARY CARBOHYDRATES
In the digestive tract, dietary polysaccharides and disaccharides are converted to
monosaccharides by glycosidases, enzymes that hydrolyze the glycosidic bonds
between the sugars. All of these enzymes exhibit some specificity for the sugar, the
Lieberman_Ch22.indd 344
9/16/14 2:07 AM
CHAPTER 22 ■ DIGESTION, ABSORPTION, AND TRANSPORT OF CARBOHYDRATES
CH2OH
O
CH2OH
O
OH
O
345
OH
O
O
α1,4
OH
OH
n
Amylose
CH2OH
O
O
CH2OH
O
OH
OH
O
O α1,6
OH
CH2OH
O
HO
CH2
O
OH
O
OH
O
OH
O
OH
n
Amylopectin
HO
CH2OH
O OH
CH2OH
O
O
OH
OH
β1,4
OH
OH
Glucose
Galactose
Lactose
CH2OH
O
Glucose
HO
OH
OH
HOCH2
Fructose
O α1,2
O
HO
CH2OH
HO
Sucrose
FIG. 22.1. The structures of common dietary carbohydrates. For disaccharides and higher,
the sugars are linked through glycosidic bonds between the anomeric carbon of one sugar and
a hydroxyl group on another sugar. The glycosidic bond may be either α or β, depending on its
position above or below the plane of the sugar containing the anomeric carbon (see Chapter 3,
Section II.A, to review terms used in the description of sugars). The starch amylose is a polysaccharide of glucose residues linked with α-1,4-glycosidic bonds. Amylopectin is amylose
with the addition of α-1,6-glycosidic branch points. Dietary sugars may be monosaccharides
(single sugar residues), disaccharides (two sugar residues), oligosaccharides (several sugar
residues), or polysaccharides (hundreds of sugar residues). For clarity, the hydrogen atoms
are not shown in the figure.
Lieberman_Ch22.indd 345
9/16/14 2:07 AM
346
SECTION V ■ CARBOHYDRATE METABOLISM
Starch
Lactose
Sucrose
Salivary
salivary
␣–amylase
Sucrose
Lactose
␣-Dextrins
Stomach
Pancreas
␣-Amylase
HCO3 –
Tri- and
oligosaccharides
Maltose,
Isomaltose
Maltase
isomaltase
Sucrose
Lactose
Small intestine
Glucose
Sucrase
Glucose
Fructose
Lactase
Glucose
Galactose
Fiber
Colon
Feces
FIG. 22.2. Overview of carbohydrate digestion. Digestion of the carbohydrates occurs first,
followed by absorption of monosaccharides. Subsequent metabolic reactions occur after the
sugars are absorbed.
glycosidic bond (α or β) and the number of saccharide units in the chain. The monosaccharides formed by glycosidases are transported across the intestinal mucosal
cells into the interstitial fluid and subsequently enter the bloodstream. Undigested
carbohydrates enter the colon, where they may be fermented by bacteria (Fig. 22.2).
A. Salivary and Pancreatic `-Amylase
The digestion of starch (amylopectin and amylose) begins in the mouth, where
chewing mixes the food with saliva. The salivary glands secrete approximately 1 L
of liquid per day into the mouth, containing salivary `-amylase and other components. α-Amylase is an endoglucosidase, which means that it hydrolyzes internal
α-1,4 bonds between glucosyl residues at random intervals in the polysaccharide
chains (Fig. 22.3). The shortened polysaccharide chains that are formed are called
`-dextrins. Salivary α-amylase is largely inactivated by the acidity of the stomach
contents, which contain HCl secreted by the parietal cells.
The acidic gastric juice enters the duodenum, the upper part of the small intestine,
where digestion continues. Secretions from the exocrine pancreas (approximately
Lieberman_Ch22.indd 346
9/16/14 2:07 AM
CHAPTER 22 ■ DIGESTION, ABSORPTION, AND TRANSPORT OF CARBOHYDRATES
O
O
O
O
O
O
O
O
HO
O
O
O
347
O
O
O
Starch
O
O
O
O
O
O
O
O
O
Salivary and
pancreatic
␣-amylase H
O
O
HO
O
O
O
O
OH
O
O
O
O
O
O
O
O
O
HO
OH
Isomaltose
Maltose
O
O
O
O
O
O
HO
O
O
O
O
O
OH
Trisaccharides
(and larger oligosaccharides)
HO
O
O
O
O
OH
␣-Dextrins
(oligosaccharides with ␣-1,6-branches)
FIG. 22.3. Action of salivary and pancreatic α-amylase.
1.5 L/day) flow down the pancreatic duct and also enter the duodenum. These
secretions contain bicarbonate (HCO3Ϫ), which neutralizes the acidic pH of stomach
contents, and digestive enzymes, including pancreatic α-amylase.
Pancreatic α-amylase continues to hydrolyze the starches and glycogen, forming the disaccharide maltose, the trisaccharide maltotriose, and oligosaccharides.
These oligosaccharides, called limit dextrins, are usually four to nine glucosyl units
long and contain one or more α-1,6 branches. The two glucosyl residues that contain the α-1,6-glycosidic bond eventually become the disaccharide isomaltose, but
α-amylase does not cleave these branched oligosaccharides all the way down to
isomaltose.
α-Amylase has no activity toward sugar-containing polymers other than glucose
linked by α-1,4 bonds. α-Amylase displays no activity toward the α-1,6 bond at branch
points and has little activity for the α-1,4 bond at the nonreducing end of a chain.
B. Disaccharidases of the Intestinal Brush Border Membrane
Amylase activity in the gut is abundant
and is not normally rate limiting for the
process of digestion. Alcohol-induced
pancreatitis or surgical removal of part of the
pancreas can decrease pancreatic secretion.
Pancreatic exocrine secretion into the intestine
can also be decreased due to cystic fibrosis in
which mucus blocks the pancreatic duct, which
eventually degenerates. However, pancreatic
exocrine secretion can be decreased to 10%
of normal and still not affect the rate of starch
digestion, because amylases are secreted in the
saliva and pancreatic fluid in excessive amounts.
In contrast, protein and fat digestion are more
strongly affected in cystic fibrosis.
The dietary disaccharides lactose and sucrose, as well as the products of starch
digestion, are converted to monosaccharides by glycosidases attached to the membrane in the brush border of absorptive cells. The different glycosidase activities
are found in four glycoproteins: glucoamylase, the sucrase–maltase complex, the
smaller glycoprotein trehalase, and lactase-glucosylceramidase (Table 22.1). These
glycosidases are collectively called the small intestinal disaccharidases, although
glucoamylase is really an oligosaccharidase.
1.
GLUCOAMYLASE
Glucoamylase and the sucrase–isomaltase complex have similar structures and exhibit a great deal of sequence homogeneity. A membrane-spanning domain near
Lieberman_Ch22.indd 347
9/16/14 2:07 AM
348
SECTION V ■ CARBOHYDRATE METABOLISM
Table 22.1 The Different Forms of the Brush Border Glycosidases
Complex
Catalytic Sites
Principal Activities
β-Glucoamylase
α-Glucosidase
Split α-1,4-glycosidic bonds between glucosyl units, beginning sequentially with the
residue at the tail end (nonreducing end)
of the chain. This is an exoglycosidase.
Substrates include amylase, amylopectin, glycogen, and maltose.
Same as above but with slightly different specificity and affinities for the
substrates.
Splits sucrose, maltose, and maltotriose
Splits α-1,6 bonds in several limit dextrins,
as well as the α-1,4 bonds in maltose
and maltotriose
Splits β-glycosidic bonds between glucose
or galactose and hydrophobic residues,
such as the glycolipids glucosylceramide
and galactosylceramide. Also known as
phlorizin hydrolase for its activity on an
artificial substrate.
Splits the β-1,4 bond between glucose and
galactose. To a lesser extent also splits
the β-1,4 bond between some cellulose
disaccharides.
Splits bond in trehalose, which is 2 glucosyl
units linked α-1,1 through their anomeric
carbons.
β-Glucosidase
Sucrase–isomaltase
Sucrase–maltase
Isomaltase–maltase
β-Glycosidase
Glucosylceramidase
Maltose
α-1,4 bond
O
HO
O
OH
O
Lactase
maltase
activity
1
O
O
HO
Trehalase
2
O
O
reducing
end
O
Trehalase
Maltotriose
FIG. 22.4. Glucoamylase activity. Glucoamylase is an α-1,4-exoglycosidase that initiates
cleavage at the nonreducing end of the sugar.
Thus, for maltotriose, the bond labeled 1 is
hydrolyzed first, which then allows the bond at
position 2 to be the next one hydrolyzed.
Individuals with genetic deficiencies
of the sucrase–isomaltase complex
show symptoms of sucrose intolerance but are able to digest normal amounts of
starch in a meal without problems. The maltase
activity in the glucoamylase complex and residual activity in the sucrase–isomaltase complex (which is normally present in excess of
need) is apparently sufficient to digest normal
amounts of dietary starch.
HO
O
O
α-1,6 bond
O
HO
HO
OH
isomaltase
activity
O
O
HO
O
O
O
OH
FIG. 22.5. Isomaltase activity. Arrows indicate the α-1,6 bonds that are cleaved.
Lieberman_Ch22.indd 348
the N-terminal attaches the protein to the luminal membrane. The long polypeptide
chain forms two globular domains, each with a catalytic site. In glucoamylase, the
two catalytic sites have similar activities, with only small differences in substrate
specificity. The protein is heavily glycosylated with oligosaccharides that protect it
from digestive proteases.
Glucoamylase is an exoglucosidase that is specific for the α-1,4 bonds between
glucosyl residues (Fig. 22.4). It begins at the nonreducing end of a polysaccharide
or limit dextrin and sequentially hydrolyzes the bonds to release glucose monosaccharides. It will digest a limit dextrin down to isomaltose, the glucosyl disaccharide
with an α-1,6-branch, that is subsequently hydrolyzed principally by the isomaltase
activity in the sucrase–isomaltase complex.
2.
SUCRASE–ISOMALTASE COMPLEX
The structure of the sucrase–isomaltase complex is similar to that of glucoamylase,
and these two proteins have a high degree of sequence homology. However, after the
single polypeptide chain of sucrase–isomaltase is inserted through the membrane
and the protein protrudes into the intestinal lumen, an intestinal protease clips it
into two separate subunits that remain attached to each other. Each subunit has a
catalytic site that differs in substrate specificity from the other through noncovalent interactions. The sucrase–maltase site accounts for approximately 100% of the
intestine’s ability to hydrolyze sucrose in addition to maltase activity; the isomaltase–maltase site accounts for almost all of the intestine’s ability to hydrolyze α-1,6
bonds (Fig. 22.5), in addition to maltase activity. Together, these sites account for
approximately 80% of the maltase activity of the small intestine. The remainder of
the maltase activity is found in the glucoamylase complex.
3.
TREHALASE
Trehalase is only half as long as the other disaccharidases and has only one catalytic
site. It hydrolyzes the glycosidic bond in trehalose, a disaccharide composed of
two glucosyl units linked by an α-bond between their anomeric carbons (Fig. 22.6).
9/16/14 2:07 AM
CHAPTER 22 ■ DIGESTION, ABSORPTION, AND TRANSPORT OF CARBOHYDRATES
Trehalose, which is found in insects, algae, mushrooms, and other fungi, is not currently a major dietary component in the United States. However, unwitting consumption of trehalose can cause nausea, vomiting, and other symptoms of severe
gastrointestinal distress if consumed by an individual deficient in the enzyme.
Trehalase deficiency was discovered when a woman became very sick after eating
mushrooms and was initially thought to have α-amanitin poisoning.
a-GLYCOSIDASE COMPLEX (LACTASE-GLUCOSYLCERAMIDASE)
The β-glycosidase complex is another large glycoprotein found in the brush border that has two catalytic sites extending in the lumen of the intestine. However,
its primary structure is very different from the other enzymes. The lactase catalytic site hydrolyzes the β-bond connecting glucose and galactose in lactose (a
β-galactosidase activity; Fig. 22.7). The major activity of the other catalytic site
in humans is the β-bond between glucose or galactose and ceramide in glycolipids
(this catalytic site is sometimes called phlorizin hydrolase, named for its ability to
hydrolyze an artificial substrate).
4
HO
LOCATION WITHIN THE INTESTINE
The production of maltose, maltotriose, and limit dextrins by pancreatic α-amylase
occurs in the duodenum, the most proximal portion of the small intestine. Sucrase–
isomaltase activity is highest in the jejunum, where the enzymes can hydrolyze sucrose and the products of starch digestion. β-Glycosidase activity is also highest
in the jejunum. Glucoamylase activity increases progressively along the length of
the small intestine and its activity is highest in the ileum. Thus, it presents a final
opportunity for digestion of starch oligomers that have escaped amylase and disaccharidase activities at the more proximal regions of the intestine.
C. Metabolism of Sugars by Colonic Bacteria
Not all of the starch ingested as part of foods is normally digested in the small
intestine (Fig. 22.8). Starches that are high in amylose or are less well hydrated (e.g.,
starch in dried beans) are resistant to digestion and enter the colon. Dietary fiber
and undigested sugars also enter the colon. Here, colonic bacteria rapidly metabolize the saccharides, forming gases, short-chain fatty acids, and lactate. The major
short-chain fatty acids formed are acetic acid (two carbons), propionic acid (three
carbons), and butyric acid (four carbons). The short-chain fatty acids are absorbed
by the colonic mucosal cells and can provide a substantial source of energy for these
cells. The major gases formed are hydrogen (H2) gas, carbon dioxide (CO2), and
methane (CH4). These gases are released through the colon, resulting in flatulence,
or in the breath. Incomplete products of digestion in the intestines increase the retention of water in the colon, resulting in diarrhea.
H
H
OH
3
H
2
2
H
OH
1
1
H
O
OH
3
H
H
6 4
HOH2C
5
OH
O
OH
H
Glucose Trehalase
activity
4.
5.
Trehalose
6
CH2OH
O
5
H
349
Glucose
FIG. 22.6. Trehalose. This disaccharide contains two glucose moieties linked by an unusual bond that joins their anomeric carbons.
It is cleaved by trehalase.
Nina M. was given a hydrogen
breath test, a test measuring the
amount of hydrogen gas released
after consuming a test dose of sugar. The association of Nina M.’s symptoms with her ingestion of fruit juices suggests that she might have
a problem resulting from low sucrase activity
or an inability to absorb fructose. Her ability to
thrive and her adequate weight gain suggest
that any deficiencies of the sucrase–isomaltase complex must be partial and do not result
in a functionally important reduction in maltase
activity. (Maltase activity is also present in the
glucoamylase complex). Her urine tested negative for sugar, suggesting the problem is in digestion or absorption, because only sugars that
are absorbed and enter the blood can be found
in urine. The basis of the hydrogen breath test is
that if a sugar is not absorbed, it is metabolized
in the intestinal lumen by bacteria that produce
various gases, including hydrogen. The test is
often accompanied by measurements of the
amount of sugar that appear in the blood or
feces and acidity of the feces.
D. Lactose Intolerance
Lactose intolerance refers to a condition of pain, nausea, and flatulence after the
ingestion of foods containing lactose, most notably dairy products. Although it
is often caused by low levels of lactase, it also can be caused by intestinal injury
(defined in the following text). The lactose that is not absorbed is converted by colonic bacteria to lactic acid, CH4 gas, and H2 gas (Fig. 22.9). The osmotic effect of
the lactose and lactic acid in the bowel lumen is responsible for the diarrhea often
seen as part of this syndrome. Similar symptoms can result from sensitivity to milk
proteins (milk intolerance) or from the malabsorption of other dietary sugars.
Lactose
CH2OH
O
HO H
NONPERSISTENT AND PERSISTENT LACTASE
Lactase activity increases in the human from about 6 to 8 weeks of gestation, and
it rises during the late gestational period (27 to 32 weeks) through full term. It remains high for about 1 month after birth and then begins to decline. For most of
Lieberman_Ch22.indd 349
bond
O
H
OH
H
H
OH
Galactose
1.
β-1,4
lactase
CH2OH
O
OH
H
OH
H H
H
OH
Glucose
FIG. 22.7. Lactase activity. Lactase is a
β-galactosidase. It cleaves the β-galactoside
lactose, the major sugar in milk, forming
galactose and glucose.
9/16/14 2:07 AM
350
SECTION V ■ CARBOHYDRATE METABOLISM
CH2OH
CH2OH
O
H
H
O
OH
H
CH2OH
O
O
OH
β(1 4)
H
OH
Cellulose
O
H
H
OH
β-1,4-linked glucose
O
OH
H
H
OH
n
O
CH2OH
O
HO H
COOH
O
O
H
HOH2C
OH
OH
H
H
OH
H
HOH2C
H
O
OH
H
OH
HO
HO H
H OH
H
H
H OH
H
β-D-Xylose
α-L-Arabinose
H
H
OH
COCH3
O
HO H
OH
H
O
H
OH
H
OH
N C CH3
OH
H
H
N-AcetylMethylated
galactosamine
galacturonic acid
OH
H
Galacturonic
acid
• Found in hemicelluloses, gums and mucilages
• Components of pectin
Galactose
CH2OH
O
HOO2SO
CH2OH
O
OH
H OH
H
H
H
OH
Galactose-4-SO4
• Component of carrageenan
H
HO
H OH
H
CH2OH
H O
CH
CH
OH
CH2OH
O
CH2
O
H
HO OH
H
H
O
OH
OH
H
CH2OH
H
OH
Sucrose
OCH3
H
OH
Phenyl propane
derivatives
• Found in lignin
Raffinose
FIG. 22.8. Some indigestible carbohydrates. These compounds are components of dietary fiber.
the world’s population, lactase activity decreases to adult levels at approximately
5 to 7 years of age. Adult levels are less than 10% of that present in infants. These
populations have adult hypolactasia (formerly called adult lactase deficiency) and
exhibit the lactase nonpersistence phenotype. In people who are derived mainly
from western Northern Europeans and milk-dependent Nomadic tribes of Saharan
Africa, the levels of lactase remain at or only slightly below infant levels throughout
adulthood (lactase persistence phenotype). Thus, adult hypolactasia is the normal
condition for most of the world’s population.
In contrast, congenital lactase deficiency is a severe autosomal recessive inherited disease in which lactase activity is significantly reduced or totally absent. The
disorder presents as soon as the newborn is fed breast milk or lactose-containing formula, resulting in watery diarrhea, weight loss, and dehydration. Treatment consists
of removal of lactose from the diet, which allows for normal growth and development to occur.
Lieberman_Ch22.indd 350
9/16/14 2:07 AM
CHAPTER 22 ■ DIGESTION, ABSORPTION, AND TRANSPORT OF CARBOHYDRATES
2.
INTESTINAL INJURY
Intestinal diseases that injure the absorptive cells of the intestinal villi diminish
lactase activity along the intestine, producing a condition known as secondary lactase deficiency. Kwashiorkor (protein malnutrition), colitis, gastroenteritis, tropical
and nontropical sprue, and excessive alcohol consumption fall into this category.
These diseases also affect other disaccharidases, but sucrase, maltase, isomaltase,
and glucoamylase activities are usually present at such excessive levels that there
are no pathological effects. Lactase is usually the first activity lost and the last to
recover.
Lactose
(1 glass of milk,
about 200 mL)
Lactasedeficient
cells
Intestinal
lumen
III. DIETARY FIBER
Dietary fiber is the portion of the diet resistant to digestion by human digestive enzymes. It consists principally of plant materials that are polysaccharide derivatives
and lignin (see Fig. 22.8). The components of fiber are often divided into the categories of soluble and insoluble fiber, according to their ability to dissolve in water.
Insoluble fiber consists of three major categories: cellulose, hemicellulose, and lignins. Soluble fiber categories include pectins, mucilages, and gums (see the online
Table A22.1
). Although human enzymes cannot digest fiber, the bacterial flora
in the normal human gut may metabolize the more soluble dietary fibers to gases
and short-chain fatty acids, much as they do undigested starch and sugars. Some of
these fatty acids may be absorbed and used by the colonic epithelial cells of the gut,
and some may travel to the liver through the hepatic portal vein. We may obtain as
much as 10% of our total calories from compounds produced by bacterial digestion
of substances in our digestive tract.
In 2005, the Committee on Dietary Reference Intakes issued new guidelines for
fiber ingestion; anywhere from 25 to 38 g/day, depending on age and sex of the individual. It was also recommended that 14 g of fiber should accompany every 1,000
calories ingested. No distinction was made between soluble and insoluble fibers.
Adult males between the ages of 14 and 49 years require 38 g of fiber per day; males
aged 50 years or more are recommended to consume 30 g of fiber per day. Females
from ages 4 to 8 years require 25 g/day; from ages 9 to 16 years, 26 g/day; and from
ages 19 to 50 years, 25 g/day. Women older than 50 years of age are recommended
to consume 21 g of fiber per day. These numbers are increased during pregnancy
and lactation. One beneficial effect of fiber is seen in diverticular disease in which
sacs or pouches may develop in the colon because of a weakening of the muscle and
submucosal structures. Fiber is thought to “soften” the stool, thereby reducing pressure on the colonic wall and enhancing expulsion of feces.
IV. ABSORPTION OF SUGARS
Once the carbohydrates have been split into monosaccharides, the sugars are transported across the intestinal epithelial cells and into the blood for distribution to
all tissues. Not all complex carbohydrates are digested at the same rate within the
intestine, and some carbohydrate sources lead to a near-immediate rise in blood
glucose levels after ingestion, whereas others slowly raise blood glucose levels over
an extended period after ingestion. The glycemic index of a food is an indication of
how rapidly blood glucose levels rise after consumption. Glucose and maltose have
the highest glycemic indices (142, with white bread defined as an index of 100).
Online Table A22.2
indicates the glycemic index for a variety of food types. It is
of interest to note that cornflakes and potatoes have high glycemic indices, whereas
yogurt and skim milk have particularly low glycemic indices.
351
Gas
Bacterial
fermentation
Lactic
acid
Osmotic
effect
H 2O
Fluid
load
(1,000 mL)
Distention of
gut walls
Peristalsis
Malabsorption
Fats, Proteins, Drugs
Watery diarrhea
(1L extracellular liquid lost
per 9 g lactose in
1 glass of milk)
FIG. 22.9. Summary of the metabolic fate
of lactose in lactase-deficient individuals. The
bacteria in the intestine metabolize the lactose to gases and lactic acid, which generates
an osmotic imbalance between the intestinal
lumen and the cells lining the lumen. Water
leaves the cells lining the intestinal lumen to
correct this osmotic imbalance, which leads to
a watery diarrhea.
A. Absorption by the Intestinal Epithelium
Glucose is transported through the absorptive cells of the intestine by facilitated diffusion and by Naϩ-dependent facilitated transport. (See Chapter 8 for a description
of transport mechanisms.) Glucose, therefore, enters the absorptive cells by binding
Lieberman_Ch22.indd 351
9/16/14 2:07 AM
352
SECTION V ■ CARBOHYDRATE METABOLISM
Lumen
Na+
Fructose
Glucose
Galactose
Mucosal side
Brush
border
Intestinal
epithelium
ATP
Fructose Glucose
Na+
Galactose
Serosal side
3 Na+
2 K+
ADP
+ Pi
3 Na+
2 K+
To capillaries
, Na+-glucose cotransporters
, Facilitated glucose transporters
, Na+,K+-ATPase
FIG. 22.10. Naϩ-dependent and facilitative transporters in the intestinal epithelial cells. Both glucose and fructose are transported by the facilitated glucose transporters on the luminal and serosal sides of the absorptive cells. Glucose and galactose are transported by the Naϩ-glucose
cotransporters on the luminal (mucosal) side of the absorptive cells.
The glycemic response to ingested
foods depends not only on the glycemic index of the foods but also on
the fiber and fat content of the food as well as
its method of preparation. Highly glycemic carbohydrates can be consumed before and after
exercise because their metabolism results in a
rapid entry of glucose into the blood, where it
is then immediately available for muscle use.
Low-glycemic carbohydrates enter the circulation slowly and can be used to best advantage
if consumed before exercise such that as exercise progresses, glucose is slowly being absorbed from the intestine into the circulation in
which it can be used to maintain blood glucose
levels during the exercise period.
to transport proteins, membrane-spanning proteins that bind the glucose molecule
on one side of the membrane and release it on the opposite side. This is necessary
because the glucose molecule is extremely polar and cannot diffuse through the
hydrophobic phospholipid bilayer of the cell membrane. Each hydroxyl group of
the glucose molecule forms at least two hydrogen bonds with water molecules, and
random movement would require energy to dislodge the polar hydroxyl groups from
their hydrogen bonds and to disrupt the Van der Waals forces between the hydrocarbon tails of the fatty acids in the membrane phospholipid. Two types of glucose
transport proteins are present in the intestinal absorptive cells: the Naϩ-dependent
glucose transporters and the facilitative glucose transporters (Fig. 22.10).
NAϩ-DEPENDENT TRANSPORTERS
1.
ϩ
Na -dependent glucose transporters, which are located on the luminal side of the
absorptive cells, enable these cells to concentrate glucose from the intestinal lumen.
The dietician explained to Deborah S. the rationale for a person with diabetes to
take an American Diabetes Association diet plan. It is important for Deborah to
add a variety of fibers to her diet. The gel-forming, water-retaining pectins and
gums delay gastric emptying and retard the rate of absorption of disaccharides and monosaccharides, thus reducing the rate at which blood glucose levels rise. The glycemic index
of foods also needs to be considered for appropriate maintenance of blood glucose levels
in persons with diabetes. Consumption of a low glycemic index diet results in a lower rise in
blood glucose levels after eating, which can be more easily controlled by exogenous insulin. For example, Deborah S. is advised to eat pasta and rice (glycemic indices of 67 and 65,
respectively) instead of potatoes (glycemic index of 80 to 120, depending on the method of
preparation) and to incorporate breakfast cereals composed of wheat bran, barley, and oats
into her morning routine.
Lieberman_Ch22.indd 352
9/16/14 2:07 AM
CHAPTER 22 ■ DIGESTION, ABSORPTION, AND TRANSPORT OF CARBOHYDRATES
353
A low intracellular Naϩ concentration is maintained by a Naϩ,Kϩ-ATPase on the
serosal (blood) side of the cell that uses the energy from adenosine triphosphate
(ATP) cleavage to pump Naϩ out of the cell into the blood. Thus, the transport of
glucose from a low concentration in the lumen to a high concentration in the cell is
promoted by the cotransport of Naϩ from a high concentration in the lumen to a low
concentration in the cell (secondary active transport). Similar transporters are found
in the epithelial cells of the kidney, which are thus able to transport glucose against
its concentration gradient.
2.
FACILITATIVE GLUCOSE TRANSPORTERS
Facilitative glucose transporters, which do not bind Naϩ, are located on the serosal side of the cells. Glucose moves via the facilitative transporters from the high
concentration inside the cell to the lower concentration in the blood without the
expenditure of energy. In addition to the Naϩ-dependent glucose transporters, facilitative transporters for glucose also exist on the luminal side of the absorptive cells.
The various types of facilitative glucose transporters found in the plasma membranes of cells (referred to as GLUT 1 to GLUT 5) are described in Table 22.2. One
common structural theme to these proteins is that they all contain 12 membranespanning domains. Note that the sodium-linked transporter on the luminal side of
the intestinal epithelial cell is not a member of the GLUT family.
3.
GALACTOSE AND FRUCTOSE ABSORPTION THROUGH
GLUCOSE TRANSPORTERS
Galactose is absorbed through the same mechanisms as glucose. It enters the absorptive cells on the luminal side via the Naϩ-dependent glucose transporters and
facilitative glucose transporters and is transported through the serosal side on the
facilitative glucose transporters.
Fructose both enters and leaves absorptive epithelial cells by facilitated diffusion,
apparently via transport proteins that are part of the GLUT family. The transporter
on the luminal side has been identified as GLUT 5. Although this transporter can
transport glucose, it has a much higher activity with fructose (see Fig. 22.10). Other
fructose transport proteins may also be present. For reasons as yet unknown, fructose is absorbed at a much more rapid rate when it is ingested as sucrose than when
it is ingested as a monosaccharide.
Table 22.2 Properties of the GLUT 1 to GLUT 5 Isoforms of the
Glucose Transport Proteins
Transporter
Tissue Distribution
Comments
GLUT 1
Human erythrocyte
Blood–brain barrier
Blood–retinal barrier
Blood–placental barrier
Blood–testis barrier
Liver
Kidney
Pancreatic β-cell
Serosal surface of intestinal
mucosa cells
Brain (neurons)
Expressed in cell types with barrier functions;
a high-affinity glucose transport system.
GLUT 2
GLUT 3
GLUT 4
Adipose tissue
Skeletal muscle
Heart muscle
GLUT 5
Intestinal epithelium
Spermatozoa
A high-capacity, low-affinity transporter
May be used as the glucose sensor in the
pancreas
Major transporter in the central nervous
system; a high-affinity system
Insulin-sensitive transporter. In the presence of
insulin, the number of GLUT 4 transporters
increases on the cell surface; a high-affinity
system.
This is actually a fructose transporter.
Genetic techniques have identified additional GLUT transporters (GLUT 6 to 12), but the role
of these transporters has not yet been fully described.
Lieberman_Ch22.indd 353
9/16/14 2:07 AM