Ebook High-Yield biochemistry (3rd edition): Part 1
Bạn đang xem bản rút gọn của tài liệu. Xem và tải ngay bản đầy đủ của tài liệu tại đây (749.36 KB, 56 trang )
LWW-WILCOX-08-0701-0FM.qxd
1/16/09
2:18 PM
High-Yield
Biochemistry
THIRD EDITION
TM
Page i
LWW-WILCOX-08-0701-0FM.qxd
1/16/09
2:18 PM
Page ii
LWW-WILCOX-08-0701-0FM.qxd
1/16/09
2:18 PM
High-Yield
Biochemistry
THIRD EDITION
R. Bruce Wilcox, PhD
Professor of Biochemistry
Loma Linda University
Loma Linda, California
TM
Page iii
LWW-WILCOX-08-0701-0FM.qxd
1/16/09
2:18 PM
Page iv
Acquisitions Editor: Susan Rhyner
Managing Editor: Kelley A. Squazzo
Marketing Manager: Jennifer Kuklinski
Project Manager: Paula C. Williams
Designer: Terry Mallon
Production Services: Cadmus Communications, a Cenveo Company
Third Edition
Copyright © 2010, 2004, 1999 by Lippincott Williams & Wilkins, a Wolters Kluwer business.
351 West Camden Street
Baltimore, MD 21201
530 Walnut Street
Philadelphia, PA 19106
Printed in United States of America
All rights reserved. This book is protected by copyright. No part of this book may be reproduced or transmitted
in any form or by any means, including as photocopies or scanned-in or other electronic copies, or utilized by
any information storage and retrieval system without written permission from the copyright owner, except
for brief quotations embodied in critical articles and reviews. Materials appearing in this book prepared by
individuals as part of their official duties as U.S. government employees are not covered by the abovementioned copyright. To request permission, please contact Lippincott Williams & Wilkins at 530 Walnut
Street, Philadelphia, PA 19106, via email at , or via website at lww.com (products and
services).
9 8 7 6 5 4 3 2 1
Library of Congress Cataloging-in-Publication Data
Wilcox, R. Bruce.
High-yield biochemistry / R. Bruce Wilcox. — 3rd ed.
p. ; cm.
Includes index.
ISBN 978-0-7817-9924-9 (alk. paper)
1. Biochemistry—Outlines, syllabi, etc. I. Title.
[DNLM: 1. Biochemistry—Outlines. QU 18.2 W667h 2010]
QP514.2.W52 2010
572—dc22
2008032773
DISCLAIMER
Care has been taken to confirm the accuracy of the information present and to describe generally accepted
practices. However, the authors, editors, and publisher are not responsible for errors or omissions or for any
consequences from application of the information in this book and make no warranty, expressed or implied,
with respect to the currency, completeness, or accuracy of the contents of the publication. Application of this
information in a particular situation remains the professional responsibility of the practitioner; the clinical
treatments described and recommended may not be considered absolute and universal recommendations.
The authors, editors, and publisher have exerted every effort to ensure that drug selection and dosage set
forth in this text are in accordance with the current recommendations and practice at the time of publication.
However, in view of ongoing research, changes in government regulations, and the constant flow of
information relating to drug therapy and drug reactions, the reader is urged to check the package insert
for each drug for any change in indications and dosage and for added warnings and precautions. This is
particularly important when the recommended agent is a new or infrequently employed drug.
Some drugs and medical devices presented in this publication have Food and Drug Administration (FDA)
clearance for limited use in restricted research settings. It is the responsibility of the health care provider to
ascertain the FDA status of each drug or device planned for use in their clinical practice.
To purchase additional copies of this book, call our customer service department at (800) 638-3030 or fax
orders to (301) 223-2320. International customers should call (301) 223-2300.
Visit Lippincott Williams & Wilkins on the Internet: . Lippincott Williams & Wilkins
customer service representatives are available from 8:30 am to 6:00 pm, EST.
LWW-WILCOX-08-0701-0FM.qxd
1/16/09
2:18 PM
Page v
This book is dedicated to my father, H. Bruce Wilcox, for endowing me with a passionate love for
teaching, and to the freshman medical and dental students at Loma Linda University who for over
40 years have paid tuition at confiscatory rates so that I have never had to go to work.
LWW-WILCOX-08-0701-0FM.qxd
1/16/09
2:18 PM
Page vi
Preface
High-Yield Biochemistry is based on a series of notes prepared in response to repeated and impassioned requests by my students for a “complete and concise” review of biochemistry. It is designed
for rapid review during the last days and hours before the United States Medical Licensing
Examination (USMLE), Step 1, and the National Board of Medical Examiners subject exams in biochemistry. Although this book provides information for a speedy review, always remember that you
cannot review what you never knew.
vi
LWW-WILCOX-08-0701-0FM.qxd
1/16/09
2:18 PM
Page vii
Acknowledgments
Dr. John Sands provided invaluable help in reviewing and editing Chapter 11, “Biotechnology,”
for the first edition. While preparing for the second edition, Lisa Umphrey, a third-year medical
student at Loma Linda University, generously gave me access to her notations in the first edition.
Katherine Noyes and Daniel Rogstad, graduate students in Biochemistry at Loma Linda
University, gave generously of their time and expertise in assisting with revisions to Chapter 10,
“Gene Expression” and Chapter 11, “Biochemical Technology” in the second edition. Daniel
Rogstad assisted me again during preparation of the third edition. I am also indebted to Dr. J. Paul
Stauffer at Pacific Union College for instruction in the felicitous use of English, to P.G.
Wodehouse for continuing and enriching that instruction, and to General U.S. Grant for providing an example of clear and laconic communication.
vii
LWW-WILCOX-08-0701-0FM.qxd
1/16/09
2:18 PM
Page viii
Contents
Preface . . . . . . . . . . . . . . . . . . . . . . . . . . . . . . . . . . . . . . . . . . . . . . . . . . . . . . . . . . . . . . . . . . vi
Acknowledgments . . . . . . . . . . . . . . . . . . . . . . . . . . . . . . . . . . . . . . . . . . . . . . . . . . . . . . . . vii
1 Acid–Base Relationships
I.
II.
III.
IV.
V.
VI.
Acidic dissociation . . . . . . . . . . . . . . . . . . . . . . . . . . . . . . . . . . . . . . . . . . . . . . . . . . . . 1
Measures of acidity . . . . . . . . . . . . . . . . . . . . . . . . . . . . . . . . . . . . . . . . . . . . . . . . . . . . 1
Buffers . . . . . . . . . . . . . . . . . . . . . . . . . . . . . . . . . . . . . . . . . . . . . . . . . . . . . . . . . . . . . . 2
Acid–base balance . . . . . . . . . . . . . . . . . . . . . . . . . . . . . . . . . . . . . . . . . . . . . . . . . . . . . 3
Acid–base disorders . . . . . . . . . . . . . . . . . . . . . . . . . . . . . . . . . . . . . . . . . . . . . . . . . . . 3
Clinical relevance: diabetic ketoacidosis . . . . . . . . . . . . . . . . . . . . . . . . . . . . . . . . . . . 4
2 Amino Acids and Proteins
I.
II.
III.
IV.
V.
VI.
..................................................1
..................................................5
Functions of proteins . . . . . . . . . . . . . . . . . . . . . . . . . . . . . . . . . . . . . . . . . . . . . . . . . . 5
Proteins as polypeptides . . . . . . . . . . . . . . . . . . . . . . . . . . . . . . . . . . . . . . . . . . . . . . . . 5
Protein structure . . . . . . . . . . . . . . . . . . . . . . . . . . . . . . . . . . . . . . . . . . . . . . . . . . . . . . 6
Protein solubility and R-groups . . . . . . . . . . . . . . . . . . . . . . . . . . . . . . . . . . . . . . . . . . 9
Protein denaturation . . . . . . . . . . . . . . . . . . . . . . . . . . . . . . . . . . . . . . . . . . . . . . . . . . . 9
Clinical relevance . . . . . . . . . . . . . . . . . . . . . . . . . . . . . . . . . . . . . . . . . . . . . . . . . . . . . 9
3 Enzymes . . . . . . . . . . . . . . . . . . . . . . . . . . . . . . . . . . . . . . . . . . . . . . . . . . . . . . . . . . . . . . . . 11
I.
II.
III.
IV.
V.
VI.
VII.
Energy relationships . . . . . . . . . . . . . . . . . . . . . . . . . . . . . . . . . . . . . . . . . . . . . . . . . . 11
Free-energy change . . . . . . . . . . . . . . . . . . . . . . . . . . . . . . . . . . . . . . . . . . . . . . . . . . . 11
Enzymes as biological catalysts . . . . . . . . . . . . . . . . . . . . . . . . . . . . . . . . . . . . . . . . . 12
Michaelis-Menten equation . . . . . . . . . . . . . . . . . . . . . . . . . . . . . . . . . . . . . . . . . . . . . 13
Lineweaver-Burk equation . . . . . . . . . . . . . . . . . . . . . . . . . . . . . . . . . . . . . . . . . . . . . 14
Enzyme regulation . . . . . . . . . . . . . . . . . . . . . . . . . . . . . . . . . . . . . . . . . . . . . . . . . . . 15
Clinical relevance: methanol and ethylene glycol poisoning . . . . . . . . . . . . . . . . . . . 18
4 Citric Acid Cycle and Oxidative Phosphorylation
I.
II.
III.
IV.
viii
. . . . . . . . . . . . . . . . . . . . . . . . . . . . . . 19
Cellular energy and adenosine triphosphate . . . . . . . . . . . . . . . . . . . . . . . . . . . . . . . 19
Citric acid cycle . . . . . . . . . . . . . . . . . . . . . . . . . . . . . . . . . . . . . . . . . . . . . . . . . . . . . 19
Products of the citric acid cycle (one revolution) . . . . . . . . . . . . . . . . . . . . . . . . . . . 20
Synthetic function of the citric acid cycle . . . . . . . . . . . . . . . . . . . . . . . . . . . . . . . . . 20
LWW-WILCOX-08-0701-0FM.qxd
1/16/09
2:18 PM
Page ix
CONTENTS
V.
VI.
VII.
VIII.
Regulation of the citric acid cycle . . . . . . . . . . . . . . . . . . . . . . . . . . . . . . . . . . . . . . . . 21
Electron transport and oxidative phosphorylation . . . . . . . . . . . . . . . . . . . . . . . . . . . 21
Chemiosmotic hypothesis . . . . . . . . . . . . . . . . . . . . . . . . . . . . . . . . . . . . . . . . . . . . . . 21
Clinical relevance . . . . . . . . . . . . . . . . . . . . . . . . . . . . . . . . . . . . . . . . . . . . . . . . . . . . 23
5 Carbohydrate Metabolism
I.
II.
III.
IV.
V.
VI.
VII.
VIII.
. . . . . . . . . . . . . . . . . . . . . . . . . . . . . . . . . . . . . . . . . . . . . . . . . 24
Carbohydrate digestion and absorption . . . . . . . . . . . . . . . . . . . . . . . . . . . . . . . . . . . 24
Glycogen metabolism . . . . . . . . . . . . . . . . . . . . . . . . . . . . . . . . . . . . . . . . . . . . . . . . . 24
Glycolysis . . . . . . . . . . . . . . . . . . . . . . . . . . . . . . . . . . . . . . . . . . . . . . . . . . . . . . . . . . 25
Gluconeogenesis . . . . . . . . . . . . . . . . . . . . . . . . . . . . . . . . . . . . . . . . . . . . . . . . . . . . . 27
Regulation of glycolysis and gluconeogenesis . . . . . . . . . . . . . . . . . . . . . . . . . . . . . . 29
Pentose phosphate pathway . . . . . . . . . . . . . . . . . . . . . . . . . . . . . . . . . . . . . . . . . . . . 29
Sucrose and lactose metabolism . . . . . . . . . . . . . . . . . . . . . . . . . . . . . . . . . . . . . . . . . 31
Clinical relevance . . . . . . . . . . . . . . . . . . . . . . . . . . . . . . . . . . . . . . . . . . . . . . . . . . . . 31
6 Lipid Metabolism
I.
II.
III.
IV.
V.
VI.
VII.
VIII.
IX.
ix
. . . . . . . . . . . . . . . . . . . . . . . . . . . . . . . . . . . . . . . . . . . . . . . . . . . . . . . . 33
Lipid function . . . . . . . . . . . . . . . . . . . . . . . . . . . . . . . . . . . . . . . . . . . . . . . . . . . . . . . 33
Lipid digestion . . . . . . . . . . . . . . . . . . . . . . . . . . . . . . . . . . . . . . . . . . . . . . . . . . . . . . 33
Lipoprotein transport and metabolism . . . . . . . . . . . . . . . . . . . . . . . . . . . . . . . . . . . . 34
Oxidation of fatty acids . . . . . . . . . . . . . . . . . . . . . . . . . . . . . . . . . . . . . . . . . . . . . . . . 36
Fatty acid synthesis . . . . . . . . . . . . . . . . . . . . . . . . . . . . . . . . . . . . . . . . . . . . . . . . . . . 37
Glycerolipid synthesis . . . . . . . . . . . . . . . . . . . . . . . . . . . . . . . . . . . . . . . . . . . . . . . . . 40
Sphingolipid synthesis . . . . . . . . . . . . . . . . . . . . . . . . . . . . . . . . . . . . . . . . . . . . . . . . 42
Cholesterol synthesis . . . . . . . . . . . . . . . . . . . . . . . . . . . . . . . . . . . . . . . . . . . . . . . . . 42
Clinical relevance . . . . . . . . . . . . . . . . . . . . . . . . . . . . . . . . . . . . . . . . . . . . . . . . . . . . 43
7 Amino Acid Metabolism . . . . . . . . . . . . . . . . . . . . . . . . . . . . . . . . . . . . . . . . . . . . . . . . . . . 45
I.
II.
III.
IV.
V.
Functions of amino acids . . . . . . . . . . . . . . . . . . . . . . . . . . . . . . . . . . . . . . . . . . . . . . 45
Removal of amino acid nitrogen . . . . . . . . . . . . . . . . . . . . . . . . . . . . . . . . . . . . . . . . . 45
Urea cycle and detoxification of NH4ϩ . . . . . . . . . . . . . . . . . . . . . . . . . . . . . . . . . . . . . 45
Carbon skeletons of amino acids . . . . . . . . . . . . . . . . . . . . . . . . . . . . . . . . . . . . . . . . 47
Clinical relevance: inherited (inborn) errors of amino acid metabolism . . . . . . . . . . 49
8 Nucleotide Metabolism
I.
II.
III.
IV.
V.
VI.
VII.
. . . . . . . . . . . . . . . . . . . . . . . . . . . . . . . . . . . . . . . . . . . . . . . . . . . 52
Nucleotide structure . . . . . . . . . . . . . . . . . . . . . . . . . . . . . . . . . . . . . . . . . . . . . . . . . . 52
Nucleotide function . . . . . . . . . . . . . . . . . . . . . . . . . . . . . . . . . . . . . . . . . . . . . . . . . . 52
Purine nucleotide synthesis . . . . . . . . . . . . . . . . . . . . . . . . . . . . . . . . . . . . . . . . . . . . 52
Pyrimidine nucleotide synthesis . . . . . . . . . . . . . . . . . . . . . . . . . . . . . . . . . . . . . . . . . 55
Deoxyribonucleotide synthesis . . . . . . . . . . . . . . . . . . . . . . . . . . . . . . . . . . . . . . . . . . 56
Nucleotide degradation . . . . . . . . . . . . . . . . . . . . . . . . . . . . . . . . . . . . . . . . . . . . . . . . 59
Clinical relevance . . . . . . . . . . . . . . . . . . . . . . . . . . . . . . . . . . . . . . . . . . . . . . . . . . . . 60
9 Nutrition
. . . . . . . . . . . . . . . . . . . . . . . . . . . . . . . . . . . . . . . . . . . . . . . . . . . . . . . . . . . . . . . 62
I. Energy needs . . . . . . . . . . . . . . . . . . . . . . . . . . . . . . . . . . . . . . . . . . . . . . . . . . . . . . . . 62
II. Macronutrients . . . . . . . . . . . . . . . . . . . . . . . . . . . . . . . . . . . . . . . . . . . . . . . . . . . . . . 62
III. Micronutrients: the fat-soluble vitamins . . . . . . . . . . . . . . . . . . . . . . . . . . . . . . . . . . 65
LWW-WILCOX-08-0701-0FM.qxd
x
1/16/09
2:18 PM
Page x
CONTENTS
IV. Micronutrients: the water-soluble vitamins . . . . . . . . . . . . . . . . . . . . . . . . . . . . . . . . 68
V. Minerals . . . . . . . . . . . . . . . . . . . . . . . . . . . . . . . . . . . . . . . . . . . . . . . . . . . . . . . . . . . . 71
10 Gene Expression
I.
II.
III.
IV.
V.
VI.
. . . . . . . . . . . . . . . . . . . . . . . . . . . . . . . . . . . . . . . . . . . . . . . . . . . . . . . . . 74
Genetic information . . . . . . . . . . . . . . . . . . . . . . . . . . . . . . . . . . . . . . . . . . . . . . . . . . 74
DNA and RNA: nucleic acid structure . . . . . . . . . . . . . . . . . . . . . . . . . . . . . . . . . . . . 74
DNA synthesis (replication) . . . . . . . . . . . . . . . . . . . . . . . . . . . . . . . . . . . . . . . . . . . . 76
Transcription . . . . . . . . . . . . . . . . . . . . . . . . . . . . . . . . . . . . . . . . . . . . . . . . . . . . . . . . 79
Translation (protein synthesis) . . . . . . . . . . . . . . . . . . . . . . . . . . . . . . . . . . . . . . . . . . 82
Mutations . . . . . . . . . . . . . . . . . . . . . . . . . . . . . . . . . . . . . . . . . . . . . . . . . . . . . . . . . . 85
11 Biochemical Technology . . . . . . . . . . . . . . . . . . . . . . . . . . . . . . . . . . . . . . . . . . . . . . . . . . 87
I.
II.
III.
IV.
V.
Protein purification . . . . . . . . . . . . . . . . . . . . . . . . . . . . . . . . . . . . . . . . . . . . . . . . . . . 87
Protein analysis . . . . . . . . . . . . . . . . . . . . . . . . . . . . . . . . . . . . . . . . . . . . . . . . . . . . . . 87
DNA analysis . . . . . . . . . . . . . . . . . . . . . . . . . . . . . . . . . . . . . . . . . . . . . . . . . . . . . . . . 88
Cloning of recombinant DNA and protein . . . . . . . . . . . . . . . . . . . . . . . . . . . . . . . . . 91
Clinical relevance . . . . . . . . . . . . . . . . . . . . . . . . . . . . . . . . . . . . . . . . . . . . . . . . . . . . 94
12 Hormones
I.
II.
III.
IV.
V.
VI.
VII.
VIII.
IX.
X.
. . . . . . . . . . . . . . . . . . . . . . . . . . . . . . . . . . . . . . . . . . . . . . . . . . . . . . . . . . . . . . 95
Overview . . . . . . . . . . . . . . . . . . . . . . . . . . . . . . . . . . . . . . . . . . . . . . . . . . . . . . . . . . . 95
Classification of hormones . . . . . . . . . . . . . . . . . . . . . . . . . . . . . . . . . . . . . . . . . . . . . 95
Mechanisms of hormone action . . . . . . . . . . . . . . . . . . . . . . . . . . . . . . . . . . . . . . . . . 96
Hormones that regulate fuel metabolism . . . . . . . . . . . . . . . . . . . . . . . . . . . . . . . . . . 97
Hormones that regulate salt and water balance . . . . . . . . . . . . . . . . . . . . . . . . . . . . . 98
Hormones that regulate calcium and phosphate metabolism . . . . . . . . . . . . . . . . . . 99
Hormones that regulate body size and metabolism . . . . . . . . . . . . . . . . . . . . . . . . . . 99
Hormones that regulate the male reproductive system . . . . . . . . . . . . . . . . . . . . . . 100
Hormones that regulate the female reproductive system . . . . . . . . . . . . . . . . . . . . . 100
Clinical relevance: diabetes mellitus . . . . . . . . . . . . . . . . . . . . . . . . . . . . . . . . . . . . . 101
Index . . . . . . . . . . . . . . . . . . . . . . . . . . . . . . . . . . . . . . . . . . . . . . . . . . . . . . . . . . . . . . . . . . 102
LWW-WILCOX-08-0701-001.qxd
1/16/09
2:19 PM
Page 1
Chapter 1
Acid–Base Relationships
I
Acidic Dissociation
A. An acid dissociates in water to yield a hydrogen ion (Hϩ) and its conjugate base.
Acid
(acetic acid)
CH3COOH
m
Conjugate base
(acetate)
Hϩ ϩ CH3COOϪ
H2O
B. A base combines with H+ in water to form its conjugate acid.
Base
(ammonia)
NH3 ϩ Hϩ
m
Conjugate acid
(ammonium ion)
NHϩ4
H2O
C. In the more general expression of acidic dissociation, HA is the acid (proton donor)
and A؊ is the conjugate base (proton acceptor).
HA
II
k1
m
kϪ1
Hϩ ϩ AϪ
Measures of Acidity
A. pKa
1.
When acidic dissociation is at equilibrium, the acidic dissociation constant, Ka, is
defined by:
+
–
k a = [H ][A ]
HA
2.
3.
4.
pKa is defined as –log[Ka].
pKa is a measure of the strength of an acid.
Stronger acids are more completely dissociated. They have low pKa values
5.
(Hϩ binds loosely to the conjugate base). Examples of stronger acids include the
first dissociable Hϩ of phosphoric acid (pKa ϭ 2.14) and the carboxyl group of
glycine (pKa ϭ 2.34).
Weaker acids are less completely dissociated. They have high pKa values. (Hϩ
binds tightly to the conjugate base.) Examples of weaker acids include the amino
group of glycine (pKa ϭ 9.6) and the third dissociable Hϩ of phosphoric acid
(pKa ϭ 12.4).
1
LWW-WILCOX-08-0701-001.qxd
2
10/21/08
4:49 PM
Page 2
CHAPTER 1
B. pH
1.
When the equation defining Ka is further rearranged and expressed in logarithmic
form, it becomes the Henderson-Hasselbalch equation:
pH =
2.
III
pK a + log [A – ]
[HA]
pH is a measure of the acidity of a solution.
a. By definition, pH equals –log[H؉].
b. A neutral solution has a pH of 7.
c. An acidic solution has a pH of less than 7.
d. An alkaline solution has a pH of greater than 7.
Buffers
A. A buffer is a solution that contains a mixture of a weak acid and its conjugate base. It
resists changes in [Hϩ] on addition of acid or alkali.
B. The buffering capacity of a solution is determined by the concentrations of weak acid
and conjugate base.
1. The maximum buffering effect occurs when the concentration of the weak acid
[HA] is equal to that of its conjugate base [AϪ].
2. If [AϪ] ϭ [HA], then [AϪ]/[HA] ϭ 1.
3. When the buffer effect is at its maximum, the pH of the solution equals the pKa
of the acid.
10.0
10.0
9.0
9.0
8.0
8.0
7.0
7.0
6.0
6.0
5.0
4.0
pKa = 4.7
Buffer
region
pH
pH
C. The buffering effect is readily apparent on the titration curve for a weak acid such as
H2PO4Ϫ (Figure 1-1).
1. The shape of the titration curve is the same for all weak acids.
2. At the midpoint of the curve, the pH equals the pKa.
3. The buffering region extends one pH unit above and below the pKa.
pKa = 6.7
5.0
4.0
3.0
3.0
2.0
2.0
1.0
1.0
0.0
0.0 0.1 0.2 0.3 0.4 0.5 0.6 0.7 0.8 0.9 1.0
0.0
0.0 0.1 0.2 0.3 0.4 0.5 0.6 0.7 0.8 0.9 1.0
Equivalents of alkali
Buffer
region
Equivalents of alkali
● Figure 1-1 Titration curves for acetic acid (CH3COOH) (left) and phosphoric acid (H2POϪ
) (right). H2POϪ
is the more
4
4
effective buffer at physiologic pH.
LWW-WILCOX-08-0701-001.qxd
10/21/08
4:49 PM
Page 3
ACID–BASE RELATIONSHIPS
IV
3
Acid–Base Balance
A. Because pH strongly affects the stability of proteins and the catalytic activity of enzymes,
biological systems usually function best near neutrality, that is, near pH ؍7. Under
normal conditions, blood pH is 7.4 (range, 7.37–7.42).
B. The acid–base pair dihydrogen phosphate (H2PO4؊)-monohydrogen phosphate
(HPO42؊) is an effective buffer at physiologic pH (see Figure 1-1). Phosphate is an
important buffer in the cytoplasm.
C. The carbon dioxide (CO2)-carbonic acid (H2CO3)-bicarbonate (HCOϪ
) system is the
3
principal buffer in plasma and extracellular fluid (ECF).
Carbonic anhydrase
CO2 ϩ H2O
1.
2.
3.
4.
m
H2CO3
m
Hϩ ϩ HCOϪ
3
CO2 from tissue oxidation reactions dissolves in the blood plasma and ECF.
CO2 combines with H2O to yield H2CO3. This reaction is catalyzed in red blood
cells by carbonic anhydrase.
H2CO3 dissociates to yield Hϩ and its conjugate base, HCO3Ϫ.
In this system, CO2 is behaving like an acid, so the Henderson-Hasselbalch equation can be written:
pH ϭ 6.1 ϩ log [HCOϪ
]/(0.0301) PCO2
3
where [HCO3Ϫ] is in mM and PCO2 is in mm Hg.
D. The CO2-H2CO3-HCO3؊ buffer system is effective around the physiologic pH of 7.4,
even though the pKa is only 6.1, for four reasons:
1. The supply of CO2 from oxidative metabolism is unlimited, so the effective concentration of CO2 is very high.
2. Equilibration of CO2 with H2CO3 (catalyzed by carbonic anhydrase) is very rapid.
3. The variation in CO2 removal by the lungs (respiration) allows for rapid changes
in the concentration of the H2CO3.
4. The kidney can produce or excrete HCOϪ
, thus changing the concentration of the
3
conjugate base.
V
Acid–Base Disorders
A. ACIDOSIS occurs when the pH of the blood and ECF falls below 7.35. This condition
results in central nervous system depression, and when severe, it can lead to coma and
death.
1. In metabolic acidosis, the [HCO3؊] decreases as a consequence of the addition of
an acid stronger than H2CO3 to the ECF.
2. In respiratory acidosis, the partial pressure of CO2 (PCO2) increases as a result
of hypoventilation (Figure 1-2).
B. ALKALOSIS occurs when the pH of the blood and ECF rises above 7.45. This condition leads to neuromuscular hyperexcitability, and when severe, it can result in tetany.
1. In metabolic alkalosis, the [HCO3؊] increases as a consequence of excess acid loss
(e.g., vomiting) or addition of a base (e.g., oral antacid preparations).
2. In respiratory alkalosis, the PCO2 decreases as a consequence of hyperventilation.
LWW-WILCOX-08-0701-001.qxd
4
10/21/08
4:49 PM
Page 4
CHAPTER 1
Normal
Normal ranges
Metabolic
acidosis
50
alkalosis
Respiratory
acidosis
alkalosis
48
23–25 mM
HCO3–
HCO3– (mM)
40
30
20
Pco2
Pco2 (mm Hg)
38–42 mm Hg
0
pH
12
pH = 7.4
10
pH = 7.26
pH = 7.22
30
20
30
40
pH = 7.7
22
pH = 7.65
10
7.37–7.42
26.5
24
40
20
45
50
60
60
● Figure 1-2 Bar chart that demonstrates prototypical acid–base states of extracellular fluid (ECF). HCOϪ
is plotted up
3
from zero, and PCO2 is plotted down from zero.
VI
Clinical Relevance: Diabetic Ketoacidosis
A. Uncontrolled insulin-dependent diabetes mellitus (type I diabetes) involves
decreased glucose utilization, with hyperglycemia, and increased fatty acid oxidation.
B. PATHOGENESIS OF KETOACIDOSIS
1. Increased fatty acid oxidation leads to excessive production of acetoacetic and
3-hydroxybutyric acids and of acetone, which are known as ketone bodies.
2. Acetoacetic and 3-hydroxybutyric acids dissociate at body pH and release Hϩ,
leading to a metabolic acidosis.
C. The combination of high blood levels of the ketone bodies and a metabolic acidosis is
called ketoacidosis.
D. The clinical picture involves dehydration, lethargy, and vomiting, followed by drowsiness and coma.
E. THERAPY consists of correcting the hyperglycemia, dehydration, and acidosis.
1. Insulin is administered to correct the hyperglycemia.
2. Fluids in the form of physiologic saline are administered to treat the dehydration.
3. In severe cases, intravenous sodium bicarbonate (NaϩHCO3Ϫ) may be administered
to correct the acidosis.
LWW-WILCOX-08-0701-002.qxd
1/16/09
2:18 PM
Page 5
Chapter 2
Amino Acids and Proteins
I
Functions of Proteins
A. Specific binding to other molecules
B. Catalysis
C. Structural support
D. Coordinated motion
II
Proteins as Polypeptides
A. Proteins are polypeptides: polymers of amino acids linked together by peptide bonds
(Figure 2-1).
1. Proteins are synthesized from 20 different amino acids.
2. Some of the amino acids are modified after incorporation into proteins (e.g., by
hydroxylation, carboxylation, phosphorylation, or glycosylation). This is called
post-translational modification.
B. The amino acids are called ␣-amino acids because they have an amino (–NH2) group,
a carboxyl (–COOH) group, and some other “R-group” attached to the ␣-carbon (see
Figure 2-1).
1. Aliphatic R-groups that are nonpolar (uncharged, hydrophobic) (see Figure 2-2)
are characteristic of alanine, valine, leucine, isoleucine, and proline, which is an
imino acid (a secondary amine). Glycine has hydrogen (-H) as its R-group.
2. Aromatic R-groups are components of phenylalanine, tyrosine, and tryptophan
(see Figure 2-2). Phenylalanine and tryptophan are nonpolar. Tyrosine contains a
polar hydroxyl group.
3. Hydroxyl-containing R-groups that are mildly polar (uncharged, hydrophilic)
are part of serine and threonine (see Figure 2-2).
4. Sulfur-containing R-groups are characteristic of cysteine (a good reducing agent)
and methionine (see Figure 2-2).
5. Carbonyl-containing R-groups include the carboxylates aspartic acid and glutamic acid and their amides asparagine and glutamine. The carboxylates are negatively charged and polar, and their amides are uncharged and mildly polar (see
Figure 2-2).
6. Basic R-groups, which are positively charged and polar (hydrophilic), are characteristic of lysine, arginine, and histidine (see Figure 2-2).
5
LWW-WILCOX-08-0701-002.qxd
6
10/21/08
4:50 PM
Page 6
CHAPTER 2
Peptide bond
Carboxyl group
Amino group
COO–
COOH
H2N
C
H
+
H3N
C
H
R
R
α-Amino acid
(formal structure)
α-Amino acid
[ionized (zwitterion) structure
predominates at physiologic pH]
R1
H2N
C
C
H
O
H
R2 O
N
C
C
OH
H
Dipeptide
(formal structure)
● Figure 2-1 Structure of an ␣-amino acid and a dipeptide.
C. Each protein has a characteristic shape, or conformation.
1.
2.
III
The function of a protein is a consequence of its conformation. The conformation of a functional protein is also called its native structure.
The amino acid sequence of a protein determines its conformation.
a. The rigid, planar nature of peptide bonds dictates the conformation that a
protein can assume.
b. The nature and arrangement of the R-groups further determine the conformation.
Protein Structure
Four levels of hierarchy in protein conformation can be described.
A. PRIMARY STRUCTURE refers to the order of the amino acids in the peptide chain
(Figure 2-3).
1. The free ␣-amino group, written to the left, is called the amino-terminal or
N-terminal end.
2. The free ␣-carboxyl group, written to the right, is called the carboxyl-terminal or
C-terminal end.
B. SECONDARY STRUCTURE is the arrangement of hydrogen bonds between the peptide
nitrogens and the peptide carbonyl oxygens of different amino acid residues (Figure 2-4;
see also Figure 2-3).
1. In helical coils, the hydrogen-bonded nitrogens and oxygens are on nearby amino
acid residues (see Figure 2-3).
a. The most common helical coil is a right-handed ␣-helix.
b. ␣-keratin from hair and nails is an ␣-helical protein.
c. Myoglobin has several α-helical regions.
d. Proline, glycine, and asparagine are seldom found in α-helices; they are “helix
breakers.”
2. In -sheets (pleated sheets), the hydrogen bonds occur between residues on
neighboring peptide chains (see Figure 2-3).
a. The hydrogen bonds may be on different chains or distant regions of the same
chain.
b. The strands may run parallel or antiparallel.
c. Fibroin in silk is a -sheet protein.
C. TERTIARY STRUCTURE refers to the three-dimensional arrangement of a polypeptide
chain that has assumed its secondary structure (see Figure 2-3). Disulfide bonds
between cysteine residues may stabilize tertiary structure.
LWW-WILCOX-08-0701-002.qxd
10/21/08
4:50 PM
Page 7
AMINO ACIDS AND PROTEINS
7
Aliphatic, nonpolar
COO–
+
H3N
C
H
COO–
+
H3N
H
C
COO–
COO–
+
H
H3N
C
+
H3N
H
H3C
Alanine
(Ala)
H3N
Valine
(Val)
C
H
+
H2 N
CH2
H2 C
CH2
CH3
Leucine
(Leu)
Isoleucine
(Ile)
Proline
(Pro)
Sulfur-containing
COO–
+
CH3
CH2
CH3
COO–
H
H
HC
Aromatic
H 3N
C
CH
CH3
H3C
Glycine
(Gly)
H
CH2
CH
CH3
C
COO–
+
COO–
+
H3N
C
CH2
COO–
+
H
H3N
CH2
C
H
COO–
+
H3N
CH2
NH
C
H
COO–
+
H3N
C
H
CH2
CH2
SH
CH2
S
OH
Phenylalanine
(Phe)
CH3
Tyrosine
(Tyr)
Tryptophan
(Trp)
Hydroxyl, polar
H3N
C
H
CH2
Methionine
(Met)
Basic, polar
COO–
+
Cysteine
(Cys)
COO–
+
H3N
C
H
H
C
OH
OH
COO–
+
H3N
CH3
C
H
COO–
H3N
+
C
H
COO–
H3N
+
C
H
CH2
CH2
CH2
CH2
CH2
C
CH2
CH2
CH2
NH
+
NH3
NH
CH
C
N
+
H
+
C
NH2
NH2
Serine
(Ser)
Threonine
(Thr)
Acidic, polar
Lysine
(Lys)
COO–
+
H3N
C
H
Arginine
(Arg)
COO–
+
H3N
C
H
Histidine
(His)
COO–
+
H3N
C
H
COO–
+
H3N
C
H
CH2
CH2
CH2
CH2
COO–
C
CH2
CH2
COO–
C
O
NH2
Aspartic acid
(Asp)
Asparagine
(Asn)
Glutamic acid
(Glu)
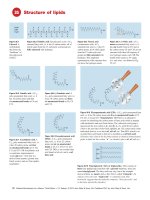
● Figure 2-2 The 20 amino acids found in proteins, grouped by the properties of their R-groups.
O
NH2
Glutamine
(Gln)
LWW-WILCOX-08-0701-002.qxd
8
10/21/08
4:50 PM
Page 8
CHAPTER 2
Primary structure
(always written with the free amino group to the left):
R1 O
+
H3N
C
C
Rn
R2 O
N
C
N
C
C
COO–
H
H
Secondary structures
α-Helix
(intramolecular
hydrogen bonds)
β-Pleated sheet
(intramolecular
hydrogen bonds)
Tertiary structure
Quaternary structure
Subunit 2
Subunit 1
● Figure 2-3 The four levels of protein structure.
H
R1
N
CH2
C
H
R2
N
CH2
O
Hydrogen bond
H
R3
N
CH2
C
H
R4
N
CH2
O
● Figure 2-4 A hydrogen bond between a carbonyl oxygen and an amide nitrogen of two peptide bonds.
D. QUATERNARY STRUCTURE is the arrangement of the subunits of a protein that has
more than one polypeptide chain (see Figure 2-3).
E. LEFT-HANDED HELICAL STRANDS are wound into a supercoiled triple helix in collagen.
The major structural protein in the body, collagen makes up 25% of all vertebrate protein.
a. The primary structure of collagen includes long stretches of the repeating
sequence glycine-X-Y, where X and Y are frequently proline or lysine. The high
LWW-WILCOX-08-0701-002.qxd
10/21/08
4:50 PM
Page 9
AMINO ACIDS AND PROTEINS
9
proportion of proline residues leads to formation of the left-handed helical
strands.
b. Only glycine has an R-group small enough to fit into the interior of the righthanded triple helix.
c. Collagen also contains hydroxyproline and hydroxylysine. The hydroxyl
groups are added to proline and lysine residues by post-translational modification.
IV
Protein Solubility and R-Groups
A. GLOBULAR PROTEINS that are soluble in aqueous saline solution have their nonpolar, hydrophobic R-groups folded to the inside. In contrast, their polar, hydrophilic
R-groups tend to be exposed on the surface.
B. MEMBRANE PROTEINS, which are in a nonpolar environment, have their hydrophobic R-groups on the surface.
V
Protein Denaturation
Denaturation of proteins (unfolding into random coils) may result from exposure to a variety of agents.
A. Extremes of pH (e.g., strong acid or alkali)
B. Ionic detergents [e.g., sodium dodecylsulfate (SDS)]
C. Chaotropic agents (e.g., urea, guanidine)
D. Heavy metal ions (e.g., Hg؉؉)
E. Organic solvents (e.g., alcohol or acetone)
F.
High temperature
G. Surface films (e.g., as when egg whites are beaten)
VI
Clinical Relevance
A. SICKLE CELL ANEMIA. In the mutant sickle cell hemoglobin (Hgb S), the hydrophobic valine replaces the hydrophilic glutamate at position 6 of the -chain of normal
hemoglobin A (Hgb A).
1. Sickle cell disease. Individuals with the homozygous genotype (SS) have only
Hgb S in their red blood cells (RBCs).
a. Deoxygenated Hgb S produces fibrous precipitates, leading to the formation
of misshapen RBCs known as sickle cells.
b. The fragile sickle cells have a shorter life span than normal RBCs, causing
severe anemia.
c. These dense, inflexible sickle cells may have difficulty passing through the
tissue capillaries, resulting in vaso-occlusion.
d. Thus, in addition to anemia, affected patients may have acute episodes of vasoocclusion (sickle cell crisis), with disabling pain that requires hospitalization.
LWW-WILCOX-08-0701-002.qxd
10
10/21/08
4:50 PM
Page 10
CHAPTER 2
2. SICKLE CELL TRAIT. INDIVIDUALS WITH THE HETEROZYGOUS GENOTYPE
(AS) have both Hgb A and Hgb S in their RBCs.
a. Patients are usually asymptomatic, with no anemia.
b. They may have episodes of hematuria owing to sickling in the renal medulla
that is mild and self-limiting.
c. Sickling may occur upon exposure to high altitude or extremes of exercise and
dehydration.
B. SCURVY. This condition is caused by defective collagen synthesis resulting from a
vitamin C (ascorbic acid) deficiency.
1. Selected consequences of abnormal collagen in scurvy include:
a. Defective wound healing
b. Defective tooth formation
c. Loosening of teeth
d. Bleeding gums
e. Rupture of capillaries
2. Ascorbic acid is required for the hydroxylation of proline and lysine during posttranslational processing of collagen.
a. After the polypeptide chain has been synthesized on the rough endoplasmic
reticulum, some of the proline and lysine residues are converted to hydroxyproline and hydroxylysine.
b. The hydroxylating reaction requires an enzyme (hydroxylase), O2, and Fe2ϩ.
c. Ascorbate is required to maintain the iron in its active oxidation state (Fe2ϩ).
3. Hydroxyproline forms interchain hydrogen bonds that stabilize the collagen triple
helix. The signs and symptoms of scurvy are the result of weakened collagen when
these hydrogen bonds are missing.
LWW-WILCOX-08-0701-003.qxd
1/16/09
3:05 PM
Page 11
Chapter 3
Enzymes
I
Energy Relationships
A. CELLS NEED ENERGY TO DO WORK, which may involve:
1. Synthesis
2. Movement
3. Transport across membranes
B. CELLS OBTAIN ENERGY FROM CHEMICAL REACTIONS. The free-energy change
(⌬G) is the quantity of energy from these reactions that is available to do work.
II
Free-Energy Change
A. FREE-ENERGY CHANGE AND THE EQUILIBRIUM CONSTANT
1. The ⌬G of a reaction A ϩ B m C ϩ D is:
∆G = ∆G0' + RTln
2.
[C][D]
[A][B]
where ⌬G0Ј is the standard free-energy change (when the concentrations of all
the reactants and products are 1M and the pH ϭ 7), R is the gas constant (1.987
cal/mol-K), and T is the absolute temperature.
When the reaction has reached equilibrium, [C] [D]/[A] [B] ϭ Keq and ⌬G ؍0,
so ⌬G0Ј is related to Keq as follows:
⌬G0Ј ϭ ϪRTlnKeq
3.
Table 3-1 shows numerical relationships between ⌬G0Ј and Keq at 37ЊC (310Њ
absolute).
B. THERMODYNAMIC FAVORABILITY
1. Exergonic reactions, in which Keq is greater than 1 and ⌬G0Ј is negative, are
referred to as spontaneous. (Under standard conditions, the reaction goes to the
right so that the final concentration of the products, C and D, is greater than that
of the reactants, A and B.)
2. Endergonic reactions, in which Keq is less than 1 and ⌬G0Ј is positive, are referred
to as nonspontaneous. (Under standard conditions, the reaction goes to the left so
that the final concentration of the reactants, A and B, is greater than that of the
products, C and D.)
11
LWW-WILCOX-08-0701-003.qxd
12
10/21/08
4:51 PM
Page 12
CHAPTER 3
TABLE 3-1
3.
NUMERICAL RELATIONSHIPS BETWEEN
⌬G0 AND KEQ AT 37؇C
⌬G0
Keq
ϩ4255
ϩ2837
ϩ1418
0
Ϫ1418
Ϫ2837
Ϫ4255
Ϫ7092
0.001
0.01
0.1
1.0
10.0
100.0
1000.0
100,000.0
⌬G0 (and spontaneity) cannot predict favorability under intracellular conditions. Intracellular favorability is a function of actual concentrations as well as Keq.
⌬G, not ⌬G0, defines intracellular favorability.
a. For example, aldolase, one of the reactions in the pathway for oxidizing glucose (glycolysis), has a ⌬G0Ј of about 5500 cal/mol. The Keq is 0.001. Under
standard conditions, the reaction is unfavorable and goes to the left.
b. If the concentrations of the reactants and products in the aldolase reaction are
0.0001 M (a reasonable intracellular value), the ⌬G is Ϫ173 cal/mol. Under
intracellular conditions, the reaction is favorable and goes to the right.
C. ENTHALPY, ENTROPY, AND FREE-ENERGY CHANGE
1. Enthalpy. The enthalpy change (⌬H) is the amount of heat generated or absorbed
by a reaction.
2. Entropy. The entropy change (⌬S) is a measure of the change in the randomness
or disorder of the system.
a. Entropy increases when a salt crystal dissolves, when a solute diffuses from a
more concentrated to a less concentrated solution, and when a protein is denatured.
b. Entropy decreases when a larger, more complex molecule is synthesized from
smaller, simpler substrates.
3. Free-energy change is related to enthalpy and entropy as follows:
⌬G ϭ ⌬H Ϫ T⌬S
where T is the absolute temperature (ЊK).
III
Enzymes As Biological Catalysts
These molecules control the rate of biological reactions.
A. For a reaction where reactant A is converted to product B (A→B), ⌬G of the reactant
and product can be plotted against a “reaction coordinate,” which represents the
progress of the reaction under standard conditions (Figure 3-1).
B. DIRECTION OF REACTION
1. Because catalysts do not change the ⌬G0Ј they do not alter the extent or the direction of the reaction.
2. If the free energy of the ground state of B is lower than that of A, the ⌬G is negative, and the reaction proceeds to the right (i.e., toward B).
LWW-WILCOX-08-0701-003.qxd
10/21/08
4:51 PM
Page 13
ENZYMES
A-B
13
†
†
Free energy (G)
∆G uncat
†
∆G cat
A
Ground
state
0'
∆G A➞B
B
Ground
state
Reaction progress (A➞B)
● Figure 3-1 The effect of a catalyst on the activation energy of the chemical reaction A→B. The solid line represents
the reaction in the absence of a catalyst, and the dotted line, the reaction in the presence of a catalyst.
3.
If, on the other hand, the free energy of the ground state of A is lower than that of
B, the ⌬G is positive, and the reaction proceeds to the left (i.e., toward A).
C. RATE OF REACTION
1. The ⌬G0Ј provides no information concerning the rate of conversion from A to B.
2. When A is converted to B, it must go through an energy barrier called the transition state, A-B†.
a. The activation energy (⌬G†) is the energy required to scale the energy barrier
and form the transition state.
b. The greater the ⌬G†, the lower the rate of the reaction converting A to B.
D. Like other catalysts, enzymes introduce a new reaction pathway.
1. The ⌬G† is lower.
2. The reaction rate is faster.
IV
Michaelis-Menten Equation
This expression describes the kinetics of enzyme reactions.
A. In enzyme-catalyzed reactions, substrates bind to enzymes at their active sites, where
conversion to products occurs, followed by the release of unchanged enzymes.
E+S
k1
k2
3
ES ⎯k⎯
→E+P
where E is the enzyme; S the substrate; ES the enzyme–substrate complex; P the product; and k1, k2, and k3 are rate constants.
B. The ES complex is a transition state with a lower ⌬G† than the uncatalyzed reaction.